Turkey Tables Market (2026-2032) | Value, Share, Trends, Industry, Revenue, Growth, Forecast, Size, Companies, Outlook & Analysis
Market Forecast By Types (Fabric, Leather, Metal, Wooden, Others), By Applications (Family, Office, Others) And Competitive Landscape
| Product Code: ETC034678 | Publication Date: Oct 2020 | Updated Date: Jun 2026 | Product Type: Report | |
| Publisher: 6Wresearch | Author: Sachin Kumar Rai | No. of Pages: 70 | No. of Figures: 35 | No. of Tables: 5 |
Turkey Tables Market Summary
The turkey tables market was estimated at USD 179 Million in 2025 and is projected to reach USD 233 Million by 2032, growing at a CAGR of 4.6% from 2026 to 2032.
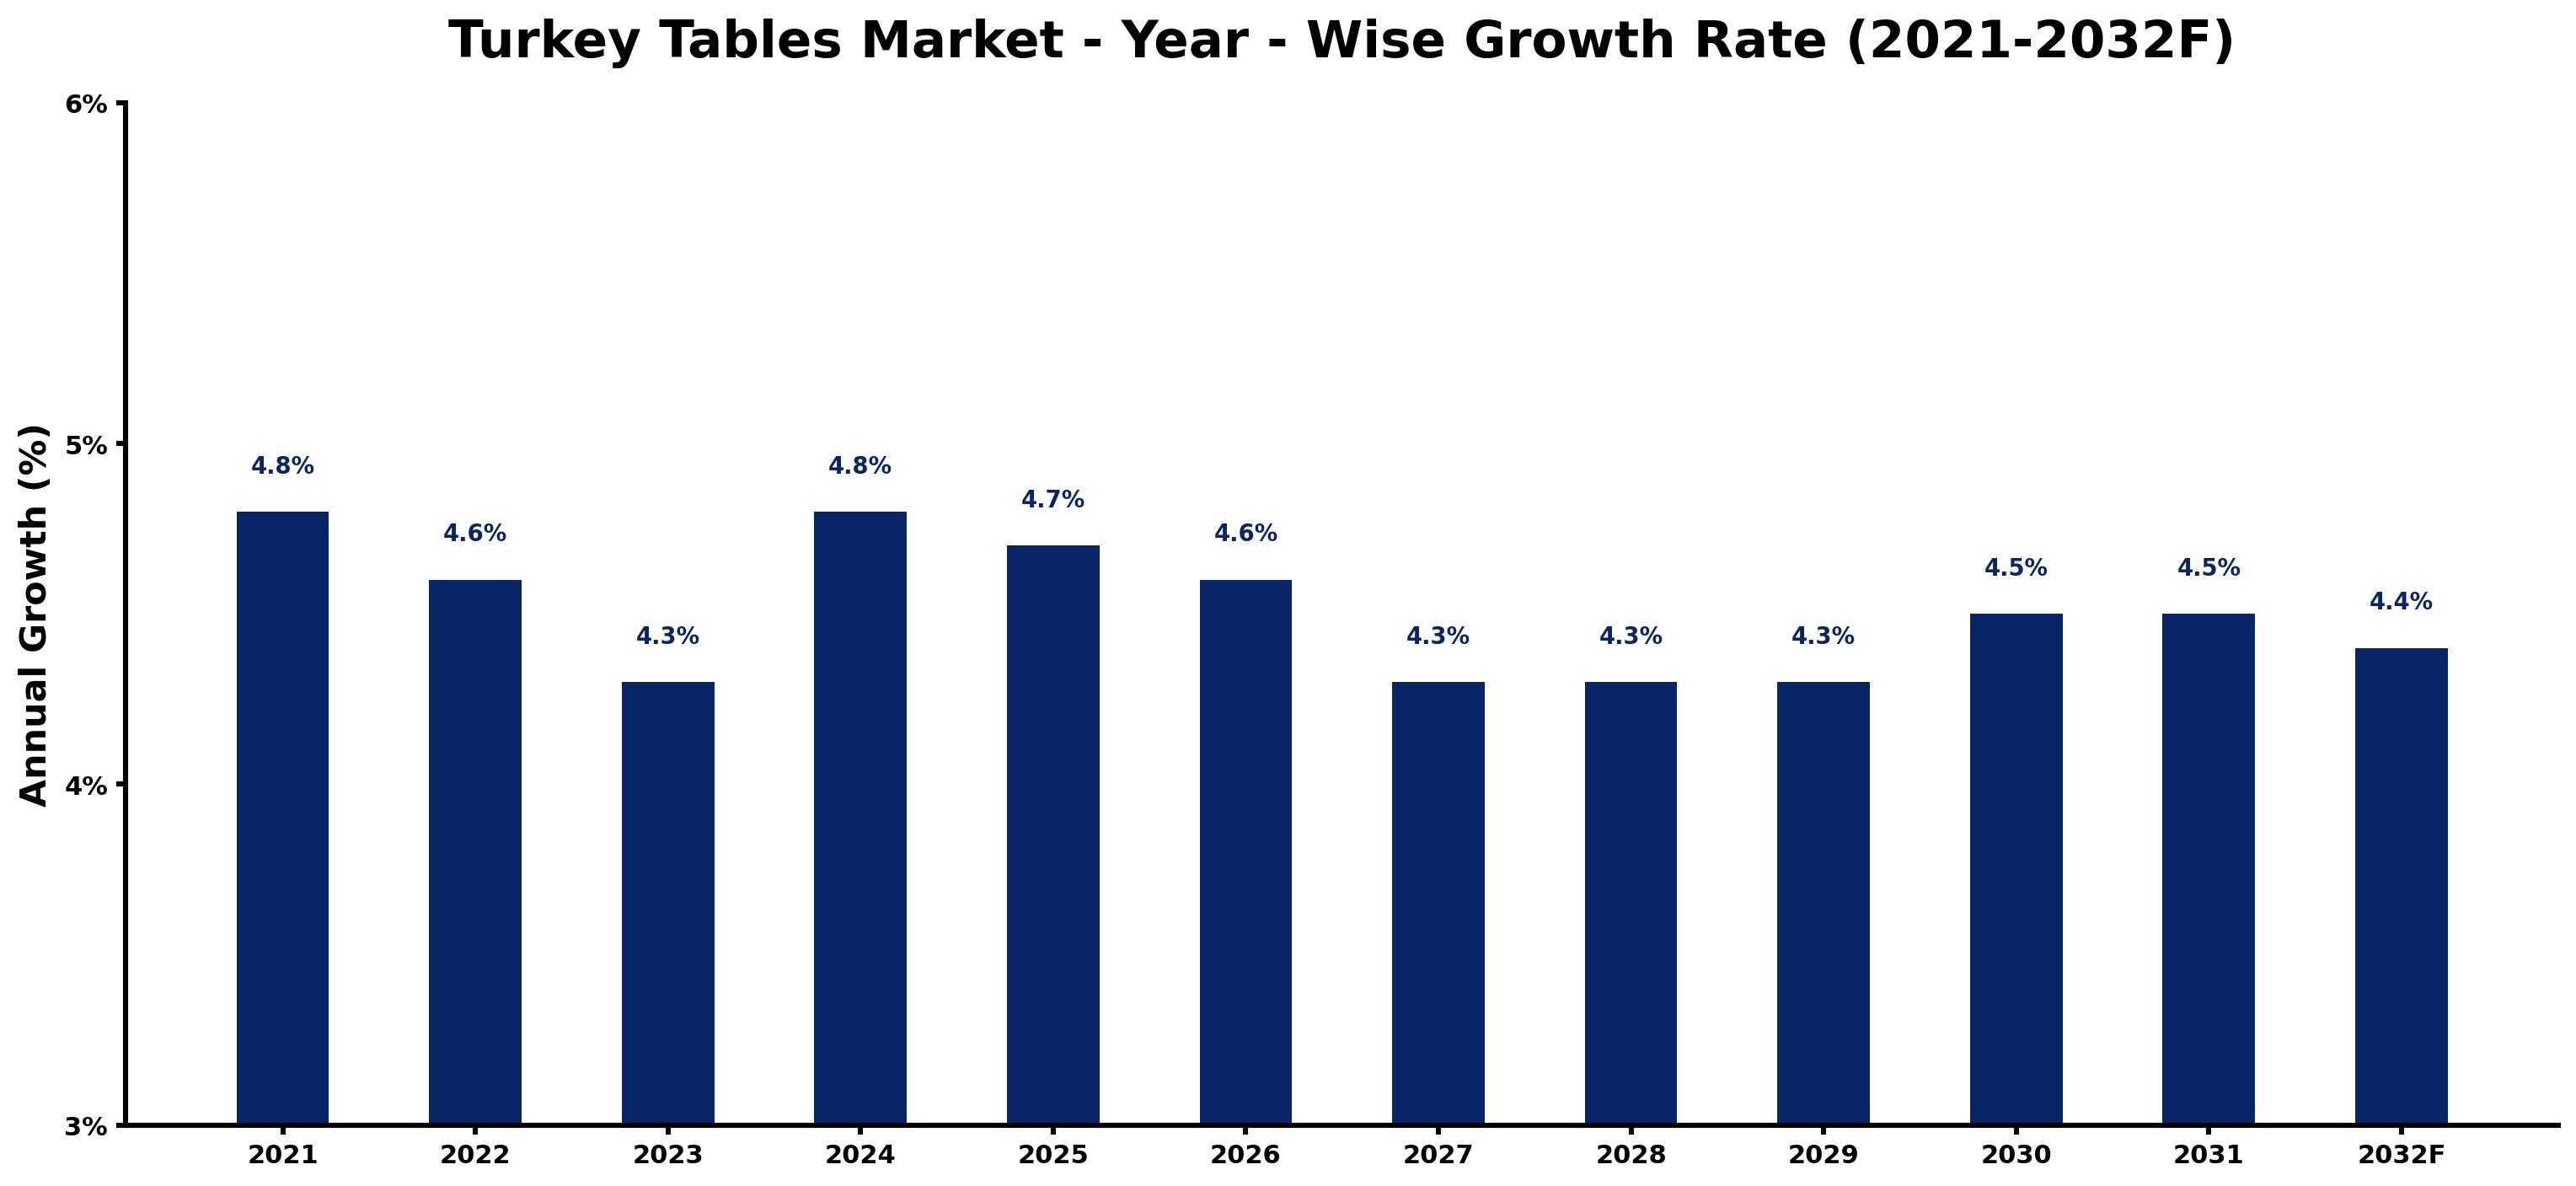
Turkey Tables Market Growth Rate Analysis (2021-2032)
The Turkey tables market has shown stable growth, recording annual increases of 4.8% in 2021, slightly tapering to 4.6% in 2022 and further to 4.3% in 2023. However, projections indicate a rebound with growth rates climbing back to 4.8% in 2024. This fluctuation can be attributed to consumer demand for furniture that blends functionality with aesthetics, as well as ongoing investments in digitalization and e-commerce platforms facilitating furniture sales. Infrastructure developments and an expanding middle class are also critical, fueling demand as consumers seek both home and office solutions. By 2032, the market is expected to maintain a growth rate of 4.4%, reflecting persistent interest and steady economic conditions.
Turkey Tables Market Year-wise Growth Rate and Key Drivers
This graph highlights how the Turkey Tables Market has steadily grown over the past five years, supported by major growth factors.
The table below presents the year wise growth rates along with the key drivers influencing the market
| Year | Growth Rate | Major Drivers |
| 2021 | 4.8% | Post-lockdown retail projects prompted a revival in furniture showrooms across Turkey. |
| 2022 | 4.6% | Consumer trends shifted towards sustainable materials, boosting eco-friendly table designs. |
| 2023 | 4.3% | E-commerce platforms expanded, offering diverse Turkish table designs to broader audiences. |
| 2024 | 4.8% | Urbanization trends increased demand for multifunctional furniture in metropolitan areas. |
| 2025 | 4.7% | Luxury home segments experienced growth, favoring custom-designed tables for affluent buyers. |
| 2026 | 4.6% | Interior design trends focused on blending traditional craftsmanship with modern aesthetics. |
| 2027 | 4.3% | Young professionals valued stylish, compact furniture solutions for smaller living spaces. |
| 2028 | 4.3% | Collaborations between local artisans and designers enhanced unique table offerings. |
| 2029 | 4.3% | Online customer reviews influenced purchasing decisions, driving quality table craftsmanship. |
| 2030 | 4.5% | Adaptation to remote work led to increased dining table usage for multifunctional purposes. |
| 2031 | 4.5% | Local manufacturing initiatives reduced lead times, improving table availability and variety. |
| 2032 | 4.4% | Cultural festivals and events spurred interest in artisanal tables, celebrating Turkish heritage. |
Note - Market size estimations and growth projections presented in this report are based on 6Wresearch's advanced forecasting approach, validated with industry datasets as of June 2026.
Turkey Tables Market Synopsis
The Turkey Tables Market is projected to reach 4.6% and witness significant growth during the forecast period (2026-2032). This expansion is fueled by increasing disposable income among consumers, evolving lifestyle preferences, and a heightened demand for diverse furniture products. Renowned for their high-quality craftsmanship and distinctive designs, Turkish tables attract both domestic and international consumers. The market offers various table types, including dining tables, coffee tables, and outdoor furniture, tailored to meet diverse consumer preferences.
Turkey Tables Market Growth Drivers
The Turkey Tables Market is influenced by several key growth drivers:
- The increase in disposable income among the Turkish population enables consumers to invest in high-quality furniture, positively affecting the Turkey Tables Market.
- Changing consumer lifestyles, which lean towards modern and functional furniture, contribute to the growing demand for stylish and versatile table solutions.
- The rich tradition of craftsmanship in Turkey ensures that tables manufactured in the region continue to appeal to consumers seeking durability and aesthetics.
- Urbanization is driving the demand for furniture in metropolitan areas, leading to increased sales of tables as households look to furnish smaller living spaces efficiently.
- Online sales channels have expanded the market reach for Turkey tables, allowing consumers to explore a broader range of products from the comfort of their homes.
Turkey Tables Market Trends and Opportunities
The Turkey Tables Market is currently witnessing several notable trends and opportunities:
- Consumers are increasingly opting for eco-friendly and sustainable materials, resulting in a rise in demand for tables crafted from recycled or reclaimed wood.
- Minimalist and versatile designs have gained popularity, allowing tables to seamlessly integrate into various interior styles.
- Multifunctional tables that can serve multiple purposes, including dining, work, and storage, are becoming essential in modern homes.
- Customization options are increasingly sought after, as consumers express a desire for unique, personalized pieces that reflect their individual style.
- The trend towards open-concept living spaces is increasing the demand for tables that can functionally and aesthetically fit into multiple areas of the home.
Turkey Tables Market Challenges and Restraints
Despite its growth potential, the Turkey Tables Market faces several significant challenges:
- The rising competition from online retailers and e-commerce platforms is a concern for traditional brick-and-mortar stores that struggle to match the convenience and variety offered online.
- Fluctuating raw material prices pose a challenge, as they can lead to increased production costs and impact pricing strategies for manufacturers.
- Keeping pace with changing consumer preferences and emerging design trends is vital for manufacturers to stay relevant within the market.
- Technological advancements in manufacturing processes demand continuous adaptation, as companies are pressured to improve efficiency while embracing sustainability.
- The need for robust marketing strategies to reach a broader audience and differentiate products in a competitive landscape remains a constant challenge.
Turkey Tables Market Investment Opportunities
Investment opportunities abound in the Turkey Tables Market, driven by shifting consumer demands:
- The rising population density in urban areas creates a fertile market for modern, stylish furniture solutions, particularly tables that cater to contemporary lifestyles.
- Innovative designs that incorporate functional features are increasingly desired by consumers, presenting opportunities for introducing new table concepts.
- E-commerce platforms represent a growing avenue for market expansion, allowing businesses to reach a wider customer base through digital marketing strategies.
- Collaborations with local designers and artisans can yield unique, high-quality table products that stand out in the market.
- The emphasis on sustainable production methods offers a competitive edge for businesses committed to environmentally friendly practices.
Turkey Tables Market Government Investment and Initiatives
Government policies surrounding the Turkey Tables Market focus on several key areas of development:
- Promoting fair competition within the market is essential to ensure a level playing field for businesses of all sizes while safeguarding consumer interests.
- Regulations pertaining to product quality standards and labeling requirements help maintain the integrity of the market and protect consumer rights.
- Initiatives aimed at boosting domestic production reduce the reliance on imports, encouraging local businesses to grow and thrive in this industry.
- Support for small and medium-sized enterprises is facilitated by government programs that offer tax incentives and subsidies for innovation in furniture production.
- Export promotion initiatives aim to enhance the global presence of Turkish-made tables, driving economic growth within the country.
Turkey Tables Market Latest Developments (May 2025 - June 2026)
Recent developments in the Turkey Tables Market have indicated a responsive shift towards sustainability and consumer-centric design. There has been an increasing focus on eco-friendly materials, with manufacturers exploring innovative alternatives that align with growing consumer preferences for sustainable living. Additionally, the rise of direct-to-consumer models through online platforms has reshaped how consumers access and purchase furniture, including tables. The market is also witnessing heightened competition as companies continue to invest in technology to enhance production efficiency and adapt to evolving design trends. Furthermore, collaborative projects between artisans and local designers have emerged as a strategy to offer unique, high-quality products that cater to the discerning tastes of consumers.
Turkey Tables Market - Key Attractiveness of the Report
- 10 Years of Market Numbers
- Historical Data Starting from 2022 to 2025
- Base Year: 2025
- Forecast Data until 2032
- Key Performance Indicators Impacting the Market
- Major Upcoming Developments and Projects
Key Highlights of the Report:
- Turkey Tables Market Outlook
- Market Size of Turkey Tables Market, 2025
- Forecast of Turkey Tables Market, 2032F
- Historical Data and Forecast of Turkey Tables Revenues & Volume for the Period 2022-2032F
- Turkey Tables Market Trend Evolution
- Turkey Tables Market Drivers and Challenges
- Turkey Tables Price Trends
- Turkey Tables Porter's Five Forces
- Turkey Tables Industry Life Cycle
- Historical Data and Forecast of Turkey Tables Market Revenues & Volume By Types for the Period 2022-2032F
- Historical Data and Forecast of Turkey Tables Market Revenues & Volume By Fabric for the Period 2022-2032F
- Historical Data and Forecast of Turkey Tables Market Revenues & Volume By Leather for the Period 2022-2032F
- Historical Data and Forecast of Turkey Tables Market Revenues & Volume By Metal for the Period 2022-2032F
- Historical Data and Forecast of Turkey Tables Market Revenues & Volume By Wooden for the Period 2022-2032F
- Historical Data and Forecast of Turkey Tables Market Revenues & Volume By Others for the Period 2022-2032F
- Historical Data and Forecast of Turkey Tables Market Revenues & Volume By Applications for the Period 2022-2032F
- Historical Data and Forecast of Turkey Tables Market Revenues & Volume By Family for the Period 2022-2032F
- Historical Data and Forecast of Turkey Tables Market Revenues & Volume By Office for the Period 2022-2032F
- Historical Data and Forecast of Turkey Tables Market Revenues & Volume By Others for the Period 2022-2032F
- Turkey Tables Import Export Trade Statistics
- Market Opportunity Assessment By Types
- Market Opportunity Assessment By Applications
- Turkey Tables Top Companies Market Share
- Turkey Tables Competitive Benchmarking By Technical and Operational Parameters
- Turkey Tables Company Profiles
- Turkey Tables Key Strategic Recommendations
Frequently Asked Questions About the Market Study (FAQs):
Growth is driven by increasing disposable income, changing lifestyles, and a rising demand for diverse and innovative furniture products.
There is a growing demand for eco-friendly materials, leading manufacturers to explore sustainable options, such as recycled or reclaimed wood, to meet consumer preferences.
Key challenges include intense competition from online retailers, fluctuating raw material prices, and the need to adapt to ever-changing consumer trends.
Opportunities include investment in e-commerce platforms, the demand for customizable furniture solutions, and collaborations with local designers for unique offerings.
6Wresearch actively monitors the Turkey Tables Market and publishes its comprehensive annual report, highlighting emerging trends, growth drivers, revenue analysis, and forecast outlook. Our insights help businesses to make data-backed strategic decisions with ongoing market dynamics. Our analysts track relevent industries related to the Turkey Tables Market, allowing our clients with actionable intelligence and reliable forecasts tailored to emerging regional needs.
Yes, we provide customisation as per your requirements. To learn more, feel free to contact us on sales@6wresearch.com
1 Executive Summary |
2 Introduction |
2.1 Key Highlights of the Report |
2.2 Report Description |
2.3 Market Scope & Segmentation |
2.4 Research Methodology |
2.5 Assumptions |
3 Turkey Tables Market Overview |
3.1 Turkey Country Macro Economic Indicators |
3.2 Turkey Tables Market Revenues & Volume, 2022 & 2032F |
3.3 Turkey Tables Market - Industry Life Cycle |
3.4 Turkey Tables Market - Porter's Five Forces |
3.5 Turkey Tables Market Revenues & Volume Share, By Types, 2022 & 2032F |
3.6 Turkey Tables Market Revenues & Volume Share, By Applications, 2022 & 2032F |
4 Turkey Tables Market Dynamics |
4.1 Impact Analysis |
4.2 Market Drivers |
4.2.1 Increasing consumer preference for home dining and entertaining |
4.2.2 Growing popularity of hosting holiday gatherings and events |
4.2.3 Rising demand for versatile and space-saving furniture solutions |
4.3 Market Restraints |
4.3.1 Fluctuations in raw material prices affecting production costs |
4.3.2 Competition from alternative dining furniture options |
4.3.3 Economic uncertainties impacting consumer spending on non-essential items |
5 Turkey Tables Market Trends |
6 Turkey Tables Market, By Types |
6.1 Turkey Tables Market, By Types |
6.1.1 Overview and Analysis |
6.1.2 Turkey Tables Market Revenues & Volume, By Types, 2022-2032F |
6.1.3 Turkey Tables Market Revenues & Volume, By Fabric, 2022-2032F |
6.1.4 Turkey Tables Market Revenues & Volume, By Leather, 2022-2032F |
6.1.5 Turkey Tables Market Revenues & Volume, By Metal, 2022-2032F |
6.1.6 Turkey Tables Market Revenues & Volume, By Wooden, 2022-2032F |
6.1.7 Turkey Tables Market Revenues & Volume, By Others, 2022-2032F |
6.2 Turkey Tables Market, By Applications |
6.2.1 Overview and Analysis |
6.2.2 Turkey Tables Market Revenues & Volume, By Family, 2022-2032F |
6.2.3 Turkey Tables Market Revenues & Volume, By Office, 2022-2032F |
6.2.4 Turkey Tables Market Revenues & Volume, By Others, 2022-2032F |
7 Turkey Tables Market Import-Export Trade Statistics |
7.1 Turkey Tables Market Export to Major Countries |
7.2 Turkey Tables Market Imports from Major Countries |
8 Turkey Tables Market Key Performance Indicators |
8.1 Average order value for turkey tables |
8.2 Customer satisfaction and retention rates |
8.3 Number of new product launches and innovations |
8.4 Online engagement metrics (website traffic, social media engagement) |
9 Turkey Tables Market - Opportunity Assessment |
9.1 Turkey Tables Market Opportunity Assessment, By Types, 2022 & 2032F |
9.2 Turkey Tables Market Opportunity Assessment, By Applications, 2022 & 2032F |
10 Turkey Tables Market - Competitive Landscape |
10.1 Turkey Tables Market Revenue Share, By Companies, 2025 |
10.2 Turkey Tables Market Competitive Benchmarking, By Operating and Technical Parameters |
11 Company Profiles |
12 Recommendations |
13 Disclaimer |
Global Go To Market Strategy - 2030
Export potential enables firms to identify high-growth global markets with greater confidence by combining advanced trade intelligence with a structured quantitative methodology. The framework analyzes emerging demand trends and country-level import patterns while integrating macroeconomic and trade datasets such as GDP and population forecasts, bilateral import–export flows, tariff structures, elasticity differentials between developed and developing economies, geographic distance, and import demand projections. Using weighted trade values from 2020–2024 as the base period to project country-to-country export potential for 2030, these inputs are operationalized through calculated drivers such as gravity model parameters, tariff impact factors, and projected GDP per-capita growth. Through an analysis of hidden potentials, demand hotspots, and market conditions that are most favorable to success, this method enables firms to focus on target countries, maximize returns, and global expansion with data, backed by accuracy.
By factoring in the projected importer demand gap that is currently unmet and could be potential opportunity, it identifies the potential for the Exporter (Country) among 190 countries, against the general trade analysis, which identifies the biggest importer or exporter.
To discover high-growth global markets and optimize your business strategy:
Click Here
Pricing
- Single User License$ 1,995
- Department License$ 2,400
- Site License$ 3,120
- Global License$ 3,795

Leadership Perspectives from Industry Events
Search
Thought Leadership and Analyst Meet


Our Clients
6WResearch In News
- India Air Conditioner Market Set for Strong Rebound in 2026 After Weather-Led Correction and GST-Driven Recovery: 6Wresearch
- ADAS in India: How Automatic Emergency Braking, Blind Spot Detection & Driver Monitoring are Transforming Road Safety
- Doha a strategic location for EV manufacturing hub: IPA Qatar
- Demand for luxury TVs surging in the GCC, says Samsung
- Empowering Growth: The Thriving Journey of Bangladesh’s Cable Industry
- Demand for luxury TVs surging in the GCC, says Samsung
Latest Reports
- Nicaragua RPG Gaming Market (2026-2032)
- New Zealand RPG Gaming Market (2026-2032)
- Netherlands RPG Gaming Market (2026-2032)
- Nauru RPG Gaming Market (2026-2032)
- Namibia RPG Gaming Market (2026-2032)
- Mozambique RPG Gaming Market (2026-2032)
- Montenegro RPG Gaming Market (2026-2032)
- Mongolia RPG Gaming Market (2026-2032)
- Monaco RPG Gaming Market (2026-2032)
- Micronesia RPG Gaming Market (2026-2032)
Industry Events and Analyst Meet

HIMTEX 2026

India Refining Summit 2026

India EV Show 2026

EV tech India Expo 2026

Auto Tech Asia 2026
Whitepaper
- Middle East & Africa Commercial Security Market Click here to view more.
- Middle East & Africa Fire Safety Systems & Equipment Market Click here to view more.
- GCC Drone Market Click here to view more.
- Middle East Lighting Fixture Market Click here to view more.
- GCC Physical & Perimeter Security Market Click here to view more.