Ukraine Potassium permanganate Market (2026-2032) Outlook | Analysis, Revenue, Value, Industry, Trends, Companies, Growth, Size, Forecast & Share
Market Forecast By Grade (Free Flowing Grade, Technical Grade, Pharmaceutical Grade), By Application (Water Treatment, Waste Water Treatment, Chemicals Manufacturing, Aquaculture, Metal Processing, Air and Gas Purification, Others) And Competitive Landscape
| Product Code: ETC091176 | Publication Date: Jun 2021 | Updated Date: Jun 2026 | Product Type: Report | |
| Publisher: 6Wresearch | Author: Sachin Kumar Rai | No. of Pages: 70 | No. of Figures: 35 | No. of Tables: 5 |
Ukraine Potassium permanganate Market Size, Share & Growth Rate
The Ukraine Potassium permanganate Market was estimated at USD 416 Million in 2025 and is projected to reach USD 594 Million by 2032, growing at a CAGR of 5.2% from 2026 to 2032. This growth is primarily driven by the increasing need for effective water treatment solutions amid rising awareness regarding sanitation. Additionally, the agricultural sector's dependency on potassium permanganate for crop protection underscores its pivotal role in enhancing yield and managing diseases.
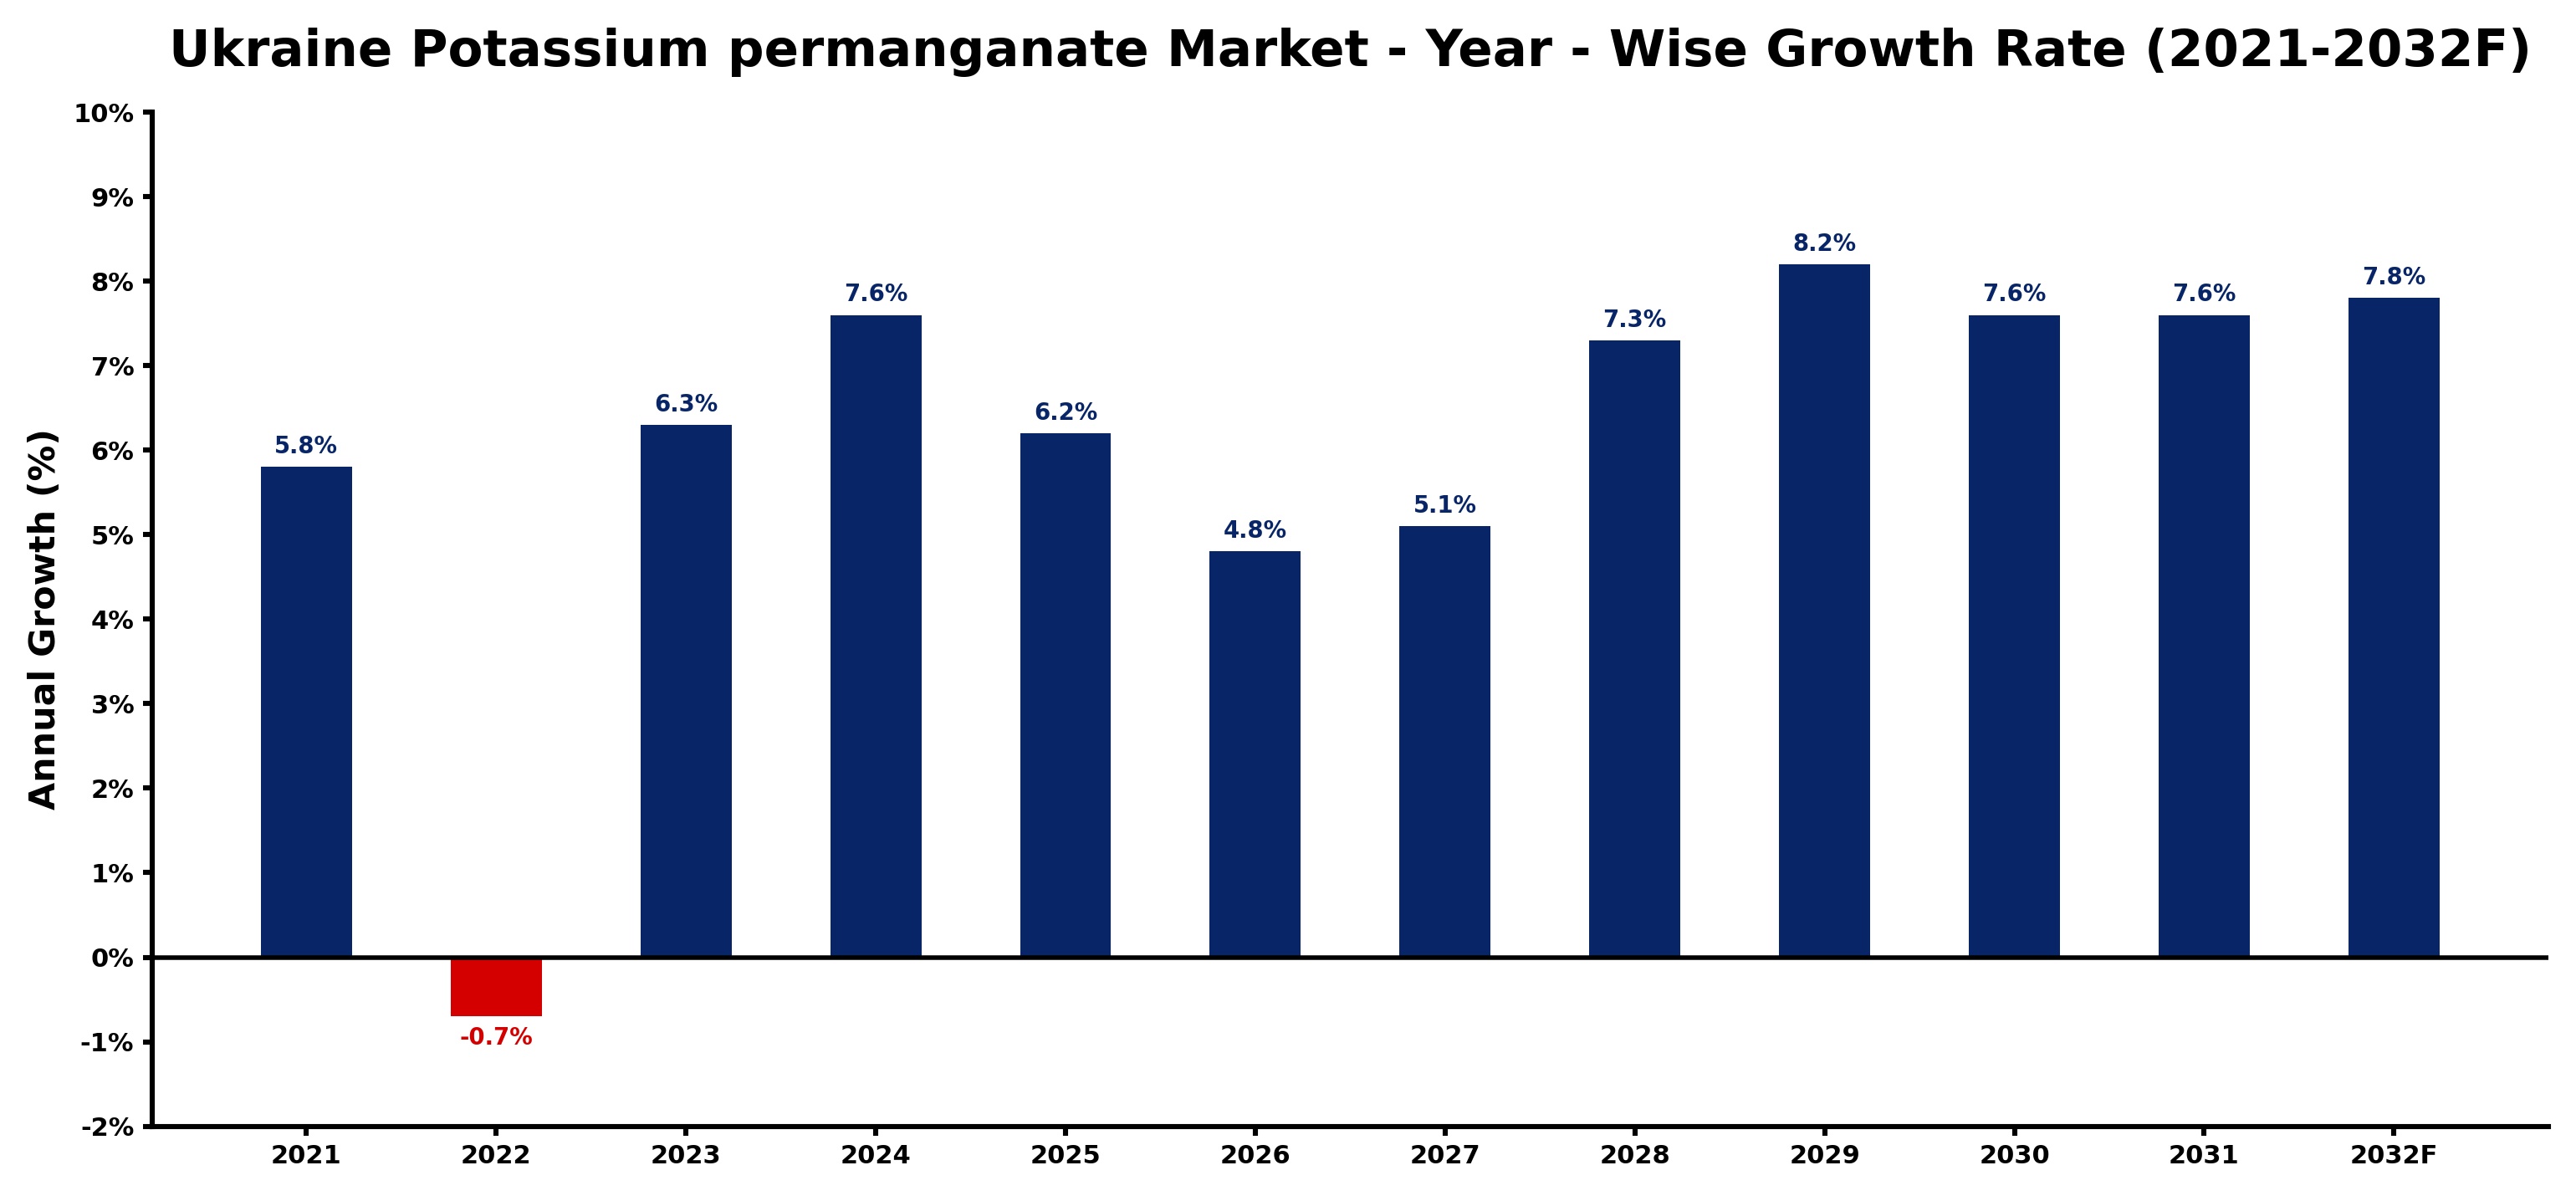
Ukraine Potassium permanganate Market Growth Rate Analysis (2021-2032)
The Ukraine Potassium Permanganate market exhibits a resilient growth trajectory, recovering from a slight decline of 0.7% in 2022 to achieve an impressive 6.3% increase in 2023. This rebound is largely driven by heightened consumer demand for water treatment solutions and a burgeoning agricultural sector. Forecasts suggest further robust expansion, with growth rates projected at 7.6% in 2024 and maintaining a steady pace above 6% through 2026. Factors such as technological advancements in production and a supportive policy environment aimed at enhancing chemical manufacturing capabilities will bolster this upward momentum. The anticipated 8.2% growth in 2029 is a testament to strengthening industrial applications and investments in sustainable technologies.
Ukraine Potassium permanganate Market Year-wise Growth Rate and Key Drivers
This graph highlights how the Ukraine Potassium permanganate Market has steadily grown over the past five years, supported by major growth factors.
The table below presents the year‑wise growth rates along with the key drivers influencing the market
| Year | Growth Rate | Major Drivers |
| 2021 | 5.8% | Infrastructure upgrades boost potassium permanganate manufacturing capacity utilization |
| 2022 | -0.7% | Decreased agricultural output led to reduced potassium permanganate demand |
| 2023 | 6.3% | Investment in potassium permanganate production capacity drives local manufacturing growth |
| 2024 | 7.6% | New production facilities enhance potassium permanganate export capacity |
| 2025 | 6.2% | Local manufacturers invest in advanced production technologies for efficiency |
| 2026 | 4.8% | New production facilities boost local potassium permanganate supply capacity |
| 2027 | 5.1% | Advanced processing technologies boost local potassium permanganate output |
| 2028 | 7.3% | Improved raw material sourcing boosted potassium permanganate production capacity |
| 2029 | 8.2% | Export driven manufacturing investments boost potassium permanganate production capacity |
| 2030 | 7.6% | Investment in advanced processing facilities boosts potassium permanganate production |
| 2031 | 7.6% | New manufacturing plants boost local potassium permanganate supply capabilities |
| 2032 | 7.8% | Resurgent agricultural exports boost potassium permanganate production requirements |
Note - Market size estimations and growth projections presented in this report are based on 6Wresearch’s advanced forecasting approach, validated with industry datasets as of June 2026.
Ukraine Potassium permanganate Market Synopsis
Currently, the most significant force shaping the Ukraine Potassium permanganate Market is the growing emphasis on water quality and sanitation. As more stakeholders recognize the critical role of potassium permanganate as a disinfectant, its application in water treatment processes has intensified, leading to robust market demand.
Moreover, the healthcare sector's need for reliable disinfectants is steadily increasing. The diverse applications of potassium permanganate in both medical and industrial contexts highlight the chemical's importance, suggesting a promising trajectory for market growth in the near future.
Ukraine Potassium permanganate Market Key Takeaways
- The market is witnessing increasing demand from agriculture, healthcare, and water treatment sectors.
- Innovative product development is a significant focus among market players to cater to diverse applications.
- Sustainability trends are prompting a shift towards eco-friendly potassium permanganate solutions.
- Pricing volatility and reliance on imports present strategic challenges for market participants.
- Regulatory policies are evolving to enhance safety standards and promote domestic production.
Evaluation of Restraints in Ukraine Potassium permanganate Market
While the market shows promising growth potential, it is not without its challenges. A key restraint is the pricing volatility stemming from global supply and demand fluctuations. This unpredictability can impact profit margins for manufacturers and distributors alike. Additionally, competition from alternative chemical disinfectants may divert attention from potassium permanganate, posing a further challenge. The reliance on imported raw materials also subjects the market to currency exchange fluctuations and potential trade disruptions, necessitating strategic planning among stakeholders.
Ukraine Potassium permanganate Market Trends
The Ukraine Potassium permanganate Market is experiencing several notable trends. Firstly, there is a clear shift towards sustainable and eco-friendly products, driven by rising environmental concerns. As consumers and businesses alike seek greener alternatives, the demand for potassium permanganate that meets these criteria is on the rise. Secondly, technological advancements in production processes are enabling manufacturers to increase efficiency while maintaining product quality, which can further drive adoption across various industries.
Ukraine Potassium permanganate Market Opportunities
Significant growth and investment opportunities are emerging in the Ukraine Potassium permanganate Market. Investors can capitalize on the expanding applications of this versatile chemical, particularly within the agriculture and healthcare sectors. With the growing recognition of its disinfection and oxidation properties, new opportunities for research and development into innovative uses are also on the horizon. Additionally, local manufacturing initiatives can help reduce reliance on imports, presenting a favorable avenue for investment.
Government Initiatives in the Ukraine Potassium permanganate Market
Government policies are playing a crucial role in shaping the Ukraine Potassium permanganate Market. Regulatory frameworks are in place to ensure the safe production and use of potassium permanganate, including stringent quality control measures. Furthermore, the government may provide subsidies to encourage domestic production, which can help mitigate import dependency. These initiatives aim to protect consumer interests while promoting sustainable growth within the industry.
Future Insights of the Ukraine Potassium permanganate Market
Looking ahead to the period from 2026 to 2032, the future of the Ukraine Potassium permanganate Market appears promising. With increasing awareness of its critical applications in water treatment and agriculture, sustained demand is expected. The healthcare sector's ongoing expansion will also contribute to this trend, as the need for reliable disinfectants continues to rise. Furthermore, continuous investment in technological advancements and research and development will likely enhance product offerings and expand market opportunities.
Ukraine Potassium permanganate Market Latest Developments (May 2025 - June 2026)
Recent developments in the Ukraine Potassium permanganate Market indicate a growing focus on sustainability and innovation. Companies are increasingly prioritizing eco-friendly production methods to align with global environmental goals. Additionally, advancements in application techniques are making potassium permanganate more effective for various uses, including enhanced agricultural practices. As the market evolves, these developments are shaping a more dynamic and competitive landscape.
Ukraine Potassium permanganate Market - Key Attractiveness of the Report
- 10 Years of Market Numbers
- Historical Data Starting from 2022 to 2025
- Base Year: 2025
- Forecast Data until 2032
- Key Performance Indicators Impacting the Market
- Major Upcoming Developments and Projects
Key Highlights of the Report:
- Ukraine Potassium permanganate Market Outlook
- Market Size of Ukraine Potassium permanganate Market, 2025
- Forecast of Ukraine Potassium permanganate Market, 2032
- Historical Data and Forecast of Ukraine Potassium permanganate Revenues & Volume for the Period 2022-2032F
- Ukraine Potassium permanganate Market Trend Evolution
- Ukraine Potassium permanganate Market Drivers and Challenges
- Ukraine Potassium permanganate Price Trends
- Ukraine Potassium permanganate Porter's Five Forces
- Ukraine Potassium permanganate Industry Life Cycle
- Historical Data and Forecast of Ukraine Potassium permanganate Market Revenues & Volume By Grade for the Period 2022-2032F
- Historical Data and Forecast of Ukraine Potassium permanganate Market Revenues & Volume By Free Flowing Grade for the Period 2022-2032F
- Historical Data and Forecast of Ukraine Potassium permanganate Market Revenues & Volume By Technical Grade for the Period 2022-2032F
- Historical Data and Forecast of Ukraine Potassium permanganate Market Revenues & Volume By Pharmaceutical Grade for the Period 2022-2032F
- Historical Data and Forecast of Ukraine Potassium permanganate Market Revenues & Volume By Application for the Period 2022-2032F
- Historical Data and Forecast of Ukraine Potassium permanganate Market Revenues & Volume By Water Treatment for the Period 2022-2032F
- Historical Data and Forecast of Ukraine Potassium permanganate Market Revenues & Volume By Waste Water Treatment for the Period 2022-2032F
- Historical Data and Forecast of Ukraine Potassium permanganate Market Revenues & Volume By Chemicals Manufacturing for the Period 2022-2032F
- Historical Data and Forecast of Ukraine Potassium permanganate Market Revenues & Volume By Aquaculture for the Period 2022-2032F
- Historical Data and Forecast of Ukraine Potassium permanganate Market Revenues & Volume By Metal Processing for the Period 2022-2032F
- Historical Data and Forecast of Ukraine Potassium permanganate Market Revenues & Volume By Air and Gas Purification for the Period 2022-2032F
- Historical Data and Forecast of Ukraine Potassium permanganate Market Revenues & Volume By Others for the Period 2022-2032F
- Ukraine Potassium permanganate Import Export Trade Statistics
- Market Opportunity Assessment By Grade
- Market Opportunity Assessment By Application
- Ukraine Potassium permanganate Top Companies Market Share
- Ukraine Potassium permanganate Competitive Benchmarking By Technical and Operational Parameters
- Ukraine Potassium permanganate Company Profiles
- Ukraine Potassium permanganate Key Strategic Recommendations
Ukraine Potassium permanganate Market - Frequently Asked Questions
The primary drivers include heightened awareness of water treatment needs, increased agricultural activity, and expanding applications in healthcare and sanitation.
The Ukraine Potassium permanganate Market was estimated at USD 416 Million in 2025 and is projected to reach USD 594 Million by 2032, growing at a CAGR of 5.2% from 2026 to 2032.
Key trends include a shift towards eco-friendly products and advancements in production technology, enhancing both efficiency and sustainability.
It is primarily utilized in agriculture for crop protection, in healthcare for disinfection, and in water treatment processes for purification and sanitation.
Government policies establish stringent quality controls and can provide incentives for local production, thereby shaping the competitive landscape and ensuring consumer safety.
6Wresearch actively monitors the Ukraine Potassium permanganate Market and publishes its comprehensive annual report, highlighting emerging trends, growth drivers, revenue analysis, and forecast outlook. Our insights help businesses to make data-backed strategic decisions with ongoing market dynamics. Our analysts track relevent industries related to the Ukraine Potassium permanganate Market, allowing our clients with actionable intelligence and reliable forecasts tailored to emerging regional needs.
Yes, we provide customisation as per your requirements. To learn more, feel free to contact us on sales@6wresearch.com
1 Executive Summary |
2 Introduction |
2.1 Key Highlights of the Report |
2.2 Report Description |
2.3 Market Scope & Segmentation |
2.4 Research Methodology |
2.5 Assumptions |
3 Ukraine Potassium permanganate Market Overview |
3.1 Ukraine Country Macro Economic Indicators |
3.2 Ukraine Potassium permanganate Market Revenues & Volume, 2022 & 2032F |
3.3 Ukraine Potassium permanganate Market - Industry Life Cycle |
3.4 Ukraine Potassium permanganate Market - Porter's Five Forces |
3.5 Ukraine Potassium permanganate Market Revenues & Volume Share, By Grade, 2022 & 2032F |
3.6 Ukraine Potassium permanganate Market Revenues & Volume Share, By Form, 2022 & 2032F |
4 Ukraine Potassium permanganate Market Dynamics |
4.1 Impact Analysis |
4.2 Market Drivers |
4.3 Market Restraints |
5 Ukraine Potassium permanganate Market Trends |
6 Ukraine Potassium permanganate Market, By Types |
6.1 Ukraine Potassium permanganate Market, By Grade |
6.1.1 Overview and Analysis |
6.1.2 Ukraine Potassium permanganate Market Revenues & Volume, By Grade, 2022-2032F |
6.1.3 Ukraine Potassium permanganate Market Revenues & Volume, By Free Flowing Grade, 2022-2032F |
6.1.4 Ukraine Potassium permanganate Market Revenues & Volume, By Technical Grade, 2022-2032F |
6.1.5 Ukraine Potassium permanganate Market Revenues & Volume, By Pharmaceutical Grade, 2022-2032F |
6.2 Ukraine Potassium permanganate Market, By Application |
6.2.1 Overview and Analysis |
6.2.2 Ukraine Potassium permanganate Market Revenues & Volume, By Water Treatment, 2022-2032F |
6.2.3 Ukraine Potassium permanganate Market Revenues & Volume, By Waste Water Treatment, 2022-2032F |
6.2.4 Ukraine Potassium permanganate Market Revenues & Volume, By Chemicals Manufacturing, 2022-2032F |
6.2.5 Ukraine Potassium permanganate Market Revenues & Volume, By Aquaculture, 2022-2032F |
6.2.6 Ukraine Potassium permanganate Market Revenues & Volume, By Metal Processing, 2022-2032F |
6.2.7 Ukraine Potassium permanganate Market Revenues & Volume, By Air and Gas Purification, 2022-2032F |
7 Ukraine Potassium permanganate Market Import-Export Trade Statistics |
7.1 Ukraine Potassium permanganate Market Export to Major Countries |
7.2 Ukraine Potassium permanganate Market Imports from Major Countries |
8 Ukraine Potassium permanganate Market Key Performance Indicators |
9 Ukraine Potassium permanganate Market - Opportunity Assessment |
9.1 Ukraine Potassium permanganate Market Opportunity Assessment, By Grade, 2022 & 2032F |
9.2 Ukraine Potassium permanganate Market Opportunity Assessment, By Application, 2022 & 2032F |
10 Ukraine Potassium permanganate Market - Competitive Landscape |
10.1 Ukraine Potassium permanganate Market Revenue Share, By Companies, 2025 |
10.2 Ukraine Potassium permanganate Market Competitive Benchmarking, By Operating and Technical Parameters |
11 Company Profiles |
12 Recommendations |
13 Disclaimer |
Global Go To Market Strategy - 2030
Export potential enables firms to identify high-growth global markets with greater confidence by combining advanced trade intelligence with a structured quantitative methodology. The framework analyzes emerging demand trends and country-level import patterns while integrating macroeconomic and trade datasets such as GDP and population forecasts, bilateral import–export flows, tariff structures, elasticity differentials between developed and developing economies, geographic distance, and import demand projections. Using weighted trade values from 2020–2024 as the base period to project country-to-country export potential for 2030, these inputs are operationalized through calculated drivers such as gravity model parameters, tariff impact factors, and projected GDP per-capita growth. Through an analysis of hidden potentials, demand hotspots, and market conditions that are most favorable to success, this method enables firms to focus on target countries, maximize returns, and global expansion with data, backed by accuracy.
By factoring in the projected importer demand gap that is currently unmet and could be potential opportunity, it identifies the potential for the Exporter (Country) among 190 countries, against the general trade analysis, which identifies the biggest importer or exporter.
To discover high-growth global markets and optimize your business strategy:
Click Here
Pricing
- Single User License$ 1,995
- Department License$ 2,400
- Site License$ 3,120
- Global License$ 3,795

Leadership Perspectives from Industry Events
Search
Thought Leadership and Analyst Meet


Our Clients
6WResearch In News
- India Air Conditioner Market Set for Strong Rebound in 2026 After Weather-Led Correction and GST-Driven Recovery: 6Wresearch
- ADAS in India: How Automatic Emergency Braking, Blind Spot Detection & Driver Monitoring are Transforming Road Safety
- Doha a strategic location for EV manufacturing hub: IPA Qatar
- Demand for luxury TVs surging in the GCC, says Samsung
- Empowering Growth: The Thriving Journey of Bangladesh’s Cable Industry
- Demand for luxury TVs surging in the GCC, says Samsung
Latest Reports
- Nicaragua RPG Gaming Market (2026-2032)
- New Zealand RPG Gaming Market (2026-2032)
- Netherlands RPG Gaming Market (2026-2032)
- Nauru RPG Gaming Market (2026-2032)
- Namibia RPG Gaming Market (2026-2032)
- Mozambique RPG Gaming Market (2026-2032)
- Montenegro RPG Gaming Market (2026-2032)
- Mongolia RPG Gaming Market (2026-2032)
- Monaco RPG Gaming Market (2026-2032)
- Micronesia RPG Gaming Market (2026-2032)
Industry Events and Analyst Meet

HIMTEX 2026

India Refining Summit 2026

India EV Show 2026

EV tech India Expo 2026

Auto Tech Asia 2026
Whitepaper
- Middle East & Africa Commercial Security Market Click here to view more.
- Middle East & Africa Fire Safety Systems & Equipment Market Click here to view more.
- GCC Drone Market Click here to view more.
- Middle East Lighting Fixture Market Click here to view more.
- GCC Physical & Perimeter Security Market Click here to view more.