United Arab Emirates (UAE) Chemical Packaging Market (2026-2032) | Companies, Forecast, Growth, Size, Industry, COVID-19 IMPACT, Outlook, Share, Analysis, Trends, Value & Revenue
Market Forecast By Product Types (Sacks, Drums, FIBC, Other), By Applications (Pharmaceutical Factory , Laboratory, Chemical Plant , Others) And Competitive Landscape
| Product Code: ETC006900 | Publication Date: Jun 2023 | Updated Date: Jun 2026 | Product Type: Report | |
| Publisher: 6Wresearch | Author: Ravi Bhandari | No. of Pages: 70 | No. of Figures: 35 | No. of Tables: 5 |
United Arab Emirates (UAE) Chemical Packaging Market Summary
The united arab emirates (uae) chemical packaging market was estimated at USD 318 Million in 2025 and is projected to reach USD 439 Million by 2032, growing at a CAGR of 5.8% from 2026 to 2032.
United Arab Emirates (UAE) Chemical Packaging Market Year-wise Growth Rate and Key Drivers
This graph highlights how the United Arab Emirates (UAE) Chemical Packaging Market has steadily grown over the past five years, supported by major growth factors.
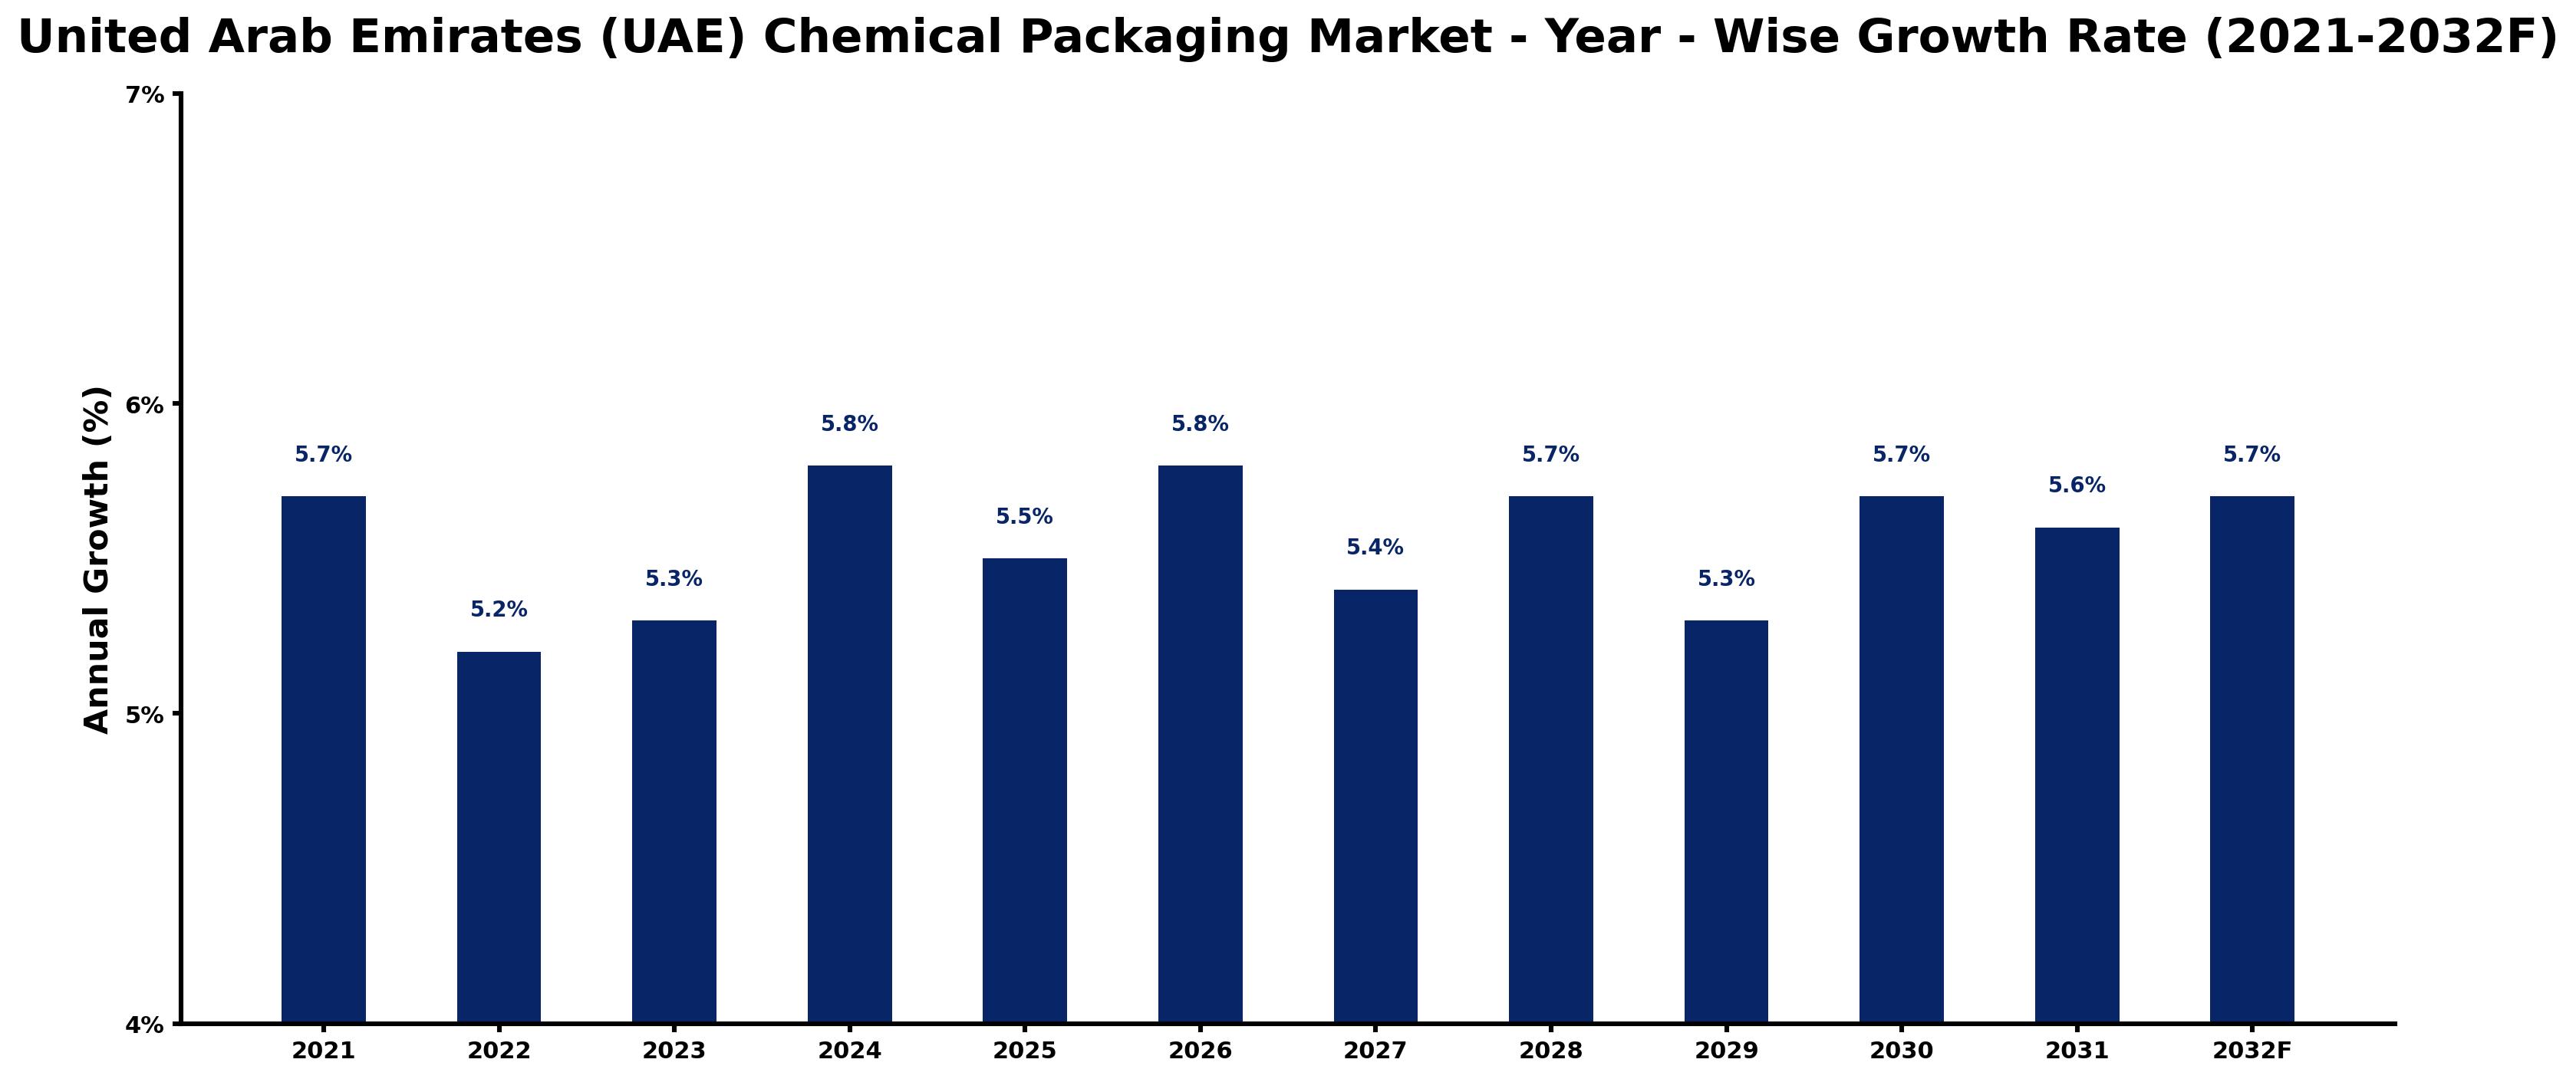
The table below presents the year wise growth rates along with the key drivers influencing the market
| Year | Growth Rate | Major Drivers |
| 2021 | 5.7% | The chemical sector's robust expansion in UAE boosts packaging market demand significantly. |
| 2022 | 5.2% | Increased focus on sustainability encourages the adoption of eco-friendly packaging solutions. |
| 2023 | 5.3% | Investment in infrastructure and logistics enhances distribution capabilities for chemical products. |
| 2024 | 5.8% | Technological innovations streamline packaging processes, improving efficiency and reducing costs. |
| 2025 | 5.5% | A surge in domestic manufacturing reduces reliance on imported chemical products. |
| 2026 | 5.8% | Regional trade agreements enhance market access for chemical packaging suppliers. |
| 2027 | 5.4% | The construction boom in UAE creates higher packaging requirements for industrial chemicals. |
| 2028 | 5.7% | Emphasis on product safety drives the development of advanced packaging materials. |
| 2029 | 5.3% | The hospitality sector's expansion necessitates innovative packaging for cleaning chemicals. |
| 2030 | 5.7% | Consumer awareness encourages brands to pursue sustainable, recyclable packaging options. |
| 2031 | 5.6% | Integration of automation technology transforms production lines, increasing packaging efficiency. |
| 2032 | 5.7% | Growing export activities demand compliance with international packaging standards. |
Note - Market size estimations and growth projections presented in this report are based on 6Wresearch's advanced forecasting approach, validated with industry datasets as of June 2026.
United Arab Emirates (UAE) Chemical Packaging Market Synopsis
The United Arab Emirates (UAE) Chemical Packaging Market is projected to reach 5.8% and witness significant growth during the forecast period (2026-2032). The market, valued at USD 8,439.5 million in 2020, is driven by an increasing demand for packaged chemicals, particularly from the food and beverage sector. Rising consumer awareness regarding safety and convenience further contributes to the expansion of this market. Additionally, the implementation of stringent government regulations concerning the safe handling and transportation of packaged chemicals is likely to enhance market growth. Despite these positive factors, challenges such as the prevalence of counterfeit products and high costs associated with primary packaging materials may restrain market growth during the forecast period.
United Arab Emirates (UAE) Chemical Packaging Market Growth Drivers
The growth of the United Arab Emirates (UAE) Chemical Packaging Market can be attributed to several key drivers:
- The food and beverage industry is a major consumer of chemical packaging, driving demand for safe and reliable packaging solutions.
- Increased focus on consumer safety has led to higher demand for packaging that ensures the integrity and safety of chemicals.
- Technological advancements in packaging materials and manufacturing processes have resulted in improved product offerings and enhanced performance.
- The UAE's rapidly evolving industrial landscape necessitates efficient packaging solutions for various applications, further propelling market growth.
- The introduction of stringent regulations by government authorities aims to ensure safe transportation and storage of packaged chemicals, which fosters market development.
United Arab Emirates (UAE) Chemical Packaging Market Trends and Opportunities
The United Arab Emirates (UAE) Chemical Packaging Market is witnessing notable trends that present significant opportunities for growth:
- An increasing preference for flexible packaging solutions due to their lightweight and versatile nature is becoming prevalent across diverse industries.
- The rising trend in environmentally friendly packaging materials can lead to innovations and new product offerings aimed at sustainability.
- Digital printing technologies are gaining traction in the packaging industry, allowing for customization and enhanced branding opportunities.
- As e-commerce continues to expand, the demand for innovative packaging solutions that cater to online deliveries is escalating.
- The growing awareness of health and safety regulations among consumers is driving demand for packaging that complies with these standards.
United Arab Emirates (UAE) Chemical Packaging Market Challenges and Restraints
While the United Arab Emirates (UAE) Chemical Packaging Market is poised for growth, it faces several challenges:
- The presence of counterfeit chemical packaging products poses a significant risk, threatening both consumer safety and brand integrity.
- High costs related to raw materials for primary packaging can limit market expansion and hinder the affordability of some products.
- Fluctuations in global oil prices can impact the cost of plastic, a key component of chemical packaging materials.
- Bureaucratic challenges and compliance with stringent regulations can slow down the entry of new players into the market.
- Potential shifts in consumer preferences towards alternative packaging solutions may affect the demand for traditional chemical packaging products.
United Arab Emirates (UAE) Chemical Packaging Market Government Investment and Initiatives
The United Arab Emirates (UAE) government has recognized the significance of the chemical packaging sector and has undertaken various initiatives to bolster its development:
- Policies promoting sustainability are increasingly influencing investment in eco-friendly packaging technologies, aiming to minimize environmental impact.
- Government funding and incentives are directed towards research and development initiatives focused on innovative packaging solutions.
- Strategic partnerships between public and private sectors are encouraged to enhance infrastructure supporting safe and efficient chemical packaging.
- Regulatory frameworks are being refined to facilitate compliance while encouraging investment in modern packaging technologies.
- National development plans emphasize the importance of the chemical sector, aiming to establish the UAE as a regional hub for chemical manufacturing and packaging.
United Arab Emirates (UAE) Chemical Packaging Market Latest Developments (May 2025 - June 2026)
Recent developments in the United Arab Emirates (UAE) Chemical Packaging Market emphasize innovation and sustainability. A shift towards biodegradable and recyclable packaging materials has been observed, reflecting a growing commitment to environmental stewardship. Industry stakeholders are increasingly investing in smart packaging technologies that incorporate QR codes and sensors for improved traceability and consumer engagement. Collaborative initiatives between manufacturers and technology firms are expected to yield advancements in packaging design and functionality. Additionally, the ongoing adaptation to regulatory changes is prompting companies to enhance their compliance protocols, ensuring that safety and quality standards are met more effectively. As consumer demand continues to evolve, the market is likely to experience further transformations driven by shifting preferences and technological advancements.
United Arab Emirates (UAE) Chemical Packaging Market - Key Attractiveness of the Report
- 10 Years of Market Numbers
- Historical Data Starting from 2022 to 2025
- Base Year: 2025
- Forecast Data until 2032
- Key Performance Indicators Impacting the Market
- Major Upcoming Developments and Projects
Key Highlights of the Report:
- United Arab Emirates (UAE) Chemical Packaging Market Outlook
- Market Size of United Arab Emirates (UAE) Chemical Packaging Market, 2025
- Forecast of United Arab Emirates (UAE) Chemical Packaging Market, 2032F
- Historical Data and Forecast of United Arab Emirates (UAE) Chemical Packaging Revenues & Volume for the Period 2022-2032F
- United Arab Emirates (UAE) Chemical Packaging Market Trend Evolution
- United Arab Emirates (UAE) Chemical Packaging Market Drivers and Challenges
- United Arab Emirates (UAE) Chemical Packaging Price Trends
- United Arab Emirates (UAE) Chemical Packaging Porter's Five Forces
- United Arab Emirates (UAE) Chemical Packaging Industry Life Cycle
- Historical Data and Forecast of United Arab Emirates (UAE) Chemical Packaging Market Revenues & Volume By Product Types for the Period 2022-2032F
- Historical Data and Forecast of United Arab Emirates (UAE) Chemical Packaging Market Revenues & Volume By Sacks for the Period 2022-2032F
- Historical Data and Forecast of United Arab Emirates (UAE) Chemical Packaging Market Revenues & Volume By Drums for the Period 2022-2032F
- Historical Data and Forecast of United Arab Emirates (UAE) Chemical Packaging Market Revenues & Volume By FIBC for the Period 2022-2032F
- Historical Data and Forecast of United Arab Emirates (UAE) Chemical Packaging Market Revenues & Volume By Other for the Period 2022-2032F
- Historical Data and Forecast of United Arab Emirates (UAE) Chemical Packaging Market Revenues & Volume By Applications for the Period 2022-2032F
- Historical Data and Forecast of United Arab Emirates (UAE) Chemical Packaging Market Revenues & Volume By Pharmaceutical Factory? for the Period 2022-2032F
- Historical Data and Forecast of United Arab Emirates (UAE) Chemical Packaging Market Revenues & Volume By Laboratory for the Period 2022-2032F
- Historical Data and Forecast of United Arab Emirates (UAE) Chemical Packaging Market Revenues & Volume By Chemical Plant? for the Period 2022-2032F
- Historical Data and Forecast of United Arab Emirates (UAE) Chemical Packaging Market Revenues & Volume By Others for the Period 2022-2032F
- United Arab Emirates (UAE) Chemical Packaging Import Export Trade Statistics
- Market Opportunity Assessment By Product Types
- Market Opportunity Assessment By Applications
- United Arab Emirates (UAE) Chemical Packaging Top Companies Market Share
- United Arab Emirates (UAE) Chemical Packaging Competitive Benchmarking By Technical and Operational Parameters
- United Arab Emirates (UAE) Chemical Packaging Company Profiles
- United Arab Emirates (UAE) Chemical Packaging Key Strategic Recommendations
Frequently Asked Questions About the Market Study (FAQs):
The growth is primarily driven by the increasing demand for packaged chemicals, particularly in the food and beverage industry, and the rising consumer awareness regarding safety.
The market faces challenges like counterfeit products, high packaging material costs, and compliance with stringent regulations.
The government is promoting sustainability initiatives, investing in R&D, and encouraging public-private partnerships aimed at enhancing packaging technologies and infrastructure.
Emerging trends include a shift towards biodegradable packaging, investment in smart packaging technologies, and a focus on sustainability among consumers.
6Wresearch actively monitors the United Arab Emirates (UAE) Chemical Packaging Market and publishes its comprehensive annual report, highlighting emerging trends, growth drivers, revenue analysis, and forecast outlook. Our insights help businesses to make data-backed strategic decisions with ongoing market dynamics. Our analysts track relevent industries related to the United Arab Emirates (UAE) Chemical Packaging Market, allowing our clients with actionable intelligence and reliable forecasts tailored to emerging regional needs.
Yes, we provide customisation as per your requirements. To learn more, feel free to contact us on sales@6wresearch.com
1 Executive Summary |
2 Introduction |
2.1 Key Highlights of the Report |
2.2 Report Description |
2.3 Market Scope & Segmentation |
2.4 Research Methodology |
2.5 Assumptions |
3 United Arab Emirates (UAE) Chemical Packaging Market Overview |
3.1 United Arab Emirates (UAE) Country Macro Economic Indicators |
3.2 United Arab Emirates (UAE) Chemical Packaging Market Revenues & Volume, 2022 & 2032F |
3.3 United Arab Emirates (UAE) Chemical Packaging Market - Industry Life Cycle |
3.4 United Arab Emirates (UAE) Chemical Packaging Market - Porter's Five Forces |
3.5 United Arab Emirates (UAE) Chemical Packaging Market Revenues & Volume Share, By Product Types, 2022 & 2032F |
3.6 United Arab Emirates (UAE) Chemical Packaging Market Revenues & Volume Share, By Applications, 2022 & 2032F |
4 United Arab Emirates (UAE) Chemical Packaging Market Dynamics |
4.1 Impact Analysis |
4.2 Market Drivers |
4.3 Market Restraints |
5 United Arab Emirates (UAE) Chemical Packaging Market Trends |
6 United Arab Emirates (UAE) Chemical Packaging Market, By Types |
6.1 United Arab Emirates (UAE) Chemical Packaging Market, By Product Types |
6.1.1 Overview and Analysis |
6.1.2 United Arab Emirates (UAE) Chemical Packaging Market Revenues & Volume, By Product Types, 2022-2032F |
6.1.3 United Arab Emirates (UAE) Chemical Packaging Market Revenues & Volume, By Sacks, 2022-2032F |
6.1.4 United Arab Emirates (UAE) Chemical Packaging Market Revenues & Volume, By Drums, 2022-2032F |
6.1.5 United Arab Emirates (UAE) Chemical Packaging Market Revenues & Volume, By FIBC, 2022-2032F |
6.1.6 United Arab Emirates (UAE) Chemical Packaging Market Revenues & Volume, By Other, 2022-2032F |
6.2 United Arab Emirates (UAE) Chemical Packaging Market, By Applications |
6.2.1 Overview and Analysis |
6.2.2 United Arab Emirates (UAE) Chemical Packaging Market Revenues & Volume, By Pharmaceutical Factory , 2022-2032F |
6.2.3 United Arab Emirates (UAE) Chemical Packaging Market Revenues & Volume, By Laboratory, 2022-2032F |
6.2.4 United Arab Emirates (UAE) Chemical Packaging Market Revenues & Volume, By Chemical Plant , 2022-2032F |
6.2.5 United Arab Emirates (UAE) Chemical Packaging Market Revenues & Volume, By Others, 2022-2032F |
7 United Arab Emirates (UAE) Chemical Packaging Market Import-Export Trade Statistics |
7.1 United Arab Emirates (UAE) Chemical Packaging Market Export to Major Countries |
7.2 United Arab Emirates (UAE) Chemical Packaging Market Imports from Major Countries |
8 United Arab Emirates (UAE) Chemical Packaging Market Key Performance Indicators |
9 United Arab Emirates (UAE) Chemical Packaging Market - Opportunity Assessment |
9.1 United Arab Emirates (UAE) Chemical Packaging Market Opportunity Assessment, By Product Types, 2022 & 2032F |
9.2 United Arab Emirates (UAE) Chemical Packaging Market Opportunity Assessment, By Applications, 2022 & 2032F |
10 United Arab Emirates (UAE) Chemical Packaging Market - Competitive Landscape |
10.1 United Arab Emirates (UAE) Chemical Packaging Market Revenue Share, By Companies, 2025 |
10.2 United Arab Emirates (UAE) Chemical Packaging Market Competitive Benchmarking, By Operating and Technical Parameters |
11 Company Profiles |
12 Recommendations |
13 Disclaimer |
Global Go To Market Strategy - 2030
Export potential enables firms to identify high-growth global markets with greater confidence by combining advanced trade intelligence with a structured quantitative methodology. The framework analyzes emerging demand trends and country-level import patterns while integrating macroeconomic and trade datasets such as GDP and population forecasts, bilateral import–export flows, tariff structures, elasticity differentials between developed and developing economies, geographic distance, and import demand projections. Using weighted trade values from 2020–2024 as the base period to project country-to-country export potential for 2030, these inputs are operationalized through calculated drivers such as gravity model parameters, tariff impact factors, and projected GDP per-capita growth. Through an analysis of hidden potentials, demand hotspots, and market conditions that are most favorable to success, this method enables firms to focus on target countries, maximize returns, and global expansion with data, backed by accuracy.
By factoring in the projected importer demand gap that is currently unmet and could be potential opportunity, it identifies the potential for the Exporter (Country) among 190 countries, against the general trade analysis, which identifies the biggest importer or exporter.
To discover high-growth global markets and optimize your business strategy:
Click Here
Pricing
- Single User License$ 1,995
- Department License$ 2,400
- Site License$ 3,120
- Global License$ 3,795

Leadership Perspectives from Industry Events
Search
Thought Leadership and Analyst Meet


Our Clients
6WResearch In News
- India Air Conditioner Market Set for Strong Rebound in 2026 After Weather-Led Correction and GST-Driven Recovery: 6Wresearch
- ADAS in India: How Automatic Emergency Braking, Blind Spot Detection & Driver Monitoring are Transforming Road Safety
- Doha a strategic location for EV manufacturing hub: IPA Qatar
- Demand for luxury TVs surging in the GCC, says Samsung
- Empowering Growth: The Thriving Journey of Bangladesh’s Cable Industry
- Demand for luxury TVs surging in the GCC, says Samsung
Latest Reports
- Nicaragua RPG Gaming Market (2026-2032)
- New Zealand RPG Gaming Market (2026-2032)
- Netherlands RPG Gaming Market (2026-2032)
- Nauru RPG Gaming Market (2026-2032)
- Namibia RPG Gaming Market (2026-2032)
- Mozambique RPG Gaming Market (2026-2032)
- Montenegro RPG Gaming Market (2026-2032)
- Mongolia RPG Gaming Market (2026-2032)
- Monaco RPG Gaming Market (2026-2032)
- Micronesia RPG Gaming Market (2026-2032)
Industry Events and Analyst Meet

EV India Expo 2026

HIMTEX 2026

India Refining Summit 2026

India EV Show 2026

EV tech India Expo 2026
Whitepaper
- Middle East & Africa Commercial Security Market Click here to view more.
- Middle East & Africa Fire Safety Systems & Equipment Market Click here to view more.
- GCC Drone Market Click here to view more.
- Middle East Lighting Fixture Market Click here to view more.
- GCC Physical & Perimeter Security Market Click here to view more.