United Arab Emirates (UAE) Clay Refractories Market (2026-2032) | Trends, Size, Growth, Analysis, Outlook, Share, Industry, Forecast, Revenue, Value & Companies
Market Forecast By Form (Bricks, Monolithic, Others), By Application (Construction, Steel Making, Cosmetics, Food Industry) And Competitive Landscape
| Product Code: ETC027720 | Publication Date: Aug 2023 | Updated Date: Jun 2026 | Product Type: Report | |
| Publisher: 6Wresearch | Author: Ravi Bhandari | No. of Pages: 70 | No. of Figures: 35 | No. of Tables: 5 |
United Arab Emirates (UAE) Clay Refractories Market Summary
The united arab emirates (uae) clay refractories market was estimated at USD 217 Million in 2025 and is projected to reach USD 292 Million by 2032, growing at a CAGR of 4.9% from 2026 to 2032.
United Arab Emirates (UAE) Clay Refractories Market Year-wise Growth Rate and Key Drivers
This graph highlights how the United Arab Emirates (UAE) Clay Refractories Market has steadily grown over the past five years, supported by major growth factors.
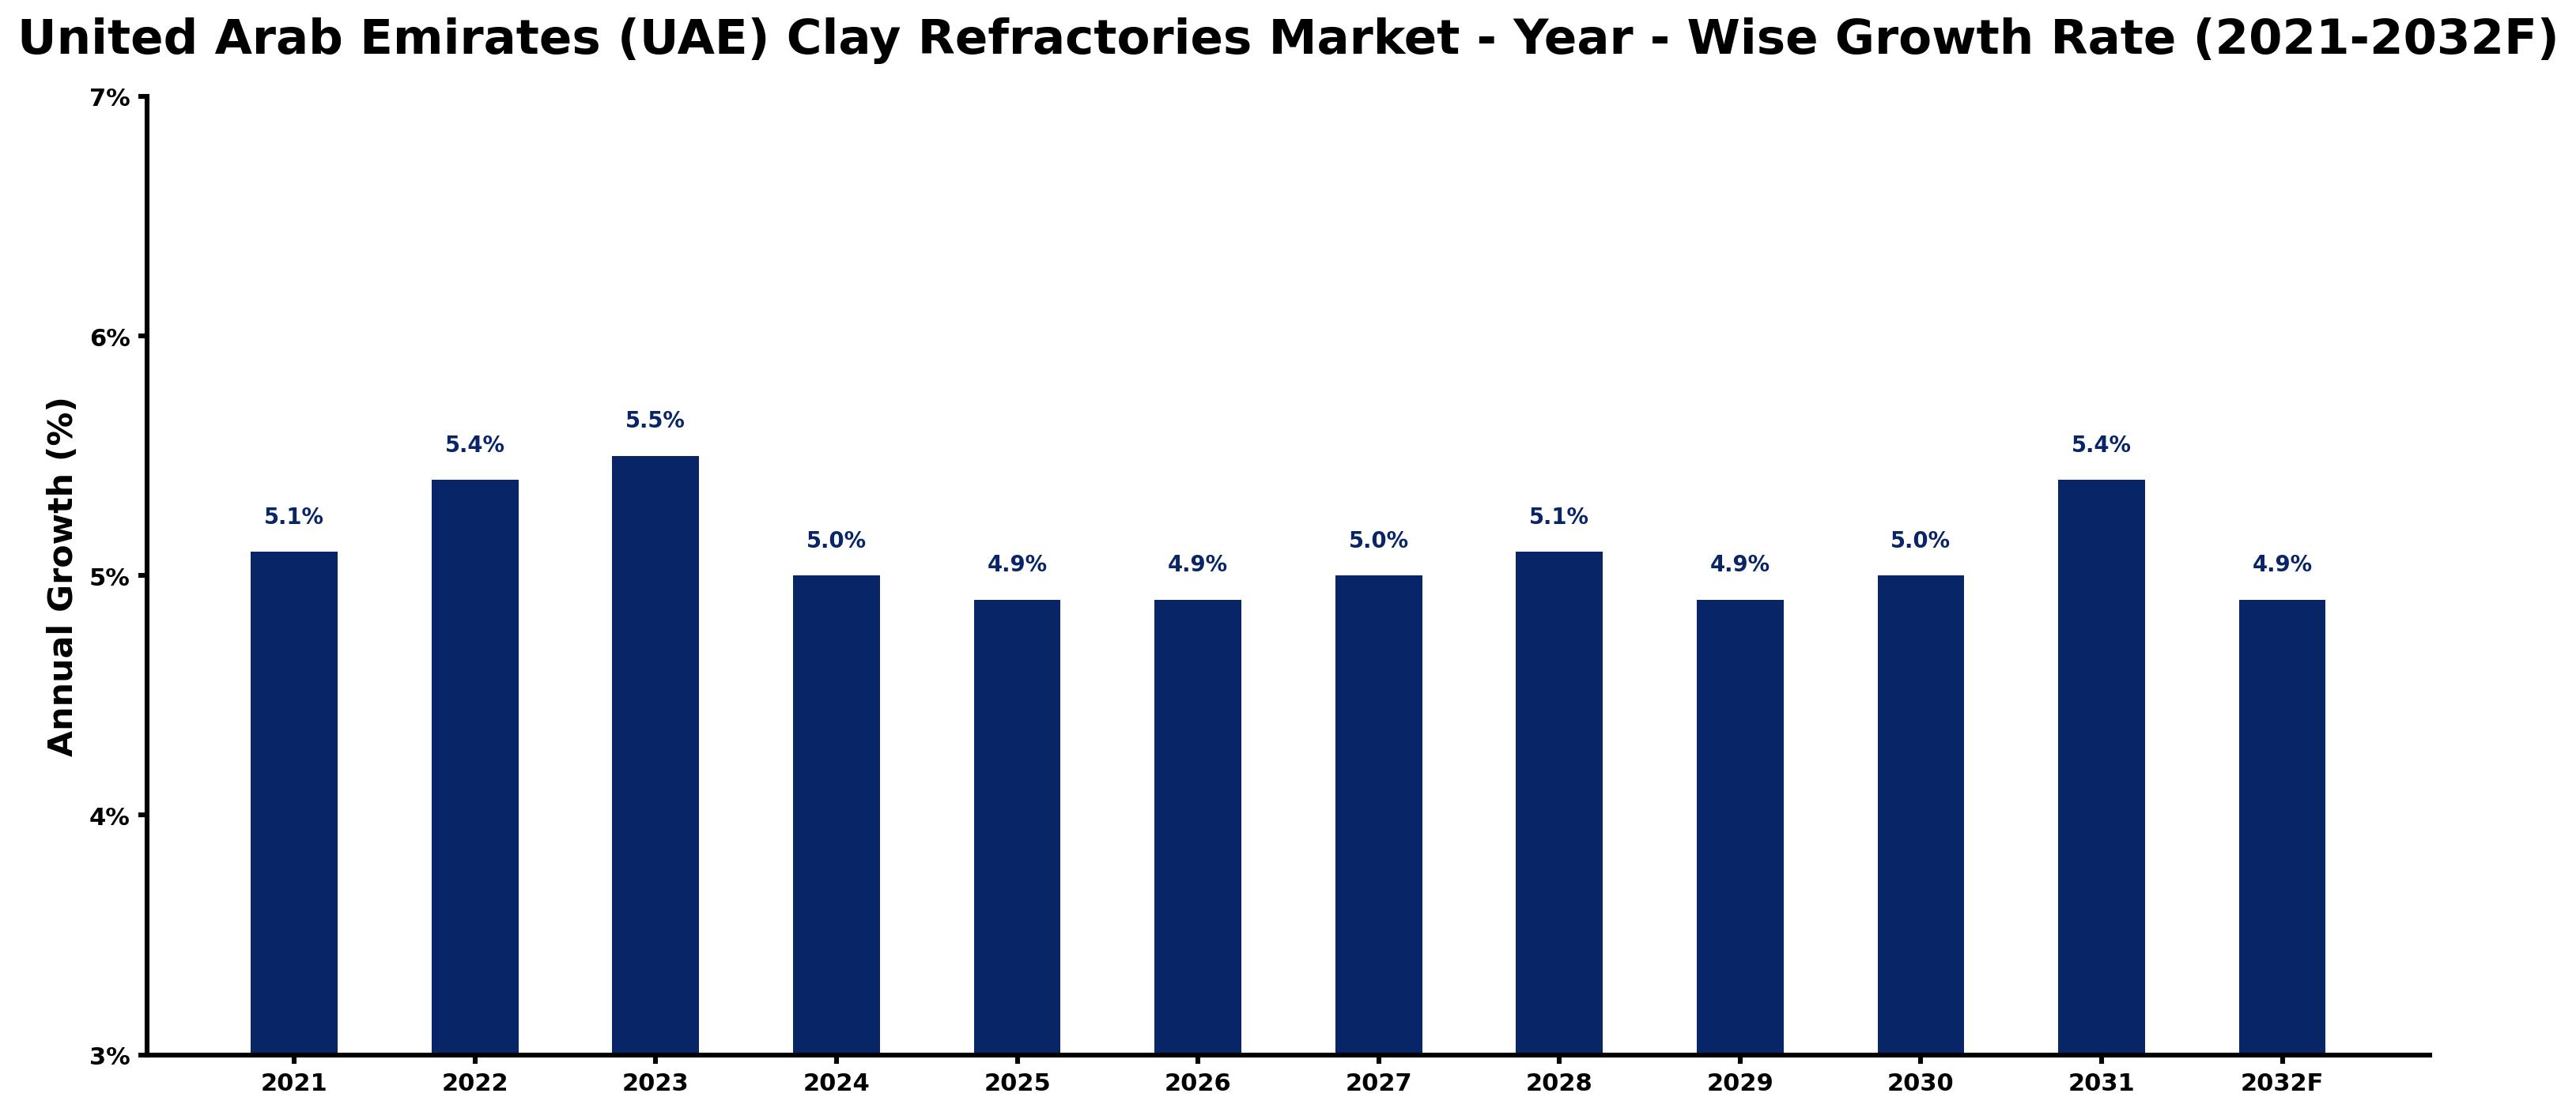
The table below presents the year wise growth rates along with the key drivers influencing the market
| Year | Growth Rate | Major Drivers |
| 2021 | 5.1% | Expansion in construction projects spurred demand for high-performance clay refractories. |
| 2022 | 5.4% | Real estate developments in Dubai and Abu Dhabi increased refractory consumption. |
| 2023 | 5.5% | New industrial plants coming online required robust refractory materials for efficiency. |
| 2024 | 5.0% | Energy sector growth prompted investments in refractory materials for power generation. |
| 2025 | 4.9% | International collaborations led to technological exchange in refractory manufacturing methods. |
| 2026 | 4.9% | Increased regional competition encouraged innovation in refractory product offerings. |
| 2027 | 5.0% | Sustainability trends shifted focus toward eco-friendly refractory materials in manufacturing. |
| 2028 | 5.1% | Enhanced logistics networks improved supply chain efficiency in refractory distribution. |
| 2029 | 4.9% | Emerging sectors like renewable energy created niche markets for specialized refractories. |
| 2030 | 5.0% | Advanced materials science led to superior performance characteristics in clay refractories. |
| 2031 | 5.4% | Market consolidation resulted in stronger brands and improved product quality standards. |
| 2032 | 4.9% | Technological advancements in application methods enhanced performance of refractory materials. |
Note - Market size estimations and growth projections presented in this report are based on 6Wresearch's advanced forecasting approach, validated with industry datasets as of June 2026.
United Arab Emirates (UAE) Clay Refractories Market Synopsis
The United Arab Emirates (UAE) Clay Refractories Market is projected to reach 4.9% and witness significant growth during the forecast period (2026-2032). The market has been on an upward trajectory in recent years due to the expansion of essential industrial sectors, specifically construction, steel production, and petrochemical manufacturing. Clay refractories serve as critical high-temperature materials utilized in lining furnaces, kilns, and varied industrial equipment, thereby enduring extreme heat and resisting chemical corrosion. The ongoing growth in the UAE's industrial activities, alongside extensive infrastructure development, has been a pivotal factor driving demand for clay refractories in this region.
United Arab Emirates (UAE) Clay Refractories Market Growth Drivers
The robust growth of the construction sector in the UAE constitutes a primary driver of the clay refractories market. Significant developments can be attributed to both government-led initiatives and private sector investments aimed at enhancing infrastructure. As a result, clay refractories have become crucial for various applications, including:
- Lining kilns and furnaces in cement manufacturing facilities, which are essential for producing quality building materials.
- Supporting high-temperature processes in steel mills, particularly in electric arc furnaces and ladle linings, where the demand for refractories is escalating due to increased steel production.
- Facilitating the operations of petrochemical refineries, which rely heavily on refractory materials to withstand harsh processing conditions.
- Contributing to the thermal efficiency and durability of industrial equipment, reducing operational costs over time.
- Meeting the specifications of increasingly stringent industry regulations that require the use of high-performance materials.
United Arab Emirates (UAE) Clay Refractories Market Challenges and Restraints
Despite the favorable growth dynamics, the UAE clay refractories market is confronted with several challenges. One notable issue is the increasing competition from alternative refractory materials. While clay refractories are known for their superior thermal resistance and chemical stability, advanced materials such as alumina and silicon carbide are gaining traction, particularly for specialized high-temperature applications. Additionally, the volatility of raw material prices presents another significant hurdle:
- Fluctuations in the cost of high-quality clays and production additives can adversely affect the overall production costs for manufacturers.
- Market players may struggle to maintain competitive pricing while dealing with rising input costs, potentially impacting profit margins.
- Shifts in demand patterns due to global economic factors can lead to uncertainty in market stability and pricing.
- Evolving environmental regulations may necessitate changes in production practices, requiring significant investment in new technologies.
- Supply chain disruptions, especially in light of recent global events, can hinder timely access to necessary raw materials.
United Arab Emirates (UAE) Clay Refractories Market Government Investment and Initiatives
The UAE government plays a crucial role in fostering the growth of the clay refractories market through various investment initiatives and supportive policies. Several key government efforts include:
- Commitment to diversifying the economy away from oil reliance, with a focus on enhancing industrial capabilities, which boosts the demand for refractory materials.
- Investment in large-scale infrastructure projects that stimulate the construction sector, thereby creating sustained demand for clay refractories.
- Implementation of regulatory frameworks aimed at promoting the use of advanced materials in industrial applications, encouraging innovation in the refractories sector.
- Support for research and development initiatives focused on improving refractory material performance, ensuring compliance with environmental standards.
- Encouragement of public-private partnerships to enhance efficiency in the sector, promoting knowledge sharing and technological advancements.
United Arab Emirates (UAE) Clay Refractories Market Latest Developments (May 2025 - June 2026)
Recent developments within the United Arab Emirates (UAE) clay refractories market between May 2025 and June 2026 indicate a trend toward innovation and enhanced operational efficiencies. Notable industry direction highlights include:
- An increasing push for sustainability measures, with manufacturers exploring eco-friendly materials and production techniques to meet evolving regulatory standards.
- Recent collaborations among industry stakeholders aimed at sharing best practices and improving the overall performance of clay refractories in various applications.
- A noticeable uptick in research activities focused on enhancing the thermal properties and longevity of clay refractories, fostering competitive advantages in the market.
- Resilience and recovery of market demand post-COVID-19, as construction and industrial activities regain momentum, further driving the need for refractory materials.
- Exploration of new markets and applications for clay refractories beyond traditional uses, emphasizing adaptability and innovation within the sector.
United Arab Emirates (UAE) Clay Refractories Market - Key Attractiveness of the Report
- 10 Years of Market Numbers
- Historical Data Starting from 2022 to 2025
- Base Year: 2025
- Forecast Data until 2032
- Key Performance Indicators Impacting the Market
- Major Upcoming Developments and Projects
Key Highlights of the Report:
- United Arab Emirates (UAE) Clay Refractories Market Outlook
- Market Size of United Arab Emirates (UAE) Clay Refractories Market, 2025
- Forecast of United Arab Emirates (UAE) Clay Refractories Market, 2032
- Historical Data and Forecast of United Arab Emirates (UAE) Clay Refractories Revenues & Volume for the Period 2022-2032F
- United Arab Emirates (UAE) Clay Refractories Market Trend Evolution
- United Arab Emirates (UAE) Clay Refractories Market Drivers and Challenges
- United Arab Emirates (UAE) Clay Refractories Price Trends
- United Arab Emirates (UAE) Clay Refractories Porter's Five Forces
- United Arab Emirates (UAE) Clay Refractories Industry Life Cycle
- Historical Data and Forecast of United Arab Emirates (UAE) Clay Refractories Market Revenues & Volume By Form for the Period 2022-2032F
- Historical Data and Forecast of United Arab Emirates (UAE) Clay Refractories Market Revenues & Volume By Bricks for the Period 2022-2032F
- Historical Data and Forecast of United Arab Emirates (UAE) Clay Refractories Market Revenues & Volume By Monolithic for the Period 2022-2032F
- Historical Data and Forecast of United Arab Emirates (UAE) Clay Refractories Market Revenues & Volume By Others for the Period 2022-2032F
- Historical Data and Forecast of United Arab Emirates (UAE) Clay Refractories Market Revenues & Volume By Application for the Period 2022-2032F
- Historical Data and Forecast of United Arab Emirates (UAE) Clay Refractories Market Revenues & Volume By Construction for the Period 2022-2032F
- Historical Data and Forecast of United Arab Emirates (UAE) Clay Refractories Market Revenues & Volume By Steel Making for the Period 2022-2032F
- Historical Data and Forecast of United Arab Emirates (UAE) Clay Refractories Market Revenues & Volume By Cosmetics for the Period 2022-2032F
- Historical Data and Forecast of United Arab Emirates (UAE) Clay Refractories Market Revenues & Volume By Food Industry for the Period 2022-2032F
- United Arab Emirates (UAE) Clay Refractories Import Export Trade Statistics
- Market Opportunity Assessment By Form
- Market Opportunity Assessment By Application
- United Arab Emirates (UAE) Clay Refractories Top Companies Market Share
- United Arab Emirates (UAE) Clay Refractories Competitive Benchmarking By Technical and Operational Parameters
- United Arab Emirates (UAE) Clay Refractories Company Profiles
- United Arab Emirates (UAE) Clay Refractories Key Strategic Recommendations
Frequently Asked Questions About the Market Study (FAQs):
Clay refractories in the UAE are primarily utilized in high-temperature industrial applications, including lining furnaces and kilns in the construction, steel, and petrochemical sectors.
The growth is driven by robust construction and industrial activities, infrastructure development, and the expanding steel industry requiring efficient refractory materials.
Challenges include competition from alternative refractory materials and the volatility in raw material prices, which can impact production and pricing strategies.
The pandemic initially disrupted industrial activities and construction projects; however, there has been a subsequent recovery as economic activities resumed, leading to increased demand for clay refractories.
6Wresearch actively monitors the United Arab Emirates (UAE) Clay Refractories Market and publishes its comprehensive annual report, highlighting emerging trends, growth drivers, revenue analysis, and forecast outlook. Our insights help businesses to make data-backed strategic decisions with ongoing market dynamics. Our analysts track relevent industries related to the United Arab Emirates (UAE) Clay Refractories Market, allowing our clients with actionable intelligence and reliable forecasts tailored to emerging regional needs.
Yes, we provide customisation as per your requirements. To learn more, feel free to contact us on sales@6wresearch.com
1 Executive Summary |
2 Introduction |
2.1 Key Highlights of the Report |
2.2 Report Description |
2.3 Market Scope & Segmentation |
2.4 Research Methodology |
2.5 Assumptions |
3 United Arab Emirates (UAE) Clay Refractories Market Overview |
3.1 United Arab Emirates (UAE) Country Macro Economic Indicators |
3.2 United Arab Emirates (UAE) Clay Refractories Market Revenues & Volume, 2022 & 2032F |
3.3 United Arab Emirates (UAE) Clay Refractories Market - Industry Life Cycle |
3.4 United Arab Emirates (UAE) Clay Refractories Market - Porter's Five Forces |
3.5 United Arab Emirates (UAE) Clay Refractories Market Revenues & Volume Share, By Form, 2022 & 2032F |
3.6 United Arab Emirates (UAE) Clay Refractories Market Revenues & Volume Share, By Application, 2022 & 2032F |
4 United Arab Emirates (UAE) Clay Refractories Market Dynamics |
4.1 Impact Analysis |
4.2 Market Drivers |
4.2.1 Growing construction activities in the UAE leading to increased demand for clay refractories. |
4.2.2 Expansion of industrial sectors such as steel, cement, and petrochemicals driving the need for clay refractories. |
4.2.3 Government initiatives promoting infrastructure development and industrial growth. |
4.3 Market Restraints |
4.3.1 Fluctuating raw material prices impacting the production cost of clay refractories. |
4.3.2 Environmental regulations restricting the use of certain types of clay refractories. |
4.3.3 Intense competition from alternative refractory materials affecting market penetration. |
5 United Arab Emirates (UAE) Clay Refractories Market Trends |
6 United Arab Emirates (UAE) Clay Refractories Market, By Types |
6.1 United Arab Emirates (UAE) Clay Refractories Market, By Form |
6.1.1 Overview and Analysis |
6.1.2 United Arab Emirates (UAE) Clay Refractories Market Revenues & Volume, By Form, 2022-2032F |
6.1.3 United Arab Emirates (UAE) Clay Refractories Market Revenues & Volume, By Bricks, 2022-2032F |
6.1.4 United Arab Emirates (UAE) Clay Refractories Market Revenues & Volume, By Monolithic, 2022-2032F |
6.1.5 United Arab Emirates (UAE) Clay Refractories Market Revenues & Volume, By Others, 2022-2032F |
6.2 United Arab Emirates (UAE) Clay Refractories Market, By Application |
6.2.1 Overview and Analysis |
6.2.2 United Arab Emirates (UAE) Clay Refractories Market Revenues & Volume, By Construction, 2022-2032F |
6.2.3 United Arab Emirates (UAE) Clay Refractories Market Revenues & Volume, By Steel Making, 2022-2032F |
6.2.4 United Arab Emirates (UAE) Clay Refractories Market Revenues & Volume, By Cosmetics, 2022-2032F |
6.2.5 United Arab Emirates (UAE) Clay Refractories Market Revenues & Volume, By Food Industry, 2022-2032F |
7 United Arab Emirates (UAE) Clay Refractories Market Import-Export Trade Statistics |
7.1 United Arab Emirates (UAE) Clay Refractories Market Export to Major Countries |
7.2 United Arab Emirates (UAE) Clay Refractories Market Imports from Major Countries |
8 United Arab Emirates (UAE) Clay Refractories Market Key Performance Indicators |
8.1 Energy efficiency improvements in clay refractories production processes. |
8.2 Adoption of sustainable practices in clay refractories manufacturing. |
8.3 Research and development investments in enhancing the performance of clay refractories. |
8.4 Compliance with quality standards and certifications in clay refractories production. |
8.5 Customer satisfaction levels with the performance and durability of clay refractories. |
9 United Arab Emirates (UAE) Clay Refractories Market - Opportunity Assessment |
9.1 United Arab Emirates (UAE) Clay Refractories Market Opportunity Assessment, By Form, 2022 & 2032F |
9.2 United Arab Emirates (UAE) Clay Refractories Market Opportunity Assessment, By Application, 2022 & 2032F |
10 United Arab Emirates (UAE) Clay Refractories Market - Competitive Landscape |
10.1 United Arab Emirates (UAE) Clay Refractories Market Revenue Share, By Companies, 2025 |
10.2 United Arab Emirates (UAE) Clay Refractories Market Competitive Benchmarking, By Operating and Technical Parameters |
11 Company Profiles |
12 Recommendations |
13 Disclaimer |
Global Go To Market Strategy - 2030
Export potential enables firms to identify high-growth global markets with greater confidence by combining advanced trade intelligence with a structured quantitative methodology. The framework analyzes emerging demand trends and country-level import patterns while integrating macroeconomic and trade datasets such as GDP and population forecasts, bilateral import–export flows, tariff structures, elasticity differentials between developed and developing economies, geographic distance, and import demand projections. Using weighted trade values from 2020–2024 as the base period to project country-to-country export potential for 2030, these inputs are operationalized through calculated drivers such as gravity model parameters, tariff impact factors, and projected GDP per-capita growth. Through an analysis of hidden potentials, demand hotspots, and market conditions that are most favorable to success, this method enables firms to focus on target countries, maximize returns, and global expansion with data, backed by accuracy.
By factoring in the projected importer demand gap that is currently unmet and could be potential opportunity, it identifies the potential for the Exporter (Country) among 190 countries, against the general trade analysis, which identifies the biggest importer or exporter.
To discover high-growth global markets and optimize your business strategy:
Click Here
Pricing
- Single User License$ 1,995
- Department License$ 2,400
- Site License$ 3,120
- Global License$ 3,795

Leadership Perspectives from Industry Events
Search
Thought Leadership and Analyst Meet


Our Clients
6WResearch In News
- India Air Conditioner Market Set for Strong Rebound in 2026 After Weather-Led Correction and GST-Driven Recovery: 6Wresearch
- ADAS in India: How Automatic Emergency Braking, Blind Spot Detection & Driver Monitoring are Transforming Road Safety
- Doha a strategic location for EV manufacturing hub: IPA Qatar
- Demand for luxury TVs surging in the GCC, says Samsung
- Empowering Growth: The Thriving Journey of Bangladesh’s Cable Industry
- Demand for luxury TVs surging in the GCC, says Samsung
Latest Reports
- Nicaragua RPG Gaming Market (2026-2032)
- New Zealand RPG Gaming Market (2026-2032)
- Netherlands RPG Gaming Market (2026-2032)
- Nauru RPG Gaming Market (2026-2032)
- Namibia RPG Gaming Market (2026-2032)
- Mozambique RPG Gaming Market (2026-2032)
- Montenegro RPG Gaming Market (2026-2032)
- Mongolia RPG Gaming Market (2026-2032)
- Monaco RPG Gaming Market (2026-2032)
- Micronesia RPG Gaming Market (2026-2032)
Industry Events and Analyst Meet

EV India Expo 2026

HIMTEX 2026

India Refining Summit 2026

India EV Show 2026

EV tech India Expo 2026
Whitepaper
- Middle East & Africa Commercial Security Market Click here to view more.
- Middle East & Africa Fire Safety Systems & Equipment Market Click here to view more.
- GCC Drone Market Click here to view more.
- Middle East Lighting Fixture Market Click here to view more.
- GCC Physical & Perimeter Security Market Click here to view more.