United Arab Emirates (UAE) Make up Products Market (2026-2032) | Companies, Share, Outlook, Revenue, Industry, Trends, Growth, Size, Value, Forecast & Analysis
Market Forecast By Types (Foundation, Face Powder, Blush, Concealer, Bronzer, Others), By Distribution Channel (Supermarkets and Hypermarkets, Specialist Retailers, Pharmacies, Online Retailers, Others) And Competitive Landscape
| Product Code: ETC021540 | Publication Date: Aug 2023 | Updated Date: Jun 2026 | Product Type: Report | |
| Publisher: 6Wresearch | Author: Ravi Bhandari | No. of Pages: 70 | No. of Figures: 35 | No. of Tables: 5 |
United Arab Emirates (UAE) Make up Products Market Summary
The united arab emirates (uae) make up products market was estimated at USD 152 Million in 2025 and is projected to reach USD 205 Million by 2032, growing at a CAGR of 4.9% from 2026 to 2032.
United Arab Emirates (UAE) Make up Products Market Year-wise Growth Rate and Key Drivers
This graph highlights how the United Arab Emirates (UAE) Make up Products Market has steadily grown over the past five years, supported by major growth factors.
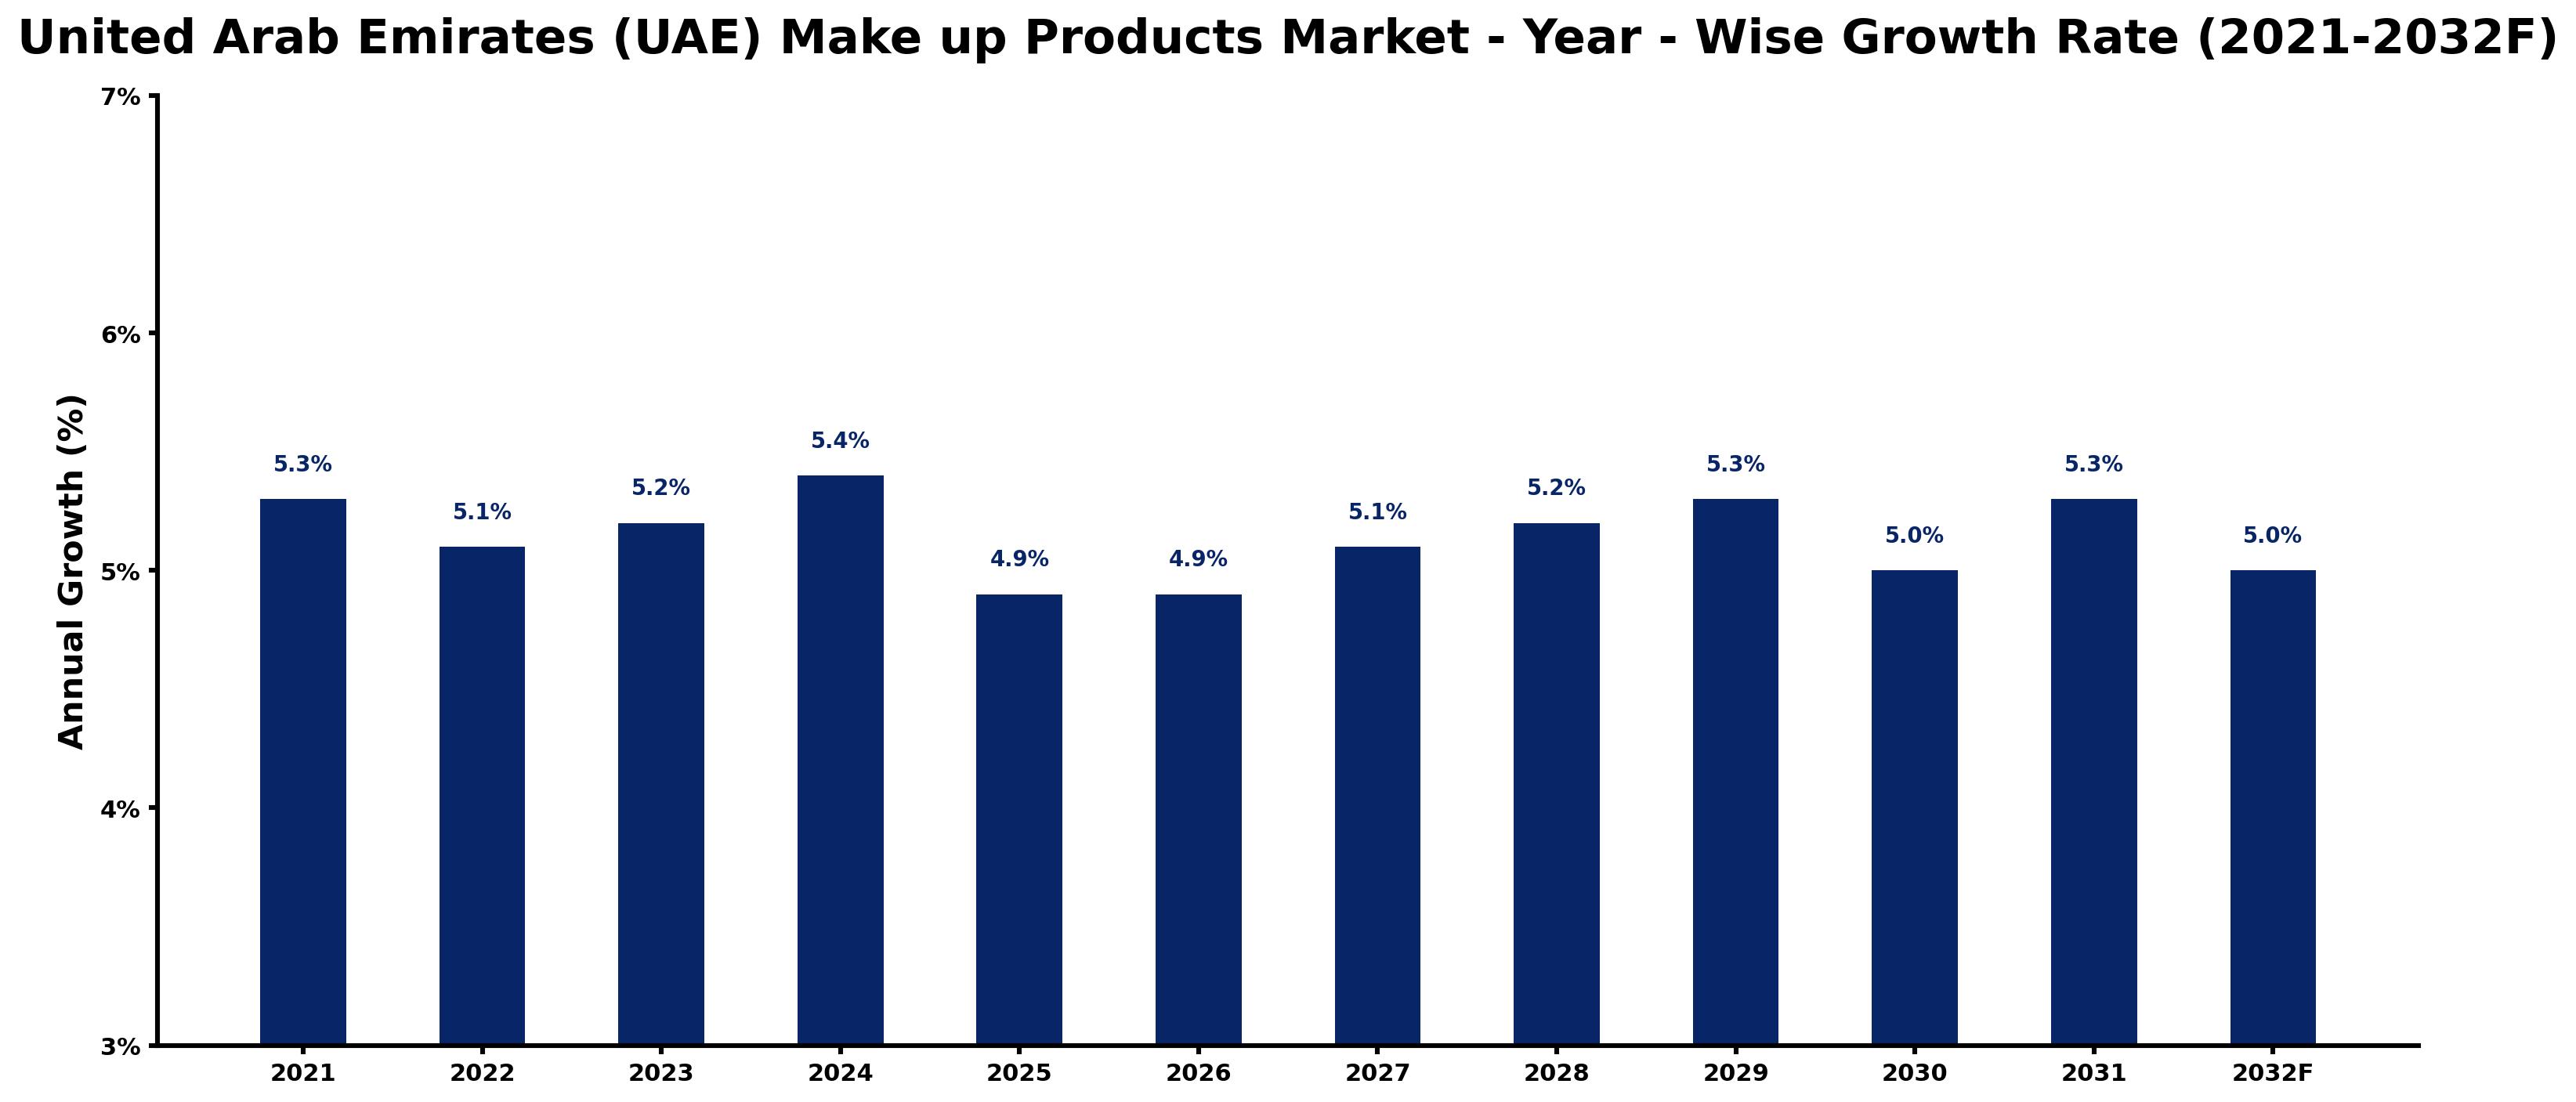
The table below presents the year wise growth rates along with the key drivers influencing the market
| Year | Growth Rate | Major Drivers |
| 2021 | 5.3% | Market recovery post-COVID-19 led to increased consumer spending and confidence. |
| 2022 | 5.1% | Expansion of e-commerce platforms attracted younger demographics across the UAE. |
| 2023 | 5.2% | Investments in sustainable packaging solutions gained traction among environmentally conscious brands. |
| 2024 | 5.4% | Emerging local brands challenged established players, reshaping competitive dynamics significantly. |
| 2025 | 4.9% | Retail spaces adapted to hybrid shopping experiences, enhancing customer engagement strategies. |
| 2026 | 4.9% | Construction projects in Neom emphasized local sourcing, influencing product market dynamics. |
| 2027 | 5.1% | Rising expatriate population introduced diverse consumer preferences requiring tailored product offerings. |
| 2028 | 5.2% | Technological integration in retail improved supply chain efficiency and inventory management. |
| 2029 | 5.3% | Health and wellness trends prompted increased demand for organic and natural products. |
| 2030 | 5.0% | Climate considerations drove innovation in construction materials and energy-efficient products. |
| 2031 | 5.3% | Cultural events and festivals created unique marketing opportunities for seasonal product launches. |
| 2032 | 5.0% | The focus on digital transformation reshaped traditional marketing strategies across industries. |
Note - Market size estimations and growth projections presented in this report are based on 6Wresearch's advanced forecasting approach, validated with industry datasets as of June 2026.
United Arab Emirates (UAE) Make up Products Market Synopsis
The United Arab Emirates (UAE) Make up Products Market is projected to reach 4.9% and witness significant growth during the forecast period (2026-2032). This dynamic sector encompasses a wide array of cosmetic products that cater to facial makeup needs, including but not limited to foundation, lipstick, mascara, and eyeshadow. Driven by escalating disposable income, a burgeoning young demographic, and evolving beauty trends influenced by social media and celebrity endorsements, the UAE makeup products market is poised for substantial expansion.
United Arab Emirates (UAE) Make up Products Market Growth Drivers
Several key factors contribute to the robust growth of the United Arab Emirates (UAE) Make up Products Market. Notably:
- The ongoing economic prosperity in the UAE has significantly increased disposable income levels, allowing consumers to allocate more funds toward beauty and personal care products, including various makeup options.
- A youthful and vibrant population, characterized by an increasing number of individuals under 30, has driven demand for diverse makeup products that align with contemporary beauty standards.
- Rapid changes in beauty trends, often communicated through social media platforms, have created a culture where makeup use is widely embraced, further fueling market growth.
- The influence of beauty influencers and makeup tutorials on platforms such as Instagram and YouTube has transformed consumer purchasing habits, encouraging experimentation and brand loyalty.
- Innovations in product formulations and packaging tailored to consumer preferences have played a crucial role in attracting new customers and retaining existing ones.
United Arab Emirates (UAE) Make up Products Market Trends and Opportunities
The United Arab Emirates (UAE) Make up Products Market is witnessing several notable trends that present lucrative opportunities for industry participants.
- There is a marked shift towards cruelty-free and eco-friendly makeup products, reflective of a growing consumer awareness about sustainability and ethical manufacturing practices.
- The rise of online shopping platforms has made makeup products more accessible, especially among tech-savvy youth who prefer the convenience of e-commerce.
- Customized makeup solutions tailored to individual skin tones and preferences are gaining traction, providing brands with the opportunity to differentiate themselves.
- The proliferation of halal cosmetics aligned with Islamic values has opened a niche market, catering specifically to the UAE's diverse demographic.
- Collaborations between established brands and social media influencers are becoming a common strategy for launching new products, thus creating buzz and enhancing visibility.
United Arab Emirates (UAE) Make up Products Market Challenges and Restraints
While the United Arab Emirates (UAE) Make up Products Market demonstrates promising growth potential, it is not without its challenges.
- Cultural sensitivities surrounding makeup use, particularly in more conservative regions, may restrain market penetration and affect consumer acceptance.
- Increasing consumer preference for sustainable and eco-friendly options poses a challenge for conventional brands that may struggle to transition to greener products.
- Market saturation, particularly in urban areas, has intensified competition among brands, necessitating innovative marketing strategies to stand out.
- Economic fluctuations and uncertainties can impact discretionary spending, potentially leading to reduced consumer investments in beauty products.
- Regulatory changes and import restrictions may pose barriers to market entry for international brands seeking to establish a presence in the UAE.
United Arab Emirates (UAE) Make up Products Market Government Investment and Initiatives
The United Arab Emirates (UAE) government has recognized the significance of the beauty and cosmetics sector as part of its broader economic diversification strategy.
- Investment in infrastructure supporting retail and e-commerce has been a priority, facilitating growth in the makeup products market by improving accessibility.
- Government initiatives aimed at promoting local production have encouraged brands to invest in local manufacturing facilities, enhancing supply chain efficiencies.
- Public efforts to foster innovation and entrepreneurship in the beauty sector have led to the establishment of programs that provide funding and support for startups.
- Strategic partnerships with international trade organizations have aimed to enhance the UAE's position as a global hub for beauty and cosmetics.
- Regulatory frameworks focused on quality standards and consumer safety are being developed to foster a transparent marketplace for cosmetic products.
United Arab Emirates (UAE) Make up Products Market Latest Developments (May 2025 - June 2026)
Recent developments in the United Arab Emirates (UAE) Make up Products Market indicate a continued evolution in consumer preferences and industry practices.
- The introduction of new product lines catering to diverse skin tones and preferences has gained attention, reinforcing brands' commitments to inclusivity.
- Increased collaborations between makeup brands and local influencers have enhanced brand visibility and consumer engagement, leading to successful product launches.
- There has been a visible shift towards sustainable packaging solutions in various product offerings, aligning with global trends toward environmental consciousness.
- Consumer interest in organic and clean beauty products has surged, prompting brands to reformulate existing products to meet heightened demand for natural ingredients.
- Market players have invested in digital marketing strategies to better connect with a tech-savvy audience, utilizing platforms like social media for product promotions.
United Arab Emirates (UAE) Make up Products Market - Key Attractiveness of the Report
- 10 Years of Market Numbers
- Historical Data Starting from 2022 to 2025
- Base Year: 2025
- Forecast Data until 2032
- Key Performance Indicators Impacting the Market
- Major Upcoming Developments and Projects
Key Highlights of the Report:
- United Arab Emirates (UAE) Make up Products Market Outlook
- Market Size of United Arab Emirates (UAE) Make up Products Market, 2025
- Forecast of United Arab Emirates (UAE) Make up Products Market, 2032
- Historical Data and Forecast of United Arab Emirates (UAE) Make up Products Revenues & Volume for the Period 2022-2032F
- United Arab Emirates (UAE) Make up Products Market Trend Evolution
- United Arab Emirates (UAE) Make up Products Market Drivers and Challenges
- United Arab Emirates (UAE) Make up Products Price Trends
- United Arab Emirates (UAE) Make up Products Porter's Five Forces
- United Arab Emirates (UAE) Make up Products Industry Life Cycle
- Historical Data and Forecast of United Arab Emirates (UAE) Make up Products Market Revenues & Volume By Types for the Period 2022-2032F
- Historical Data and Forecast of United Arab Emirates (UAE) Make up Products Market Revenues & Volume By Foundation for the Period 2022-2032F
- Historical Data and Forecast of United Arab Emirates (UAE) Make up Products Market Revenues & Volume By Face Powder for the Period 2022-2032F
- Historical Data and Forecast of United Arab Emirates (UAE) Make up Products Market Revenues & Volume By Blush for the Period 2022-2032F
- Historical Data and Forecast of United Arab Emirates (UAE) Make up Products Market Revenues & Volume By Concealer for the Period 2022-2032F
- Historical Data and Forecast of United Arab Emirates (UAE) Make up Products Market Revenues & Volume By Bronzer for the Period 2022-2032F
- Historical Data and Forecast of United Arab Emirates (UAE) Make up Products Market Revenues & Volume By Others for the Period 2022-2032F
- Historical Data and Forecast of United Arab Emirates (UAE) Make up Products Market Revenues & Volume By Distribution Channel for the Period 2022-2032F
- Historical Data and Forecast of United Arab Emirates (UAE) Make up Products Market Revenues & Volume By Supermarkets and Hypermarkets for the Period 2022-2032F
- Historical Data and Forecast of United Arab Emirates (UAE) Make up Products Market Revenues & Volume By Specialist Retailers for the Period 2022-2032F
- Historical Data and Forecast of United Arab Emirates (UAE) Make up Products Market Revenues & Volume By Pharmacies for the Period 2022-2032F
- Historical Data and Forecast of United Arab Emirates (UAE) Make up Products Market Revenues & Volume By Online Retailers for the Period 2022-2032F
- Historical Data and Forecast of United Arab Emirates (UAE) Make up Products Market Revenues & Volume By Others for the Period 2022-2032F
- United Arab Emirates (UAE) Make up Products Import Export Trade Statistics
- Market Opportunity Assessment By Types
- Market Opportunity Assessment By Distribution Channel
- United Arab Emirates (UAE) Make up Products Top Companies Market Share
- United Arab Emirates (UAE) Make up Products Competitive Benchmarking By Technical and Operational Parameters
- United Arab Emirates (UAE) Make up Products Company Profiles
- United Arab Emirates (UAE) Make up Products Key Strategic Recommendations
Frequently Asked Questions About the Market Study (FAQs):
Increased disposable income, a young consumer base, and the influence of social media trends are key drivers.
Challenges include cultural sensitivities, growing demand for sustainable products, and intense competition.
The pandemic resulted in a temporary decline in demand due to lockdowns, but the market has gradually recovered as restrictions have eased.
Trends include a shift towards eco-friendly products, online shopping growth, and increasing consumer interest in personalized makeup solutions.
6Wresearch actively monitors the United Arab Emirates (UAE) Make up Products Market and publishes its comprehensive annual report, highlighting emerging trends, growth drivers, revenue analysis, and forecast outlook. Our insights help businesses to make data-backed strategic decisions with ongoing market dynamics. Our analysts track relevent industries related to the United Arab Emirates (UAE) Make up Products Market, allowing our clients with actionable intelligence and reliable forecasts tailored to emerging regional needs.
Yes, we provide customisation as per your requirements. To learn more, feel free to contact us on sales@6wresearch.com
1 Executive Summary |
2 Introduction |
2.1 Key Highlights of the Report |
2.2 Report Description |
2.3 Market Scope & Segmentation |
2.4 Research Methodology |
2.5 Assumptions |
3 United Arab Emirates (UAE) Make up Products Market Overview |
3.1 United Arab Emirates (UAE) Country Macro Economic Indicators |
3.2 United Arab Emirates (UAE) Make up Products Market Revenues & Volume, 2022 & 2032F |
3.3 United Arab Emirates (UAE) Make up Products Market - Industry Life Cycle |
3.4 United Arab Emirates (UAE) Make up Products Market - Porter's Five Forces |
3.5 United Arab Emirates (UAE) Make up Products Market Revenues & Volume Share, By Types, 2022 & 2032F |
3.6 United Arab Emirates (UAE) Make up Products Market Revenues & Volume Share, By Distribution Channel, 2022 & 2032F |
4 United Arab Emirates (UAE) Make up Products Market Dynamics |
4.1 Impact Analysis |
4.2 Market Drivers |
4.2.1 Increasing disposable income among the population in the UAE |
4.2.2 Growing beauty and cosmetics industry in the region |
4.2.3 Influence of social media and beauty influencers on consumer preferences |
4.3 Market Restraints |
4.3.1 High import duties and taxes on cosmetics products in the UAE |
4.3.2 Cultural factors impacting consumer preferences and purchasing behavior |
5 United Arab Emirates (UAE) Make up Products Market Trends |
6 United Arab Emirates (UAE) Make up Products Market, By Types |
6.1 United Arab Emirates (UAE) Make up Products Market, By Types |
6.1.1 Overview and Analysis |
6.1.2 United Arab Emirates (UAE) Make up Products Market Revenues & Volume, By Types, 2022-2032F |
6.1.3 United Arab Emirates (UAE) Make up Products Market Revenues & Volume, By Foundation, 2022-2032F |
6.1.4 United Arab Emirates (UAE) Make up Products Market Revenues & Volume, By Face Powder, 2022-2032F |
6.1.5 United Arab Emirates (UAE) Make up Products Market Revenues & Volume, By Blush, 2022-2032F |
6.1.6 United Arab Emirates (UAE) Make up Products Market Revenues & Volume, By Concealer, 2022-2032F |
6.1.7 United Arab Emirates (UAE) Make up Products Market Revenues & Volume, By Bronzer, 2022-2032F |
6.1.8 United Arab Emirates (UAE) Make up Products Market Revenues & Volume, By Others, 2022-2032F |
6.2 United Arab Emirates (UAE) Make up Products Market, By Distribution Channel |
6.2.1 Overview and Analysis |
6.2.2 United Arab Emirates (UAE) Make up Products Market Revenues & Volume, By Supermarkets and Hypermarkets, 2022-2032F |
6.2.3 United Arab Emirates (UAE) Make up Products Market Revenues & Volume, By Specialist Retailers, 2022-2032F |
6.2.4 United Arab Emirates (UAE) Make up Products Market Revenues & Volume, By Pharmacies, 2022-2032F |
6.2.5 United Arab Emirates (UAE) Make up Products Market Revenues & Volume, By Online Retailers, 2022-2032F |
6.2.6 United Arab Emirates (UAE) Make up Products Market Revenues & Volume, By Others, 2022-2032F |
7 United Arab Emirates (UAE) Make up Products Market Import-Export Trade Statistics |
7.1 United Arab Emirates (UAE) Make up Products Market Export to Major Countries |
7.2 United Arab Emirates (UAE) Make up Products Market Imports from Major Countries |
8 United Arab Emirates (UAE) Make up Products Market Key Performance Indicators |
8.1 Number of new beauty and cosmetics stores opening in the UAE |
8.2 Growth in online sales of makeup products in the UAE |
8.3 Number of beauty events and exhibitions held in the UAE |
8.4 Increase in the number of collaborations between international makeup brands and local influencers |
8.5 Consumer engagement on social media platforms related to makeup trends in the UAE |
9 United Arab Emirates (UAE) Make up Products Market - Opportunity Assessment |
9.1 United Arab Emirates (UAE) Make up Products Market Opportunity Assessment, By Types, 2022 & 2032F |
9.2 United Arab Emirates (UAE) Make up Products Market Opportunity Assessment, By Distribution Channel, 2022 & 2032F |
10 United Arab Emirates (UAE) Make up Products Market - Competitive Landscape |
10.1 United Arab Emirates (UAE) Make up Products Market Revenue Share, By Companies, 2025 |
10.2 United Arab Emirates (UAE) Make up Products Market Competitive Benchmarking, By Operating and Technical Parameters |
11 Company Profiles |
12 Recommendations |
13 Disclaimer |
Global Go To Market Strategy - 2030
Export potential enables firms to identify high-growth global markets with greater confidence by combining advanced trade intelligence with a structured quantitative methodology. The framework analyzes emerging demand trends and country-level import patterns while integrating macroeconomic and trade datasets such as GDP and population forecasts, bilateral import–export flows, tariff structures, elasticity differentials between developed and developing economies, geographic distance, and import demand projections. Using weighted trade values from 2020–2024 as the base period to project country-to-country export potential for 2030, these inputs are operationalized through calculated drivers such as gravity model parameters, tariff impact factors, and projected GDP per-capita growth. Through an analysis of hidden potentials, demand hotspots, and market conditions that are most favorable to success, this method enables firms to focus on target countries, maximize returns, and global expansion with data, backed by accuracy.
By factoring in the projected importer demand gap that is currently unmet and could be potential opportunity, it identifies the potential for the Exporter (Country) among 190 countries, against the general trade analysis, which identifies the biggest importer or exporter.
To discover high-growth global markets and optimize your business strategy:
Click Here
Pricing
- Single User License$ 1,995
- Department License$ 2,400
- Site License$ 3,120
- Global License$ 3,795

Leadership Perspectives from Industry Events
Search
Thought Leadership and Analyst Meet


Our Clients
6WResearch In News
- India Air Conditioner Market Set for Strong Rebound in 2026 After Weather-Led Correction and GST-Driven Recovery: 6Wresearch
- ADAS in India: How Automatic Emergency Braking, Blind Spot Detection & Driver Monitoring are Transforming Road Safety
- Doha a strategic location for EV manufacturing hub: IPA Qatar
- Demand for luxury TVs surging in the GCC, says Samsung
- Empowering Growth: The Thriving Journey of Bangladesh’s Cable Industry
- Demand for luxury TVs surging in the GCC, says Samsung
Latest Reports
- Nicaragua RPG Gaming Market (2026-2032)
- New Zealand RPG Gaming Market (2026-2032)
- Netherlands RPG Gaming Market (2026-2032)
- Nauru RPG Gaming Market (2026-2032)
- Namibia RPG Gaming Market (2026-2032)
- Mozambique RPG Gaming Market (2026-2032)
- Montenegro RPG Gaming Market (2026-2032)
- Mongolia RPG Gaming Market (2026-2032)
- Monaco RPG Gaming Market (2026-2032)
- Micronesia RPG Gaming Market (2026-2032)
Industry Events and Analyst Meet

EV India Expo 2026

HIMTEX 2026

India Refining Summit 2026

India EV Show 2026

EV tech India Expo 2026
Whitepaper
- Middle East & Africa Commercial Security Market Click here to view more.
- Middle East & Africa Fire Safety Systems & Equipment Market Click here to view more.
- GCC Drone Market Click here to view more.
- Middle East Lighting Fixture Market Click here to view more.
- GCC Physical & Perimeter Security Market Click here to view more.