United Arab Emirates (UAE) Rubber Market (2026-2032) | Revenue, Size, Share, Growth, Trends, Analysis, Companies, Value, Outlook, Industry & Forecast
Market Forecast By Product Type (Natural Rubber, Synthetic Rubber), By End-users (Automotive & Transportation, Building & Construction, Industrial Machinery & Equipment, Others) And Competitive Landscape
| Product Code: ETC037821 | Publication Date: Aug 2023 | Updated Date: Jun 2026 | Product Type: Report | |
| Publisher: 6Wresearch | Author: Ravi Bhandari | No. of Pages: 70 | No. of Figures: 35 | No. of Tables: 5 |
United Arab Emirates (UAE) Rubber Market Summary
The united arab emirates (uae) rubber market was estimated at USD 324 Million in 2025 and is projected to reach USD 469 Million by 2032, growing at a CAGR of 6.1% from 2026 to 2032.
United Arab Emirates (UAE) Rubber Market Growth Rate Analysis (2021-2032)
The rubber market in the United Arab Emirates has experienced a robust growth pattern, with rates reaching 6.3% in 2021 and 6.6% in 2022. This upward trend is supported by increasing industrial demand, particularly in the automotive and construction sectors, alongside significant investments in infrastructure projects. As we move through 2023, the growth stabilizes at 6.0%, owing to a competitive landscape and heightened energy transition initiatives. Projections indicate a resurgence to 6.7% in 2024, driven by expanding consumer preferences for sustainable materials. By 2025, the growth is expected to maintain a steady pace of around 6.3%, reflecting a balanced demand-supply dynamic and ongoing digitalization efforts within the industry.
United Arab Emirates (UAE) Rubber Market Year-wise Growth Rate and Key Drivers
This graph highlights how the United Arab Emirates (UAE) Rubber Market has steadily grown over the past five years, supported by major growth factors.
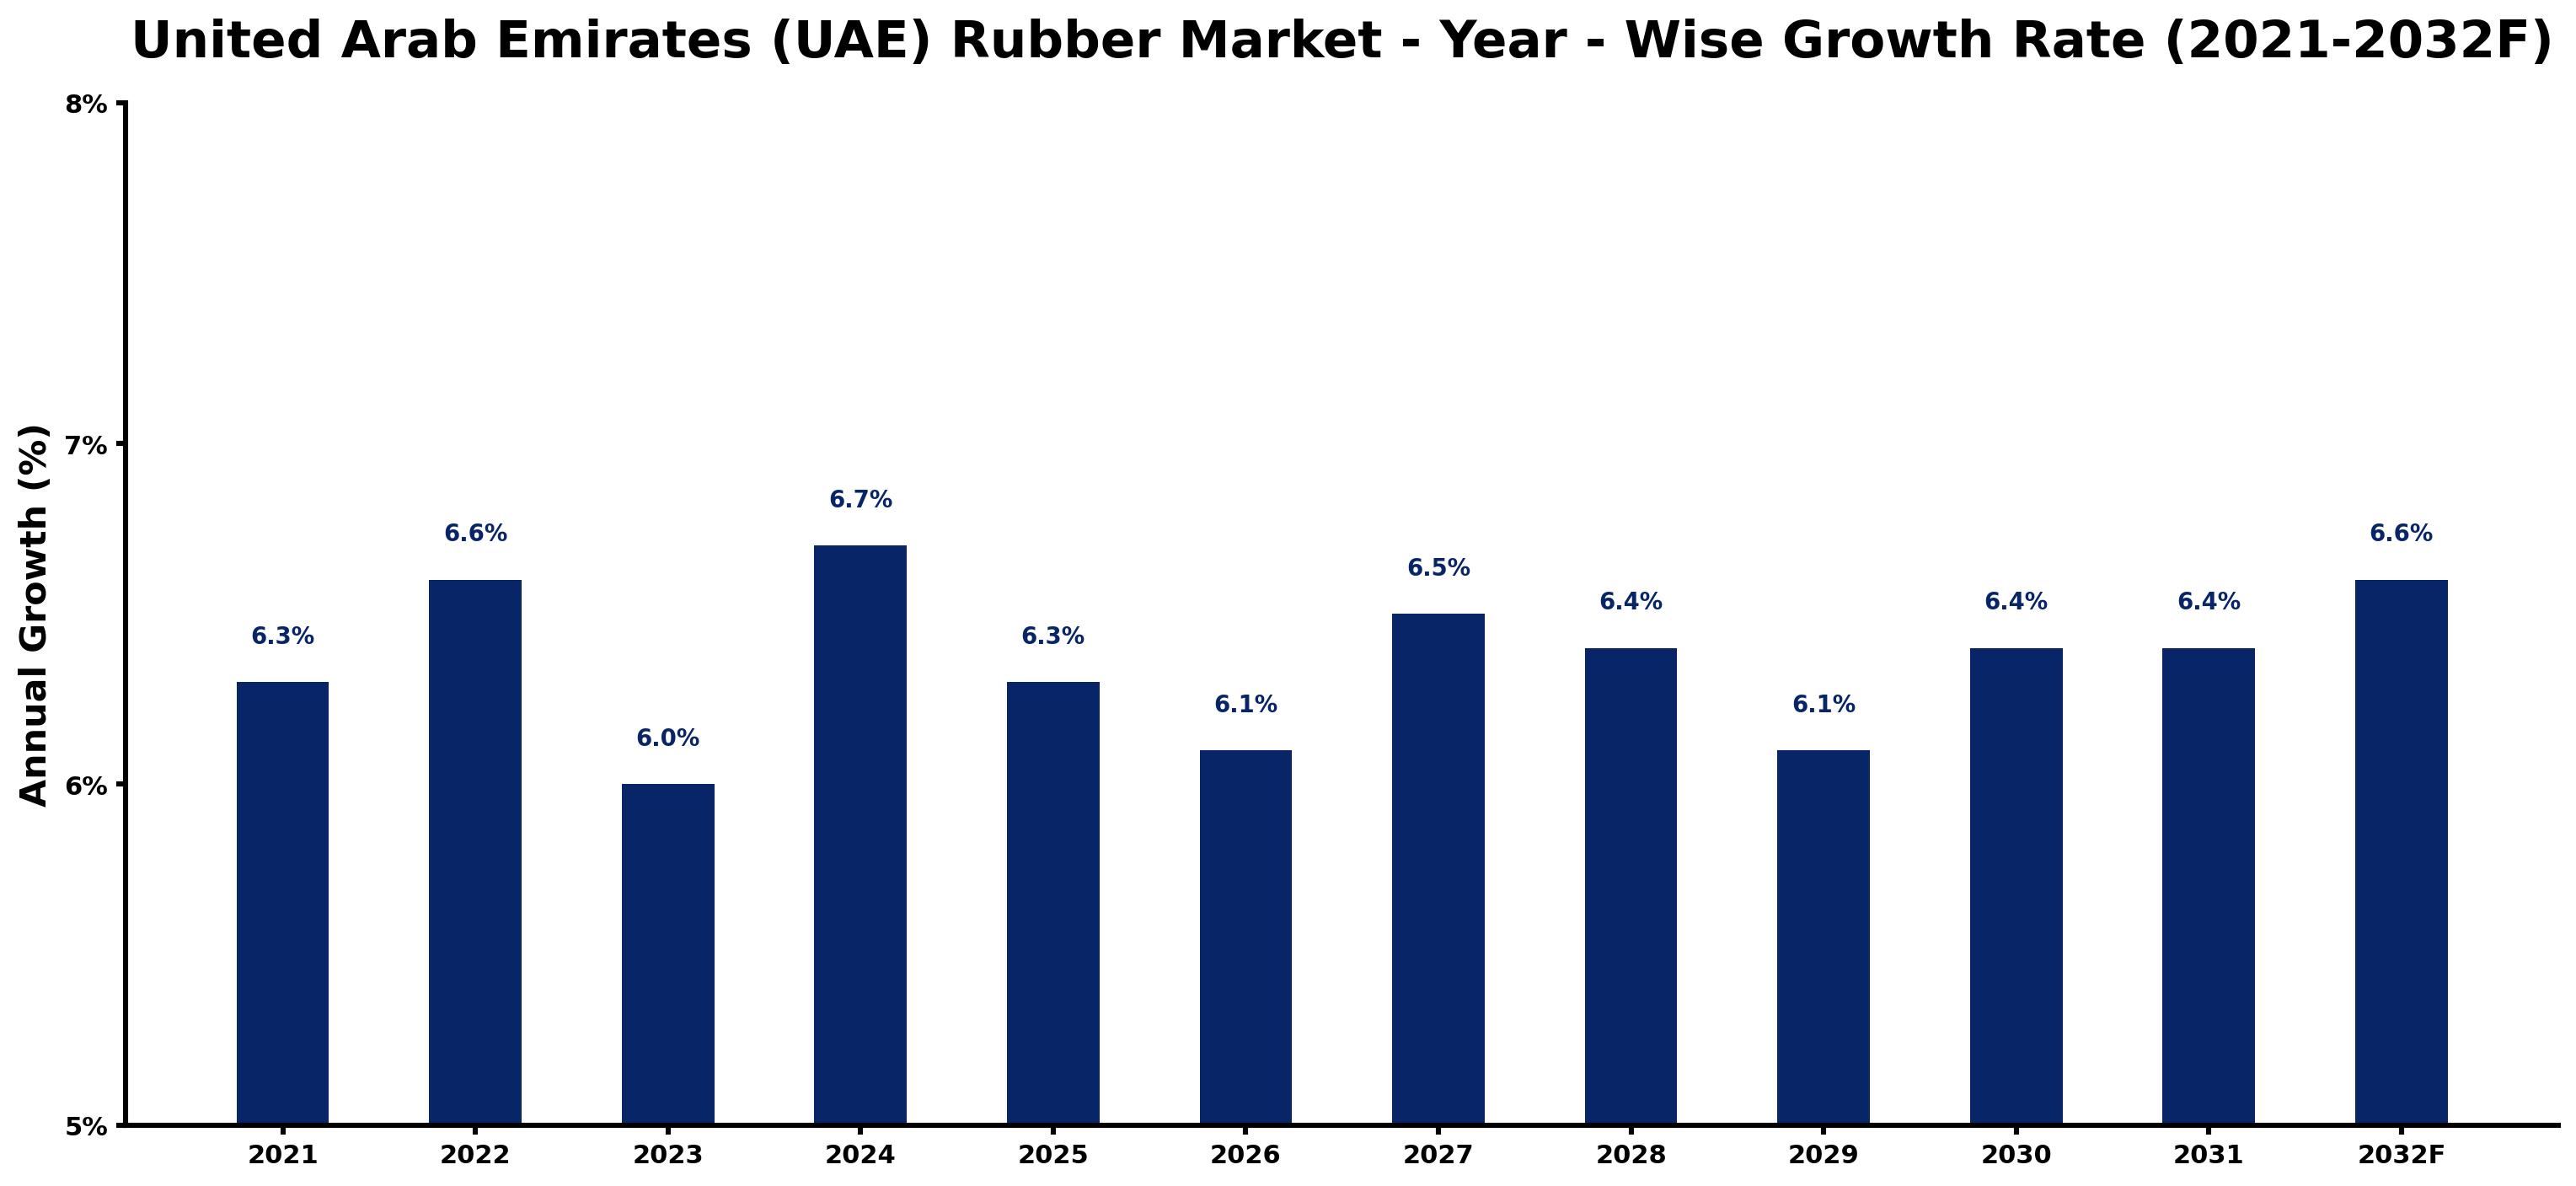
The table below presents the year wise growth rates along with the key drivers influencing the market
| Year | Growth Rate | Major Drivers |
| 2021 | 6.3% | The construction industry in UAE begins recovering, boosting rubber demand in projects. |
| 2022 | 6.6% | Emerging trends show increased utilization of eco-friendly rubber products in local markets. |
| 2023 | 6.0% | UAE's hot climate necessitates durable rubber materials for outdoor applications in construction. |
| 2024 | 6.7% | Expansion of logistics infrastructure increases demand for specialized rubberized materials and components. |
| 2025 | 6.3% | Corporate sustainability goals push companies towards sourcing recycled rubber materials effectively. |
| 2026 | 6.1% | Regional automotive manufacturing initiatives create opportunities for innovative rubber applications. |
| 2027 | 6.5% | Local startups focus on developing advanced rubber composites for performance-oriented industries. |
| 2028 | 6.4% | Increasing urbanization puts pressure on infrastructure, necessitating durable rubber solutions in construction. |
| 2029 | 6.1% | Technological advancements lead to enhanced rubber processing methods improving product quality. |
| 2030 | 6.4% | Shifts in consumer preferences heighten awareness for sustainable rubber product offerings. |
| 2031 | 6.4% | Export markets for UAE rubber products expand, driven by competitive pricing and quality. |
| 2032 | 6.6% | Cross-industry collaborations foster innovation, enhancing rubber applications in diverse sectors. |
Note - Market size estimations and growth projections presented in this report are based on 6Wresearch's advanced forecasting approach, validated with industry datasets as of June 2026.
United Arab Emirates (UAE) Rubber Market Synopsis
The United Arab Emirates (UAE) Rubber Market is projected to reach 6.1% and witness significant growth during the forecast period (2026-2032). As an integral segment of the UAE's industrial ecosystem, the rubber industry plays a pivotal role in supporting various sectors, including automotive, construction, electronics, and consumer goods. The robust economic growth, coupled with infrastructure advancements and increasing industrialization, is fueling the demand for rubber products across the emirates.
United Arab Emirates (UAE) Rubber Market Growth Drivers
The growth of the United Arab Emirates (UAE) Rubber Market is influenced by several dynamic factors that cater to its multifaceted applications.
- The ongoing construction boom in the UAE necessitates a vast array of rubber products, such as hoses, seals, and gaskets, vital for both structural integrity and operational efficiency in buildings and infrastructure.
- A significant factor in the market's expansion is the automotive industry's rapid development. Increasing per capita income and a rising population lead to higher vehicle ownership rates, driving up the demand for essential rubber components like tires and various automotive parts.
- The electronics sector is also contributing to market growth, as many electronic devices utilize rubber for insulation and damping, expanding the scope for innovative rubber applications.
- Additionally, the consumer goods segment is experiencing a surge in demand for rubber products, ranging from household items to consumer electronics, further propelling the market forward.
- Finally, the UAE's strategic location as a trade hub connects it to key global markets, enhancing rubber import opportunities and supporting local processing efforts.
United Arab Emirates (UAE) Rubber Market Challenges and Restraints
Despite the promising outlook for the United Arab Emirates (UAE) Rubber Market, several inherent challenges may impact growth trajectories.
- A primary challenge is the reliance on imported raw materials due to a lack of domestic natural rubber production. This dependence can lead to supply chain vulnerabilities and price volatility.
- Fluctuations in global rubber prices can significantly affect production costs for manufacturers, complicating pricing strategies and sustainability efforts.
- Manufacturers face increasing pressure to adopt environmentally friendly practices to mitigate waste management issues, which can require substantial investment and operational adjustments.
- The sector also must contend with intensifying competition, both locally and regionally, which may challenge profit margins and market share for established entities.
- Lastly, changing consumer preferences towards sustainable and eco-friendly products may necessitate innovation and adaptation from traditional rubber manufacturers.
United Arab Emirates (UAE) Rubber Market Government Investment and Initiatives
The UAE government continues to play a pivotal role in shaping the landscape of the rubber market through various strategic investments and initiatives.
- Government-backed infrastructure projects are enhancing the demand for rubber products, as comprehensive development plans prioritize modernization and expansion of the nation's facilities.
- Initiatives aimed at fostering innovation within the manufacturing sector are encouraging local firms to adopt advanced technologies and sustainable practices in rubber production.
- The UAE government is also focusing on diversifying its economy away from oil dependency, thus promoting the growth of the manufacturing sector, including rubber products.
- Policies supporting foreign direct investment are enhancing the capabilities of local firms and stimulating the establishment of new rubber processing facilities.
- Moreover, initiatives that emphasize research and development in materials technology are critical to ensuring that the UAE remains competitive in the global rubber market.
United Arab Emirates (UAE) Rubber Market Latest Developments (May 2025 - June 2026)
Recent developments in the United Arab Emirates (UAE) Rubber Market from May 2025 to June 2026 highlight the industry's adaptability and forward-looking trends.
- As the economy recovers post-Covid-19, there is a noticeable resurgence in demand from the automotive sector, particularly as production ramps up and consumer confidence grows.
- Innovative approaches towards sustainable production methods are being introduced, with several manufacturers exploring bio-based and recycled materials to align with growing environmental demands.
- Investment in R&D is on the rise, as firms aim to develop high-performance rubber products that cater to specialized applications in demanding industries.
- The UAE's emphasis on expanding its logistics and transport infrastructure is poised to enhance supply chain efficiencies, which may positively affect the rubber supply chain.
- Collaborative partnerships between local manufacturers and international entities are becoming increasingly common, aiming to leverage expertise and technology exchange within the rubber sector.
United Arab Emirates (UAE) Rubber Market - Key Attractiveness of the Report
- 10 Years of Market Numbers
- Historical Data Starting from 2022 to 2025
- Base Year: 2025
- Forecast Data until 2032
- Key Performance Indicators Impacting the Market
- Major Upcoming Developments and Projects
Key Highlights of the Report:
- United Arab Emirates (UAE) Rubber Market Outlook
- Market Size of United Arab Emirates (UAE) Rubber Market, 2025
- Forecast of United Arab Emirates (UAE) Rubber Market, 2032
- Historical Data and Forecast of United Arab Emirates (UAE) Rubber Revenues & Volume for the Period 2022-2032F
- United Arab Emirates (UAE) Rubber Market Trend Evolution
- United Arab Emirates (UAE) Rubber Market Drivers and Challenges
- United Arab Emirates (UAE) Rubber Price Trends
- United Arab Emirates (UAE) Rubber Porter's Five Forces
- United Arab Emirates (UAE) Rubber Industry Life Cycle
- Historical Data and Forecast of United Arab Emirates (UAE) Rubber Market Revenues & Volume By Product Type for the Period 2022-2032F
- Historical Data and Forecast of United Arab Emirates (UAE) Rubber Market Revenues & Volume By Natural Rubber for the Period 2022-2032F
- Historical Data and Forecast of United Arab Emirates (UAE) Rubber Market Revenues & Volume By Synthetic Rubber for the Period 2022-2032F
- Historical Data and Forecast of United Arab Emirates (UAE) Rubber Market Revenues & Volume By End-users for the Period 2022-2032F
- Historical Data and Forecast of United Arab Emirates (UAE) Rubber Market Revenues & Volume By Automotive & Transportation for the Period 2022-2032F
- Historical Data and Forecast of United Arab Emirates (UAE) Rubber Market Revenues & Volume By Building & Construction for the Period 2022-2032F
- Historical Data and Forecast of United Arab Emirates (UAE) Rubber Market Revenues & Volume By Industrial Machinery & Equipment for the Period 2022-2032F
- Historical Data and Forecast of United Arab Emirates (UAE) Rubber Market Revenues & Volume By Others for the Period 2022-2032F
- United Arab Emirates (UAE) Rubber Import Export Trade Statistics
- Market Opportunity Assessment By Product Type
- Market Opportunity Assessment By End-users
- United Arab Emirates (UAE) Rubber Top Companies Market Share
- United Arab Emirates (UAE) Rubber Competitive Benchmarking By Technical and Operational Parameters
- United Arab Emirates (UAE) Rubber Company Profiles
- United Arab Emirates (UAE) Rubber Key Strategic Recommendations
Frequently Asked Questions About the Market Study (FAQs):
The primary drivers include ongoing construction and infrastructure projects, the expansion of the automotive sector, and increasing demand from the electronics and consumer goods industries.
Import dependence exposes the market to price fluctuations and supply chain disruptions, which can adversely affect manufacturing costs and product availability.
Government policies focused on infrastructure development and economic diversification enhance the growth potential of the rubber market through strategic investments and innovative initiatives.
The market is increasingly adopting sustainable production methods and exploring alternative materials to address environmental concerns and enhance its global competitiveness.
6Wresearch actively monitors the United Arab Emirates (UAE) Rubber Market and publishes its comprehensive annual report, highlighting emerging trends, growth drivers, revenue analysis, and forecast outlook. Our insights help businesses to make data-backed strategic decisions with ongoing market dynamics. Our analysts track relevent industries related to the United Arab Emirates (UAE) Rubber Market, allowing our clients with actionable intelligence and reliable forecasts tailored to emerging regional needs.
Yes, we provide customisation as per your requirements. To learn more, feel free to contact us on sales@6wresearch.com
1 Executive Summary |
2 Introduction |
2.1 Key Highlights of the Report |
2.2 Report Description |
2.3 Market Scope & Segmentation |
2.4 Research Methodology |
2.5 Assumptions |
3 United Arab Emirates (UAE) Rubber Market Overview |
3.1 United Arab Emirates (UAE) Country Macro Economic Indicators |
3.2 United Arab Emirates (UAE) Rubber Market Revenues & Volume, 2022 & 2032F |
3.3 United Arab Emirates (UAE) Rubber Market - Industry Life Cycle |
3.4 United Arab Emirates (UAE) Rubber Market - Porter's Five Forces |
3.5 United Arab Emirates (UAE) Rubber Market Revenues & Volume Share, By Product Type, 2022 & 2032F |
3.6 United Arab Emirates (UAE) Rubber Market Revenues & Volume Share, By End-users, 2022 & 2032F |
4 United Arab Emirates (UAE) Rubber Market Dynamics |
4.1 Impact Analysis |
4.2 Market Drivers |
4.2.1 Growing construction sector in the UAE leading to increased demand for rubber products in infrastructure projects |
4.2.2 Expansion of automotive industry in the region driving the demand for rubber components |
4.2.3 Government initiatives promoting sustainable practices and encouraging the use of rubber-based products |
4.3 Market Restraints |
4.3.1 Fluctuating raw material prices impacting the production costs of rubber products |
4.3.2 Intense competition from imported rubber products affecting local manufacturers |
4.3.3 Economic uncertainties and geopolitical tensions affecting consumer spending and investment decisions |
5 United Arab Emirates (UAE) Rubber Market Trends |
6 United Arab Emirates (UAE) Rubber Market, By Types |
6.1 United Arab Emirates (UAE) Rubber Market, By Product Type |
6.1.1 Overview and Analysis |
6.1.2 United Arab Emirates (UAE) Rubber Market Revenues & Volume, By Product Type, 2022-2032F |
6.1.3 United Arab Emirates (UAE) Rubber Market Revenues & Volume, By Natural Rubber, 2022-2032F |
6.1.4 United Arab Emirates (UAE) Rubber Market Revenues & Volume, By Synthetic Rubber, 2022-2032F |
6.2 United Arab Emirates (UAE) Rubber Market, By End-users |
6.2.1 Overview and Analysis |
6.2.2 United Arab Emirates (UAE) Rubber Market Revenues & Volume, By Automotive & Transportation, 2022-2032F |
6.2.3 United Arab Emirates (UAE) Rubber Market Revenues & Volume, By Building & Construction, 2022-2032F |
6.2.4 United Arab Emirates (UAE) Rubber Market Revenues & Volume, By Industrial Machinery & Equipment, 2022-2032F |
6.2.5 United Arab Emirates (UAE) Rubber Market Revenues & Volume, By Others, 2022-2032F |
7 United Arab Emirates (UAE) Rubber Market Import-Export Trade Statistics |
7.1 United Arab Emirates (UAE) Rubber Market Export to Major Countries |
7.2 United Arab Emirates (UAE) Rubber Market Imports from Major Countries |
8 United Arab Emirates (UAE) Rubber Market Key Performance Indicators |
8.1 Environmental sustainability metrics such as carbon footprint reduction initiatives within rubber production processes |
8.2 Recycling rate of rubber materials used in manufacturing processes |
8.3 Innovation index reflecting the development of new rubber products or technologies in the market |
8.4 Percentage of government contracts awarded to local rubber manufacturers |
8.5 Consumer sentiment index towards rubber products and sustainable practices in the UAE |
9 United Arab Emirates (UAE) Rubber Market - Opportunity Assessment |
9.1 United Arab Emirates (UAE) Rubber Market Opportunity Assessment, By Product Type, 2022 & 2032F |
9.2 United Arab Emirates (UAE) Rubber Market Opportunity Assessment, By End-users, 2022 & 2032F |
10 United Arab Emirates (UAE) Rubber Market - Competitive Landscape |
10.1 United Arab Emirates (UAE) Rubber Market Revenue Share, By Companies, 2025 |
10.2 United Arab Emirates (UAE) Rubber Market Competitive Benchmarking, By Operating and Technical Parameters |
11 Company Profiles |
12 Recommendations |
13 Disclaimer |
Global Go To Market Strategy - 2030
Export potential enables firms to identify high-growth global markets with greater confidence by combining advanced trade intelligence with a structured quantitative methodology. The framework analyzes emerging demand trends and country-level import patterns while integrating macroeconomic and trade datasets such as GDP and population forecasts, bilateral import–export flows, tariff structures, elasticity differentials between developed and developing economies, geographic distance, and import demand projections. Using weighted trade values from 2020–2024 as the base period to project country-to-country export potential for 2030, these inputs are operationalized through calculated drivers such as gravity model parameters, tariff impact factors, and projected GDP per-capita growth. Through an analysis of hidden potentials, demand hotspots, and market conditions that are most favorable to success, this method enables firms to focus on target countries, maximize returns, and global expansion with data, backed by accuracy.
By factoring in the projected importer demand gap that is currently unmet and could be potential opportunity, it identifies the potential for the Exporter (Country) among 190 countries, against the general trade analysis, which identifies the biggest importer or exporter.
To discover high-growth global markets and optimize your business strategy:
Click Here
Pricing
- Single User License$ 1,995
- Department License$ 2,400
- Site License$ 3,120
- Global License$ 3,795

Leadership Perspectives from Industry Events
Search
Thought Leadership and Analyst Meet


Our Clients
6WResearch In News
- India Air Conditioner Market Set for Strong Rebound in 2026 After Weather-Led Correction and GST-Driven Recovery: 6Wresearch
- ADAS in India: How Automatic Emergency Braking, Blind Spot Detection & Driver Monitoring are Transforming Road Safety
- Doha a strategic location for EV manufacturing hub: IPA Qatar
- Demand for luxury TVs surging in the GCC, says Samsung
- Empowering Growth: The Thriving Journey of Bangladesh’s Cable Industry
- Demand for luxury TVs surging in the GCC, says Samsung
Latest Reports
- Nicaragua RPG Gaming Market (2026-2032)
- New Zealand RPG Gaming Market (2026-2032)
- Netherlands RPG Gaming Market (2026-2032)
- Nauru RPG Gaming Market (2026-2032)
- Namibia RPG Gaming Market (2026-2032)
- Mozambique RPG Gaming Market (2026-2032)
- Montenegro RPG Gaming Market (2026-2032)
- Mongolia RPG Gaming Market (2026-2032)
- Monaco RPG Gaming Market (2026-2032)
- Micronesia RPG Gaming Market (2026-2032)
Industry Events and Analyst Meet

HIMTEX 2026

India Refining Summit 2026

India EV Show 2026

EV tech India Expo 2026

Auto Tech Asia 2026
Whitepaper
- Middle East & Africa Commercial Security Market Click here to view more.
- Middle East & Africa Fire Safety Systems & Equipment Market Click here to view more.
- GCC Drone Market Click here to view more.
- Middle East Lighting Fixture Market Click here to view more.
- GCC Physical & Perimeter Security Market Click here to view more.