United Kingdom (UK) Pea Processed Ingredients Market (2026-2032) Outlook | Value, Forecast, Companies, Size, Industry, Analysis, Growth, Trends, Revenue & Share
Market Forecast By Type (Protein, Starch, Flour, Fiber), By Application (Food, Meat & Meat Substitutes, Performance Nutrition, Functional Foods, Snacks, Bakery, Confectionery, Others), By Source (Yellow Split Peas, Chickpeas, Lentils) And Competitive Landscape
| Product Code: ETC223509 | Publication Date: Aug 2022 | Updated Date: Jul 2026 | Product Type: Market Research Report | |
| Publisher: 6Wresearch | Author: Summon Dutta | No. of Pages: 75 | No. of Figures: 35 | No. of Tables: 20 |
United Kingdom (UK) Pea Processed Ingredients Market Size, Share & Growth Rate
The United Kingdom (UK) Pea Processed Ingredients Market was estimated at USD 188 Million in 2025 and is projected to reach USD 233 Million by 2032, growing at a CAGR of 3.1% from 2026 to 2032. This trajectory is propelled by an escalating consumer preference for plant-based proteins and the burgeoning trend toward healthier, sustainable food options. As dietary habits shift toward vegan and vegetarian lifestyles, the appeal of pea-derived ingredients is reinforced by their nutritional benefits and environmental sustainability.
United Kingdom (UK) Pea Processed Ingredients Market Year-wise Growth Rate and Key Drivers
This graph highlights how the United Kingdom (UK) Pea Processed Ingredients Market has steadily grown over the years, supported by major growth factors.
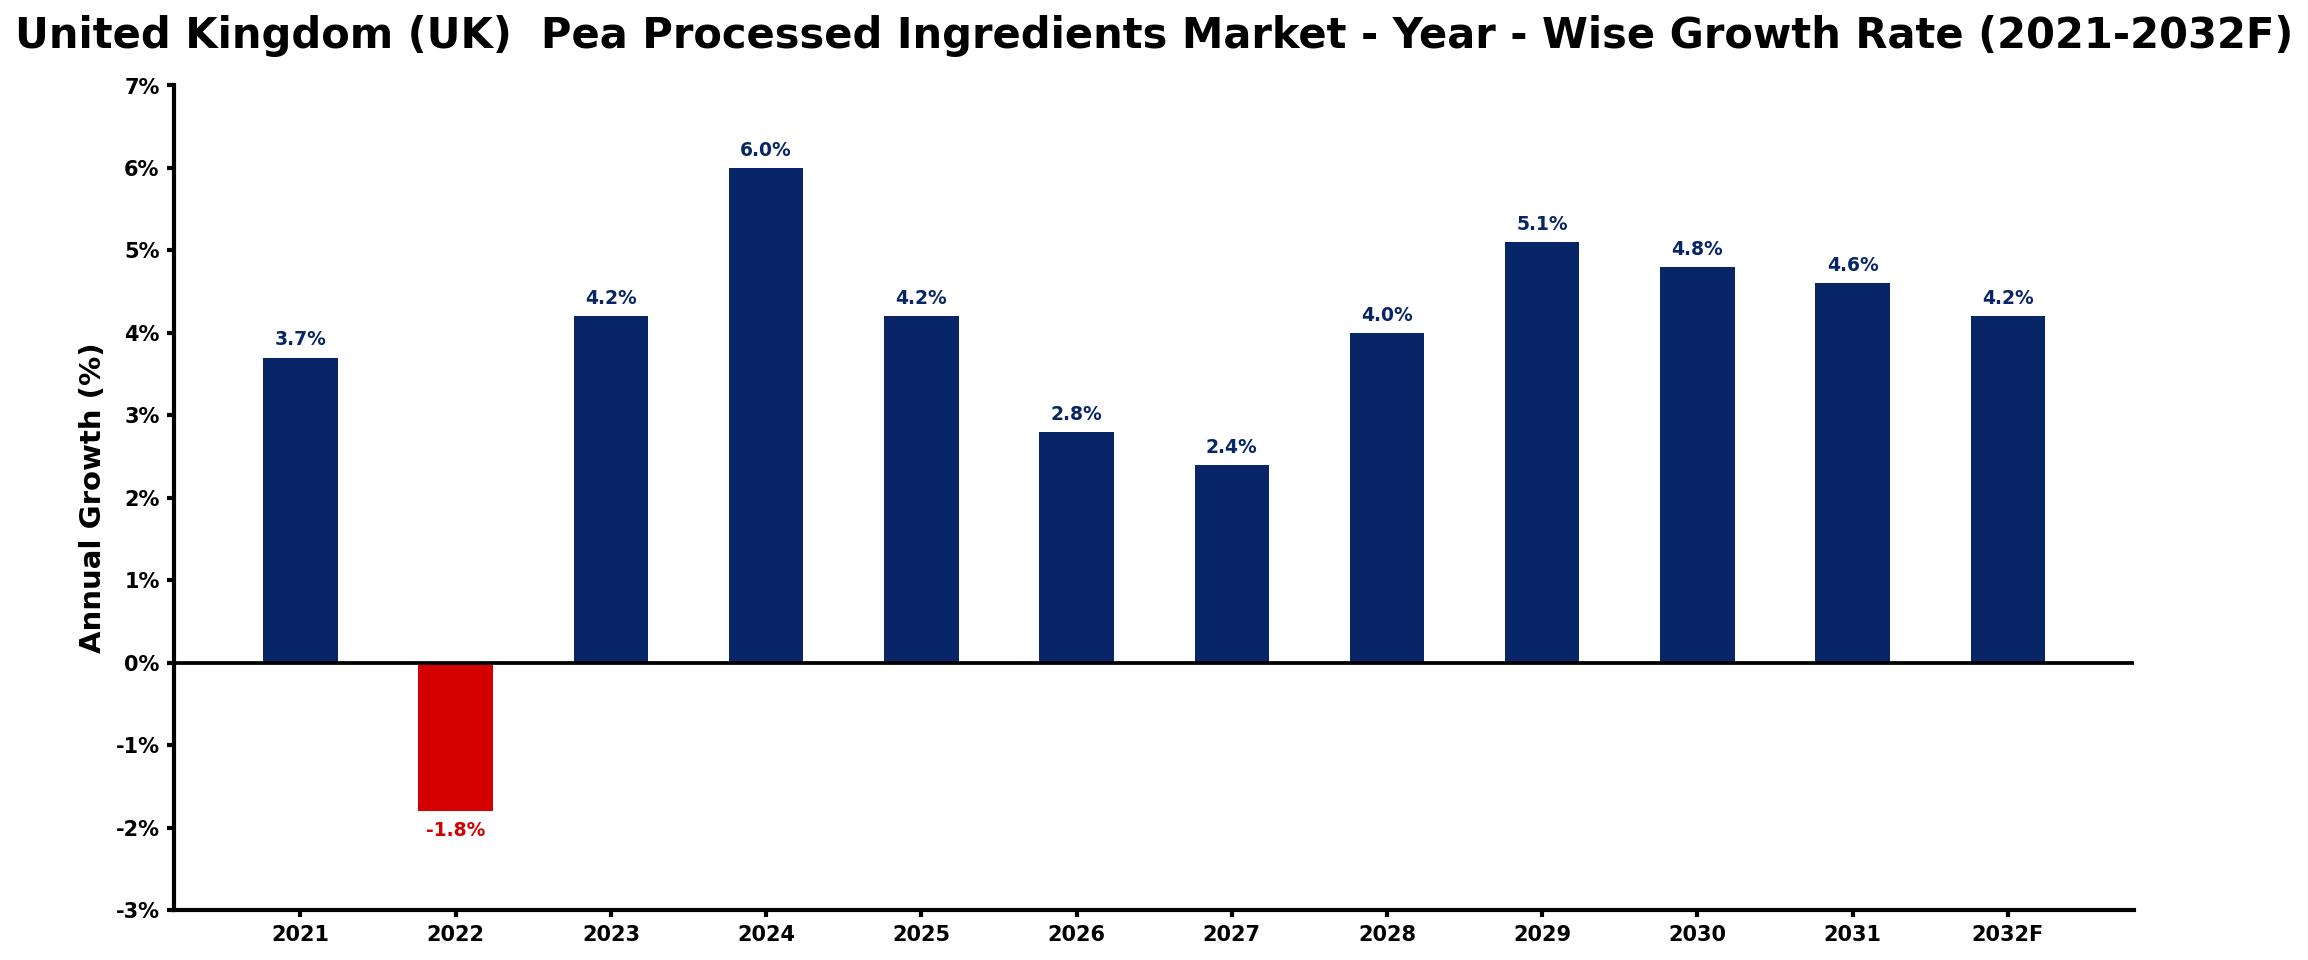
The table below presents the year‑wise growth rates along with the key drivers influencing the market
| Year | Growth Rate | Major Drivers |
| 2021 | 3.7% | Rising consumer health consciousness |
| 2022 | -1.8% | Fluctuating supply chain disruptions |
| 2023 | 4.2% | Increased plant-based product popularity |
| 2024 | 6.0% | Expansion of foodservice sector |
| 2025 | 4.2% | Growing demand for sustainable sourcing |
| 2026 | 2.8% | Innovations in food technology applications |
| 2027 | 2.4% | Strengthened retail partnerships emerging |
| 2028 | 4.0% | Higher investments in alternative proteins |
| 2029 | 5.1% | Surge in vegan dietary trends |
| 2030 | 4.8% | Enhanced product diversification strategies |
| 2031 | 4.6% | Boost in export market opportunities |
| 2032 | 4.2% | Development of new culinary applications |
Note: Market size estimations and growth projections presented in this report are based on 6Wresearch's proprietary forecasting methodology, utilizing the latest available industry data, government publications, and primary research inputs.
United Kingdom (UK) Pea Processed Ingredients Market Synopsis
A significant aspect of the UK Pea Processed Ingredients Market is the increasing utilization of pea protein and fiber in a variety of food applications, including bakery and snacks. This trend aligns with consumer demands for clean-label products that boast minimal processing and natural origins, establishing peas as an attractive ingredient.
Moreover, the market is witnessing robust growth in sectors such as plant-based meat alternatives and dairy substitutes, where the functional properties of pea ingredients are harnessed to create appealing, nutritious options for consumers. This momentum highlights the need for continued innovation and development within the market.
United Kingdom (UK) Pea Processed Ingredients Market Key Takeaways
- The growing popularity of vegan and vegetarian diets is driving demand for pea processed ingredients.
- Pea-derived products, such as protein and starch, are recognized for their nutritional and functional benefits.
- Innovation in product formulation is crucial for meeting consumer preferences for health-focused and natural ingredients.
- Sustainability concerns among consumers are increasing the appeal of pea-based ingredients.
- Investment opportunities are emerging in technology and production processes related to pea processing.
Evaluation of Restraints in United Kingdom (UK) Pea Processed Ingredients Market
Despite its growth prospects, the UK Pea Processed Ingredients Market faces several constraints. Fluctuating raw material costs pose a risk to manufacturers, who must navigate the unpredictability of agricultural outputs impacted by climatic conditions. Moreover, heightened competition has led to pricing pressures, necessitating differentiation strategies that can distinguish products in a crowded marketplace. Regulatory compliance related to food safety and labeling adds complexity to market entry and sustainability initiatives, which are becoming increasingly crucial as consumer awareness grows.
United Kingdom (UK) Pea Processed Ingredients Market Trends
Current trends in the UK Pea Processed Ingredients Market reflect a shift toward health and sustainability. Consumers are actively seeking non-GMO and environmentally friendly ingredients, contributing to the heightened demand for pea protein and flour. Additionally, the rise of e-commerce and food delivery services is reshaping how these ingredients are marketed and distributed, providing companies with new avenues to reach health-conscious consumers. The increasing focus on clean label products is pushing manufacturers to showcase the minimal processing involved in their pea-based offerings.
United Kingdom (UK) Pea Processed Ingredients Market Opportunities
There are notable growth opportunities within the UK Pea Processed Ingredients Market, particularly in the development of plant-based meat alternatives and dairy substitutes. Companies that invest in innovative technologies for extracting and processing pea ingredients stand to gain a competitive edge. Furthermore, as consumer awareness of the health benefits of peas continues to rise, tapping into markets such as snack foods and beverages will be vital. Strategic partnerships and collaborations can also enhance market penetration and broaden product offerings.
Government Initiatives in the United Kingdom (UK) Pea Processed Ingredients Market
UK government initiatives are increasingly aligned with promoting sustainable agricultural practices. Policies aimed at reducing food waste and greenhouse gas emissions are vital in supporting the growth of the pea processed ingredients sector. Additionally, there is a focus on providing incentives for research and development to foster innovation in the industry. These efforts are complemented by trade policies that facilitate exports of UK-produced pea ingredients to international markets, aiding economic development and enhancing the global competitiveness of local producers.
Future Insights of the United Kingdom (UK) Pea Processed Ingredients Market
Looking ahead to 2026-2032, the United Kingdom Pea Processed Ingredients Market is expected to thrive, fueled by an unwavering consumer shift toward plant-based diets and health-conscious choices. Innovations in product development will likely unlock new applications across various food sectors, paving the way for pea ingredients to become staples in healthier food formulations. As transparency and sustainability become more critical, the market will continue to expand, presenting lucrative opportunities for manufacturers who can adapt to these evolving consumer preferences.
United Kingdom (UK) Pea Processed Ingredients Market Latest Developments (2025 - 2026)
Recent developments in the UK Pea Processed Ingredients Market reflect a growing trend toward product diversification and innovation. Companies are focusing on enhancing the functionality and versatility of pea-based ingredients to cater to various dietary needs. Moreover, collaborations between food manufacturers and tech firms are emerging, aimed at improving processing technologies that optimize yield and quality. These trends illustrate a proactive approach to meet the escalating demand for plant-based solutions.
United Kingdom (UK) Pea Processed Ingredients Market - Key Attractiveness of the Report
- 10 Years of Market Numbers
- Historical Data Starting from 2022 to 2025
- Base Year: 2025
- Forecast Data until 2032
- Key Performance Indicators Impacting the Market
- Major Upcoming Developments and Projects
Key Highlights of the Report:
- United Kingdom (UK) Pea Processed Ingredients Market Outlook
- Market Size of United Kingdom (UK) Pea Processed Ingredients Market, 2025
- Forecast of United Kingdom (UK) Pea Processed Ingredients Market, 2032
- Historical Data and Forecast of United Kingdom (UK) Pea Processed Ingredients Revenues & Volume for the Period 2022-2032F
- United Kingdom (UK) Pea Processed Ingredients Market Trend Evolution
- United Kingdom (UK) Pea Processed Ingredients Market Drivers and Challenges
- United Kingdom (UK) Pea Processed Ingredients Price Trends
- United Kingdom (UK) Pea Processed Ingredients Porter's Five Forces
- United Kingdom (UK) Pea Processed Ingredients Industry Life Cycle
- Historical Data and Forecast of United Kingdom (UK) Pea Processed Ingredients Market Revenues & Volume By Type for the Period 2022-2032F
- Historical Data and Forecast of United Kingdom (UK) Pea Processed Ingredients Market Revenues & Volume By Protein for the Period 2022-2032F
- Historical Data and Forecast of United Kingdom (UK) Pea Processed Ingredients Market Revenues & Volume By Starch for the Period 2022-2032F
- Historical Data and Forecast of United Kingdom (UK) Pea Processed Ingredients Market Revenues & Volume By Flour for the Period 2022-2032F
- Historical Data and Forecast of United Kingdom (UK) Pea Processed Ingredients Market Revenues & Volume By Fiber for the Period 2022-2032F
- Historical Data and Forecast of United Kingdom (UK) Pea Processed Ingredients Market Revenues & Volume By Application for the Period 2022-2032F
- Historical Data and Forecast of United Kingdom (UK) Pea Processed Ingredients Market Revenues & Volume By Food for the Period 2022-2032F
- Historical Data and Forecast of United Kingdom (UK) Pea Processed Ingredients Market Revenues & Volume By Meat & Meat Substitutes for the Period 2022-2032F
- Historical Data and Forecast of United Kingdom (UK) Pea Processed Ingredients Market Revenues & Volume By Performance Nutrition for the Period 2022-2032F
- Historical Data and Forecast of United Kingdom (UK) Pea Processed Ingredients Market Revenues & Volume By Functional Foods for the Period 2022-2032F
- Historical Data and Forecast of United Kingdom (UK) Pea Processed Ingredients Market Revenues & Volume By Snacks for the Period 2022-2032F
- Historical Data and Forecast of United Kingdom (UK) Pea Processed Ingredients Market Revenues & Volume By Bakery for the Period 2022-2032F
- Historical Data and Forecast of United Kingdom (UK) Pea Processed Ingredients Market Revenues & Volume By Confectionery for the Period 2022-2032F
- Historical Data and Forecast of United Kingdom (UK) Pea Processed Ingredients Market Revenues & Volume By Others for the Period 2022-2032F
- Historical Data and Forecast of United Kingdom (UK) Pea Processed Ingredients Market Revenues & Volume By Source for the Period 2022-2032F
- Historical Data and Forecast of United Kingdom (UK) Pea Processed Ingredients Market Revenues & Volume By Yellow Split Peas for the Period 2022-2032F
- Historical Data and Forecast of United Kingdom (UK) Pea Processed Ingredients Market Revenues & Volume By Chickpeas for the Period 2022-2032F
- Historical Data and Forecast of United Kingdom (UK) Pea Processed Ingredients Market Revenues & Volume By Lentils for the Period 2022-2032F
- United Kingdom (UK) Pea Processed Ingredients Import Export Trade Statistics
- Market Opportunity Assessment By Type
- Market Opportunity Assessment By Application
- Market Opportunity Assessment By Source
- United Kingdom (UK) Pea Processed Ingredients Top Companies Market Share
- United Kingdom (UK) Pea Processed Ingredients Competitive Benchmarking By Technical and Operational Parameters
- United Kingdom (UK) Pea Processed Ingredients Company Profiles
- United Kingdom (UK) Pea Processed Ingredients Key Strategic Recommendations
Frequently Asked Questions About the Market Study (FAQs):
The market is expected to grow from USD 188 Million in 2025 to USD 233 Million by 2032, reflecting a CAGR of 3.1% during this period.
The increasing use of pea ingredients in plant-based meat alternatives and dairy substitutes, along with their incorporation in bakery and snack products, is a key driver of market demand.
Growing consumer awareness surrounding health and nutrition is steering demand toward pea-based products, as they are seen as healthier, high-protein alternatives to traditional ingredients.
Sustainability is becoming increasingly vital, with consumers favoring environmentally friendly and minimally processed food options, making pea ingredients a highly attractive choice.
Fluctuating raw material prices, intense market competition, and regulatory compliance represent some of the primary challenges companies must navigate to succeed in this evolving landscape.
6Wresearch actively monitors the United Kingdom (UK) Pea Processed Ingredients Market and publishes its comprehensive annual report, highlighting emerging trends, growth drivers, revenue analysis, and forecast outlook. Our insights help businesses to make data-backed strategic decisions with ongoing market dynamics. Our analysts track relevent industries related to the United Kingdom (UK) Pea Processed Ingredients Market, allowing our clients with actionable intelligence and reliable forecasts tailored to emerging regional needs.
Yes, we provide customisation as per your requirements. To learn more, feel free to contact us on sales@6wresearch.com
1 Executive Summary |
2 Introduction |
2.1 Key Highlights of the Report |
2.2 Report Description |
2.3 Market Scope & Segmentation |
2.4 Research Methodology |
2.5 Assumptions |
3 United Kingdom (UK) Pea Processed Ingredients Market Overview |
3.1 United Kingdom (UK) Country Macro Economic Indicators |
3.2 United Kingdom (UK) Pea Processed Ingredients Market Revenues & Volume, 2022 & 2032F |
3.3 United Kingdom (UK) Pea Processed Ingredients Market - Industry Life Cycle |
3.4 United Kingdom (UK) Pea Processed Ingredients Market - Porter's Five Forces |
3.5 United Kingdom (UK) Pea Processed Ingredients Market Revenues & Volume Share, By Type, 2022 & 2032F |
3.6 United Kingdom (UK) Pea Processed Ingredients Market Revenues & Volume Share, By Application, 2022 & 2032F |
3.7 United Kingdom (UK) Pea Processed Ingredients Market Revenues & Volume Share, By Source, 2022 & 2032F |
4 United Kingdom (UK) Pea Processed Ingredients Market Dynamics |
4.1 Impact Analysis |
4.2 Market Drivers |
4.2.1 Increasing consumer demand for plant-based protein sources |
4.2.2 Growing awareness about the health benefits of pea protein |
4.2.3 Rising trend of vegan and vegetarian diets in the UK |
4.3 Market Restraints |
4.3.1 Price volatility of pea as a commodity |
4.3.2 Intense competition from other plant-based protein sources |
4.3.3 Challenges in creating consumer awareness and acceptance of pea processed ingredients |
5 United Kingdom (UK) Pea Processed Ingredients Market Trends |
6 United Kingdom (UK) Pea Processed Ingredients Market, By Types |
6.1 United Kingdom (UK) Pea Processed Ingredients Market, By Type |
6.1.1 Overview and Analysis |
6.1.2 United Kingdom (UK) Pea Processed Ingredients Market Revenues & Volume, By Type, 2022-2032F |
6.1.3 United Kingdom (UK) Pea Processed Ingredients Market Revenues & Volume, By Protein, 2022-2032F |
6.1.4 United Kingdom (UK) Pea Processed Ingredients Market Revenues & Volume, By Starch, 2022-2032F |
6.1.5 United Kingdom (UK) Pea Processed Ingredients Market Revenues & Volume, By Flour, 2022-2032F |
6.1.6 United Kingdom (UK) Pea Processed Ingredients Market Revenues & Volume, By Fiber, 2022-2032F |
6.2 United Kingdom (UK) Pea Processed Ingredients Market, By Application |
6.2.1 Overview and Analysis |
6.2.2 United Kingdom (UK) Pea Processed Ingredients Market Revenues & Volume, By Food, 2022-2032F |
6.2.3 United Kingdom (UK) Pea Processed Ingredients Market Revenues & Volume, By Meat & Meat Substitutes, 2022-2032F |
6.2.4 United Kingdom (UK) Pea Processed Ingredients Market Revenues & Volume, By Performance Nutrition, 2022-2032F |
6.2.5 United Kingdom (UK) Pea Processed Ingredients Market Revenues & Volume, By Functional Foods, 2022-2032F |
6.2.6 United Kingdom (UK) Pea Processed Ingredients Market Revenues & Volume, By Snacks, 2022-2032F |
6.2.7 United Kingdom (UK) Pea Processed Ingredients Market Revenues & Volume, By Bakery, 2022-2032F |
6.2.8 United Kingdom (UK) Pea Processed Ingredients Market Revenues & Volume, By Others, 2022-2032F |
6.2.9 United Kingdom (UK) Pea Processed Ingredients Market Revenues & Volume, By Others, 2022-2032F |
6.3 United Kingdom (UK) Pea Processed Ingredients Market, By Source |
6.3.1 Overview and Analysis |
6.3.2 United Kingdom (UK) Pea Processed Ingredients Market Revenues & Volume, By Yellow Split Peas, 2022-2032F |
6.3.3 United Kingdom (UK) Pea Processed Ingredients Market Revenues & Volume, By Chickpeas, 2022-2032F |
6.3.4 United Kingdom (UK) Pea Processed Ingredients Market Revenues & Volume, By Lentils, 2022-2032F |
7 United Kingdom (UK) Pea Processed Ingredients Market Import-Export Trade Statistics |
7.1 United Kingdom (UK) Pea Processed Ingredients Market Export to Major Countries |
7.2 United Kingdom (UK) Pea Processed Ingredients Market Imports from Major Countries |
8 United Kingdom (UK) Pea Processed Ingredients Market Key Performance Indicators |
8.1 Number of new product launches featuring pea processed ingredients in the UK market |
8.2 Percentage increase in pea processing capacity in the UK |
8.3 Growth in the number of food manufacturers incorporating pea processed ingredients in their product portfolios |
9 United Kingdom (UK) Pea Processed Ingredients Market - Opportunity Assessment |
9.1 United Kingdom (UK) Pea Processed Ingredients Market Opportunity Assessment, By Type, 2022 & 2032F |
9.2 United Kingdom (UK) Pea Processed Ingredients Market Opportunity Assessment, By Application, 2022 & 2032F |
9.3 United Kingdom (UK) Pea Processed Ingredients Market Opportunity Assessment, By Source, 2022 & 2032F |
10 United Kingdom (UK) Pea Processed Ingredients Market - Competitive Landscape |
10.1 United Kingdom (UK) Pea Processed Ingredients Market Revenue Share, By Companies, 2025 |
10.2 United Kingdom (UK) Pea Processed Ingredients Market Competitive Benchmarking, By Operating and Technical Parameters |
11 Company Profiles |
12 Recommendations |
13 Disclaimer |
Global Go To Market Strategy - 2030
Export potential enables firms to identify high-growth global markets with greater confidence by combining advanced trade intelligence with a structured quantitative methodology. The framework analyzes emerging demand trends and country-level import patterns while integrating macroeconomic and trade datasets such as GDP and population forecasts, bilateral import–export flows, tariff structures, elasticity differentials between developed and developing economies, geographic distance, and import demand projections. Using weighted trade values from 2020–2024 as the base period to project country-to-country export potential for 2030, these inputs are operationalized through calculated drivers such as gravity model parameters, tariff impact factors, and projected GDP per-capita growth. Through an analysis of hidden potentials, demand hotspots, and market conditions that are most favorable to success, this method enables firms to focus on target countries, maximize returns, and global expansion with data, backed by accuracy.
By factoring in the projected importer demand gap that is currently unmet and could be potential opportunity, it identifies the potential for the Exporter (Country) among 190 countries, against the general trade analysis, which identifies the biggest importer or exporter.
To discover high-growth global markets and optimize your business strategy:
Click Here
Pricing
- Single User License$ 1,995
- Department License$ 2,400
- Site License$ 3,120
- Global License$ 3,795

Leadership Perspectives from Industry Events
Search
Thought Leadership and Analyst Meet


Our Clients
6WResearch In News
- India Air Conditioner Market Set for Strong Rebound in 2026 After Weather-Led Correction and GST-Driven Recovery: 6Wresearch
- ADAS in India: How Automatic Emergency Braking, Blind Spot Detection & Driver Monitoring are Transforming Road Safety
- Doha a strategic location for EV manufacturing hub: IPA Qatar
- Demand for luxury TVs surging in the GCC, says Samsung
- Empowering Growth: The Thriving Journey of Bangladesh’s Cable Industry
- Demand for luxury TVs surging in the GCC, says Samsung
Latest Reports
- Nicaragua RPG Gaming Market (2026-2032)
- New Zealand RPG Gaming Market (2026-2032)
- Netherlands RPG Gaming Market (2026-2032)
- Nauru RPG Gaming Market (2026-2032)
- Namibia RPG Gaming Market (2026-2032)
- Mozambique RPG Gaming Market (2026-2032)
- Montenegro RPG Gaming Market (2026-2032)
- Mongolia RPG Gaming Market (2026-2032)
- Monaco RPG Gaming Market (2026-2032)
- Micronesia RPG Gaming Market (2026-2032)
Industry Events and Analyst Meet

EV India Expo 2026

HIMTEX 2026

India Refining Summit 2026

India EV Show 2026

EV tech India Expo 2026
Whitepaper
- Middle East & Africa Commercial Security Market Click here to view more.
- Middle East & Africa Fire Safety Systems & Equipment Market Click here to view more.
- GCC Drone Market Click here to view more.
- Middle East Lighting Fixture Market Click here to view more.
- GCC Physical & Perimeter Security Market Click here to view more.