United Kingdom (UK) Smart Stadium Market (2026-2032) Outlook | Industry, Size, Trends, Growth, Value, Analysis, Revenue, Share, Companies & Forecast
Market Forecast By Component (Software, Service), By Deployment Type (On-Premise, Software-as-a-Service), By Platform (Application Management Platform, Device Management Platform, Network Management Platform) And Competitive Landscape
| Product Code: ETC106048 | Publication Date: Jun 2021 | Updated Date: Jun 2026 | Product Type: Report | |
| Publisher: 6Wresearch | Author: Sumit Sagar | No. of Pages: 70 | No. of Figures: 35 | No. of Tables: 5 |
United Kingdom (UK) Smart Stadium Market Size, Share & Growth Rate
The United Kingdom (UK) Smart Stadium Market was estimated at USD 336 Million in 2025 and is projected to reach USD 460 Million by 2032, growing at a CAGR of 4.6% from 2026 to 2032. This trajectory is primarily driven by the growing importance of technology in enhancing fan engagement and operational efficiencies within stadiums. The integration of IoT, AI, and advanced data analytics is transforming the way sports venues operate, facilitating personalized services and improved safety measures, which collectively heightens the appeal of smart stadiums for both operators and attendees.
United Kingdom (UK) Smart Stadium Market Year-wise Growth Rate and Key Drivers
This graph highlights how the United Kingdom (UK) Smart Stadium Market has steadily grown over the years, supported by major growth factors.
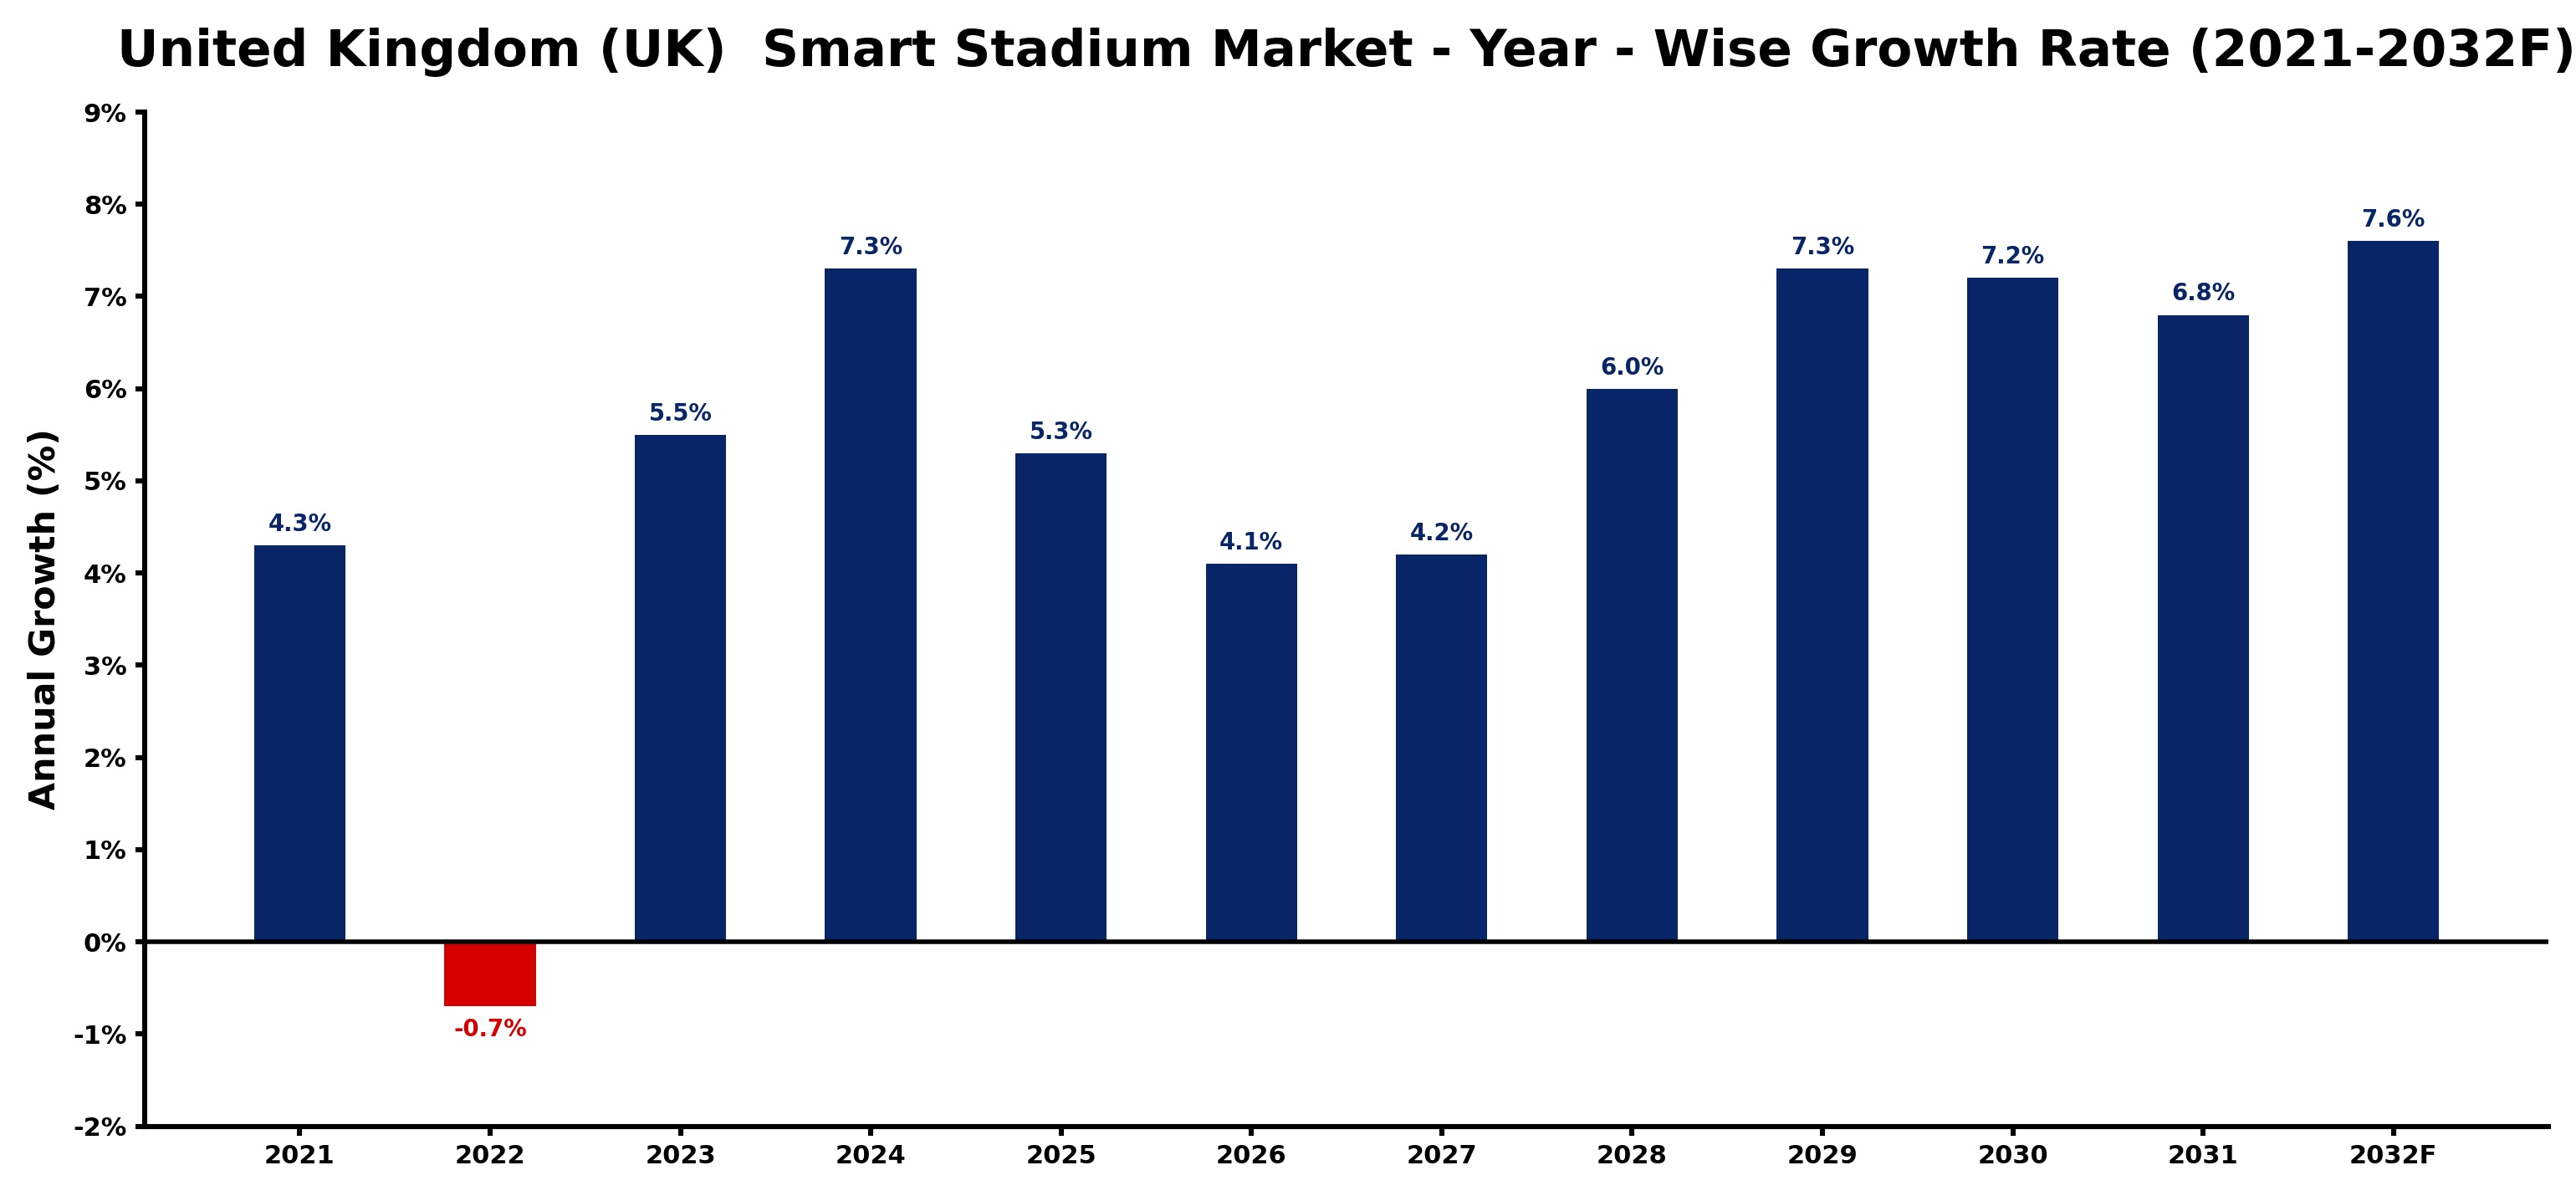
The table below presents the year‑wise growth rates along with the key drivers influencing the market
| Year | Growth Rate | Major Drivers |
| 2021 | 4.3% | Growing urbanization and commercial development |
| 2022 | -0.7% | Increasing smart city development projects |
| 2023 | 5.5% | Increasing smart city development projects |
| 2024 | 7.3% | Increasing adoption of advanced technologies |
| 2025 | 5.3% | Increasing adoption of advanced technologies |
| 2026 | 4.1% | Expansion of commercial construction activities |
| 2027 | 4.2% | Rising electricity demand across industries |
| 2028 | 6.0% | Increasing industrial infrastructure investments |
| 2029 | 7.3% | Increasing industrial infrastructure investments |
| 2030 | 7.2% | Expansion of transportation and logistics networks |
| 2031 | 6.8% | Government infrastructure modernization initiatives |
| 2032 | 7.6% | Rising electricity demand across industries |
Note - Market size estimations and growth projections presented in this report are based on 6Wresearch’s advanced forecasting approach, validated with industry datasets as of June 2026.
United Kingdom (UK) Smart Stadium Market Synopsis
With increasing expectations from tech-savvy fans, UK stadiums are rapidly adopting smart technologies such as high-speed internet and interactive displays. These enhancements not only improve the live event experience but also streamline operations, making venues more efficient and responsive to the needs of their users.
Furthermore, the demand for sustainable practices is pushing stadium operators to invest in energy-efficient solutions. The emphasis on environmentally friendly infrastructure is not only meeting regulatory requirements but also resonating with fans, who increasingly prioritize sustainability.
United Kingdom (UK) Smart Stadium Market Key Takeaways
- The market is driven by technological advancements aimed at enhancing the fan experience.
- Investment in IoT and mobile applications is shaping personalized fan engagement.
- Sustainability initiatives are gaining traction as stadiums strive for energy efficiency.
- High implementation costs and data security concerns remain significant challenges.
- Future growth is poised to come from continuous innovation and adaptation to digital trends.
Evaluation of Restraints in United Kingdom (UK) Smart Stadium Market
Despite the promising growth, the UK Smart Stadium Market faces several restraints. High costs associated with the implementation of advanced technologies can deter investment, especially among smaller venues. Data security and privacy are critical concerns as more personal information is collected through digital platforms. Additionally, the existing infrastructure in many stadiums poses integration challenges for new technology. The diverse stakeholder landscape also complicates decision-making processes, as varying interests must be reconciled to achieve unified technological adoption.
United Kingdom (UK) Smart Stadium Market Trends
Several key trends are shaping the future of the UK Smart Stadium Market. Firstly, the use of IoT devices for real-time data analytics is on the rise, enabling better decision-making and operational efficiency. Mobile applications are increasingly being integrated to enhance fan engagement, offering personalized experiences tailored to individual preferences. Digital signage and interactive displays are becoming standard, providing vital communication and marketing opportunities during events. Moreover, the push for high-speed Wi-Fi and 5G connectivity supports new features such as cashless transactions and augmented reality experiences, thereby elevating the overall stadium experience.
United Kingdom (UK) Smart Stadium Market Opportunities
The potential for growth within the UK Smart Stadium Market is significant. Opportunities lie particularly in the integration of IoT technology, advanced data analytics, and fan engagement platforms. As demand for enhanced experiences rises, investments in mobile ticketing solutions, digital signage, and crowd management systems are becoming attractive avenues for both technology providers and investors. Collaborations with sports teams and venue operators can further drive the development and implementation of cutting-edge technologies, thereby unlocking new revenue streams and improving fan engagement.
Government Initiatives in the United Kingdom (UK) Smart Stadium Market
The UK government has actively supported the evolution of Smart Stadiums through various initiatives. Policies aimed at promoting innovation within the sports industry, such as the Digital Economy Act and the Industrial Strategy Challenge Fund, have facilitated the adoption of smart technologies in stadiums. These policies not only foster economic growth but also emphasize sustainability, pushing for energy-efficient solutions and environmentally friendly practices in stadium development.
Future Insights of the United Kingdom (UK) Smart Stadium Market
Looking ahead to 2026-2032, the future of the United Kingdom Smart Stadium Market appears robust. The continued integration of technologies like IoT, AI, and data analytics will further revolutionize how sports events are experienced and managed. As fans seek more interactive and personalized experiences, stadiums will need to keep pace with technological advancements to maintain competitiveness. The emphasis on sustainability will continue to influence development practices, ensuring that UK stadiums are not only smart but also environmentally responsible.
United Kingdom (UK) Smart Stadium Market Latest Developments (May 2025 - June 2026)
Recent industry movements indicate a strong push towards integrating advanced technologies within stadium infrastructure. Developments include the rollout of high-speed connectivity solutions to enhance digital engagement for fans. Additionally, collaborations among technology vendors and sports organizations are creating new opportunities for innovative fan engagement strategies, setting the stage for a more dynamic and interactive viewing experience.
United Kingdom (UK) Smart Stadium Market - Key Attractiveness of the Report
- 10 Years of Market Numbers
- Historical Data Starting from 2022 to 2025
- Base Year: 2025
- Forecast Data until 2032
- Key Performance Indicators Impacting the Market
- Major Upcoming Developments and Projects
Key Highlights of the Report:
- United Kingdom (UK) Smart Stadium Market Outlook
- Market Size of United Kingdom (UK) Smart Stadium Market, 2025
- Forecast of United Kingdom (UK) Smart Stadium Market, 2032
- Historical Data and Forecast of United Kingdom (UK) Smart Stadium Revenues & Volume for the Period 2022-2032F
- United Kingdom (UK) Smart Stadium Market Trend Evolution
- United Kingdom (UK) Smart Stadium Market Drivers and Challenges
- United Kingdom (UK) Smart Stadium Price Trends
- United Kingdom (UK) Smart Stadium Porter's Five Forces
- United Kingdom (UK) Smart Stadium Industry Life Cycle
- Historical Data and Forecast of United Kingdom (UK) Smart Stadium Market Revenues & Volume By Component for the Period 2022-2032F
- Historical Data and Forecast of United Kingdom (UK) Smart Stadium Market Revenues & Volume By Software for the Period 2022-2032F
- Historical Data and Forecast of United Kingdom (UK) Smart Stadium Market Revenues & Volume By Service for the Period 2022-2032F
- Historical Data and Forecast of United Kingdom (UK) Smart Stadium Market Revenues & Volume By Deployment Type for the Period 2022-2032F
- Historical Data and Forecast of United Kingdom (UK) Smart Stadium Market Revenues & Volume By On-Premise for the Period 2022-2032F
- Historical Data and Forecast of United Kingdom (UK) Smart Stadium Market Revenues & Volume By Software-as-a-Service for the Period 2022-2032F
- Historical Data and Forecast of United Kingdom (UK) Smart Stadium Market Revenues & Volume By Platform for the Period 2022-2032F
- Historical Data and Forecast of United Kingdom (UK) Smart Stadium Market Revenues & Volume By Application Management Platform for the Period 2022-2032F
- Historical Data and Forecast of United Kingdom (UK) Smart Stadium Market Revenues & Volume By Device Management Platform for the Period 2022-2032F
- Historical Data and Forecast of United Kingdom (UK) Smart Stadium Market Revenues & Volume By Network Management Platform for the Period 2022-2032F
- United Kingdom (UK) Smart Stadium Import Export Trade Statistics
- Market Opportunity Assessment By Component
- Market Opportunity Assessment By Deployment Type
- Market Opportunity Assessment By Platform
- United Kingdom (UK) Smart Stadium Top Companies Market Share
- United Kingdom (UK) Smart Stadium Competitive Benchmarking By Technical and Operational Parameters
- United Kingdom (UK) Smart Stadium Company Profiles
- United Kingdom (UK) Smart Stadium Key Strategic Recommendations
United Kingdom (UK) Smart Stadium Market - Frequently Asked Questions
The growth is primarily fueled by technological advancements aimed at enhancing fan experiences and operational efficiencies. The increasing integration of IoT devices and AI into stadium infrastructure is pivotal.
The market is projected to reach USD 460 Million by 2032, showcasing a robust growth trajectory driven by investments in advanced technologies that cater to evolving fan expectations.
Significant challenges include high implementation costs, ensuring data security, and navigating the complexities of integrating new technologies into existing infrastructures.
Sustainability initiatives are becoming essential, as stadiums prioritize energy-efficient solutions and environmentally friendly practices, positively impacting their appeal and compliance with regulations.
Investment opportunities are abundant in the integration of IoT technology, data analytics, and personalized fan engagement solutions, particularly as the demand for enhanced experiences continues to rise.
6Wresearch actively monitors the United Kingdom (UK) Smart Stadium Market and publishes its comprehensive annual report, highlighting emerging trends, growth drivers, revenue analysis, and forecast outlook. Our insights help businesses to make data-backed strategic decisions with ongoing market dynamics. Our analysts track relevent industries related to the United Kingdom (UK) Smart Stadium Market, allowing our clients with actionable intelligence and reliable forecasts tailored to emerging regional needs.
Yes, we provide customisation as per your requirements. To learn more, feel free to contact us on sales@6wresearch.com
1 Executive Summary |
2 Introduction |
2.1 Key Highlights of the Report |
2.2 Report Description |
2.3 Market Scope & Segmentation |
2.4 Research Methodology |
2.5 Assumptions |
3 United Kingdom (UK) Smart Stadium Market Overview |
3.1 United Kingdom (UK) Country Macro Economic Indicators |
3.2 United Kingdom (UK) Smart Stadium Market Revenues & Volume, 2022 & 2032F |
3.3 United Kingdom (UK) Smart Stadium Market - Industry Life Cycle |
3.4 United Kingdom (UK) Smart Stadium Market - Porter's Five Forces |
3.5 United Kingdom (UK) Smart Stadium Market Revenues & Volume Share, By Component, 2022 & 2032F |
3.6 United Kingdom (UK) Smart Stadium Market Revenues & Volume Share, By Deployment Type, 2022 & 2032F |
3.7 United Kingdom (UK) Smart Stadium Market Revenues & Volume Share, By Platform, 2022 & 2032F |
4 United Kingdom (UK) Smart Stadium Market Dynamics |
4.1 Impact Analysis |
4.2 Market Drivers |
4.2.1 Increasing demand for enhanced fan engagement and entertainment experiences in sports events |
4.2.2 Growing adoption of IoT and smart technologies in stadium operations and management |
4.2.3 Emphasis on sustainability and energy efficiency in stadium infrastructure |
4.3 Market Restraints |
4.3.1 High initial investment costs for implementing smart stadium technologies |
4.3.2 Concerns regarding data security and privacy in smart stadium systems |
4.3.3 Limited availability of skilled professionals to manage and maintain smart stadium solutions |
5 United Kingdom (UK) Smart Stadium Market Trends |
6 United Kingdom (UK) Smart Stadium Market, By Types |
6.1 United Kingdom (UK) Smart Stadium Market, By Component |
6.1.1 Overview and Analysis |
6.1.2 United Kingdom (UK) Smart Stadium Market Revenues & Volume, By Component, 2022-2032F |
6.1.3 United Kingdom (UK) Smart Stadium Market Revenues & Volume, By Software, 2022-2032F |
6.1.4 United Kingdom (UK) Smart Stadium Market Revenues & Volume, By Service, 2022-2032F |
6.2 United Kingdom (UK) Smart Stadium Market, By Deployment Type |
6.2.1 Overview and Analysis |
6.2.2 United Kingdom (UK) Smart Stadium Market Revenues & Volume, By On-Premise, 2022-2032F |
6.2.3 United Kingdom (UK) Smart Stadium Market Revenues & Volume, By Software-as-a-Service, 2022-2032F |
6.3 United Kingdom (UK) Smart Stadium Market, By Platform |
6.3.1 Overview and Analysis |
6.3.2 United Kingdom (UK) Smart Stadium Market Revenues & Volume, By Application Management Platform, 2022-2032F |
6.3.3 United Kingdom (UK) Smart Stadium Market Revenues & Volume, By Device Management Platform, 2022-2032F |
6.3.4 United Kingdom (UK) Smart Stadium Market Revenues & Volume, By Network Management Platform, 2022-2032F |
7 United Kingdom (UK) Smart Stadium Market Import-Export Trade Statistics |
7.1 United Kingdom (UK) Smart Stadium Market Export to Major Countries |
7.2 United Kingdom (UK) Smart Stadium Market Imports from Major Countries |
8 United Kingdom (UK) Smart Stadium Market Key Performance Indicators |
8.1 Energy consumption reduction percentage in smart stadiums |
8.2 Improvement in fan satisfaction scores after implementing smart stadium technologies |
8.3 Increase in revenue from personalized fan experiences offered through smart stadium solutions |
9 United Kingdom (UK) Smart Stadium Market - Opportunity Assessment |
9.1 United Kingdom (UK) Smart Stadium Market Opportunity Assessment, By Component, 2022 & 2032F |
9.2 United Kingdom (UK) Smart Stadium Market Opportunity Assessment, By Deployment Type, 2022 & 2032F |
9.3 United Kingdom (UK) Smart Stadium Market Opportunity Assessment, By Platform, 2022 & 2032F |
10 United Kingdom (UK) Smart Stadium Market - Competitive Landscape |
10.1 United Kingdom (UK) Smart Stadium Market Revenue Share, By Companies, 2025 |
10.2 United Kingdom (UK) Smart Stadium Market Competitive Benchmarking, By Operating and Technical Parameters |
11 Company Profiles |
12 Recommendations |
13 Disclaimer |
Global Go To Market Strategy - 2030
Export potential enables firms to identify high-growth global markets with greater confidence by combining advanced trade intelligence with a structured quantitative methodology. The framework analyzes emerging demand trends and country-level import patterns while integrating macroeconomic and trade datasets such as GDP and population forecasts, bilateral import–export flows, tariff structures, elasticity differentials between developed and developing economies, geographic distance, and import demand projections. Using weighted trade values from 2020–2024 as the base period to project country-to-country export potential for 2030, these inputs are operationalized through calculated drivers such as gravity model parameters, tariff impact factors, and projected GDP per-capita growth. Through an analysis of hidden potentials, demand hotspots, and market conditions that are most favorable to success, this method enables firms to focus on target countries, maximize returns, and global expansion with data, backed by accuracy.
By factoring in the projected importer demand gap that is currently unmet and could be potential opportunity, it identifies the potential for the Exporter (Country) among 190 countries, against the general trade analysis, which identifies the biggest importer or exporter.
To discover high-growth global markets and optimize your business strategy:
Click Here
Pricing
- Single User License$ 1,995
- Department License$ 2,400
- Site License$ 3,120
- Global License$ 3,795

Leadership Perspectives from Industry Events
Search
Thought Leadership and Analyst Meet


Our Clients
6WResearch In News
- India Air Conditioner Market Set for Strong Rebound in 2026 After Weather-Led Correction and GST-Driven Recovery: 6Wresearch
- ADAS in India: How Automatic Emergency Braking, Blind Spot Detection & Driver Monitoring are Transforming Road Safety
- Doha a strategic location for EV manufacturing hub: IPA Qatar
- Demand for luxury TVs surging in the GCC, says Samsung
- Empowering Growth: The Thriving Journey of Bangladesh’s Cable Industry
- Demand for luxury TVs surging in the GCC, says Samsung
Latest Reports
- Nicaragua RPG Gaming Market (2026-2032)
- New Zealand RPG Gaming Market (2026-2032)
- Netherlands RPG Gaming Market (2026-2032)
- Nauru RPG Gaming Market (2026-2032)
- Namibia RPG Gaming Market (2026-2032)
- Mozambique RPG Gaming Market (2026-2032)
- Montenegro RPG Gaming Market (2026-2032)
- Mongolia RPG Gaming Market (2026-2032)
- Monaco RPG Gaming Market (2026-2032)
- Micronesia RPG Gaming Market (2026-2032)
Industry Events and Analyst Meet

EV India Expo 2026

HIMTEX 2026

India Refining Summit 2026

India EV Show 2026

EV tech India Expo 2026
Whitepaper
- Middle East & Africa Commercial Security Market Click here to view more.
- Middle East & Africa Fire Safety Systems & Equipment Market Click here to view more.
- GCC Drone Market Click here to view more.
- Middle East Lighting Fixture Market Click here to view more.
- GCC Physical & Perimeter Security Market Click here to view more.