United States (US) Activated Carbon for Mercury Control Market (2025-2031) Outlook | Revenue, Analysis, Value, Industry, Share, Companies, Trends, Growth, Size & Forecast
Market Forecast By Application (Coal Burning, Gold Mining, Cement Production, Ferrous & Non-Ferrous Metals, Oil & Gas Burning, Oil Refining , Others) And Competitive Landscape
| Product Code: ETC4484582 | Publication Date: Jul 2023 | Updated Date: Nov 2025 | Product Type: Report | |
| Publisher: 6Wresearch | Author: Shubham Deep | No. of Pages: 85 | No. of Figures: 45 | No. of Tables: 25 |
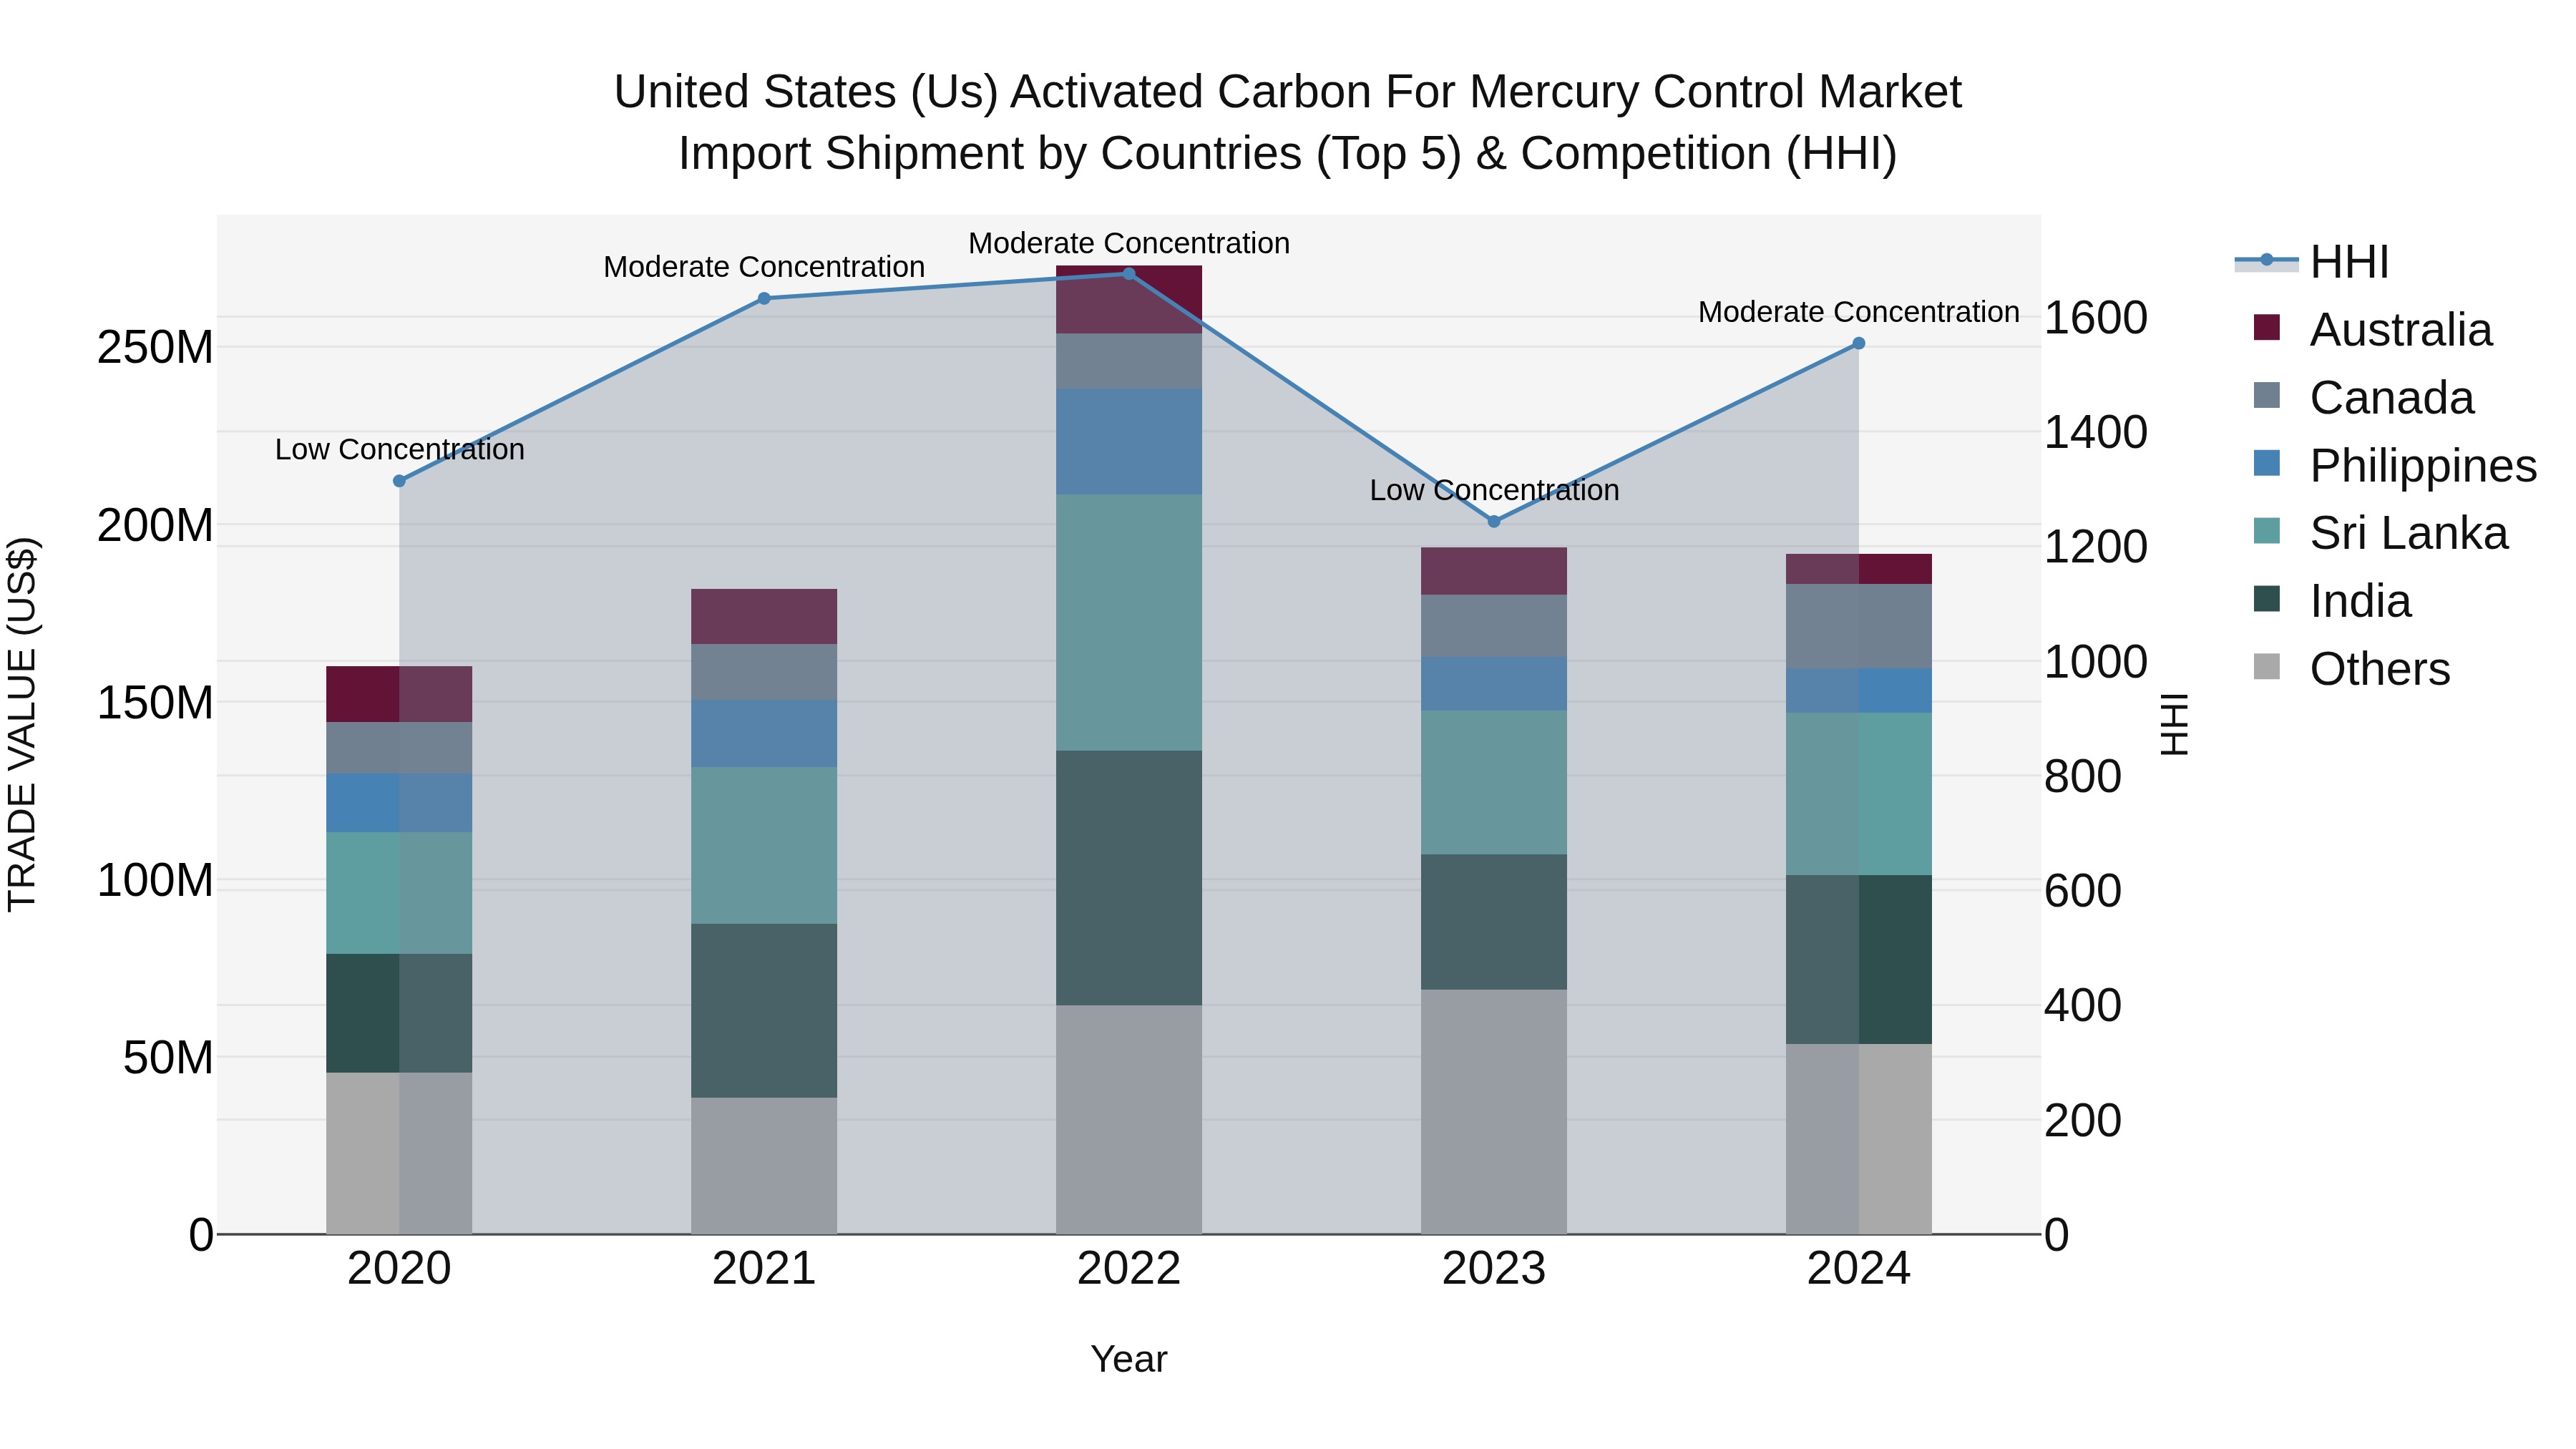
United States (US) Activated Carbon for Mercury Control Market Top 5 Importing Countries and Market Competition (HHI) Analysis
In 2024, the United States saw an increase in activated carbon imports for mercury control, with top exporters being India, Sri Lanka, Canada, China, and Japan. The Herfindahl-Hirschman Index (HHI) reflected a shift from low to moderate concentration, indicating a more diverse market landscape. The compound annual growth rate (CAGR) from 2020 to 2024 was 4.64%, showcasing steady growth. However, there was a slight decline in the growth rate from 2023 to 2024 at -0.95%, suggesting a potential stabilization or adjustment in the market dynamics for activated carbon imports in the U.S.
United States (US) Activated Carbon for Mercury Control Market Overview
The United States Activated Carbon for Mercury Control Market is experiencing growth driven by stringent environmental regulations and increasing awareness regarding mercury emissions from various industries such as coal-fired power plants, cement production, and industrial boilers. Activated carbon is utilized in mercury control technologies due to its high adsorption capacity and efficiency in capturing mercury emissions. The market is characterized by the presence of key players offering a wide range of activated carbon products specifically designed for mercury control applications. Rising investments in research and development activities to enhance the performance of activated carbon products for mercury control, coupled with the increasing adoption of clean energy technologies, are expected to further boost market growth in the US. Additionally, the market is witnessing a shift towards sustainable and eco-friendly solutions, driving demand for activated carbon in mercury control applications.
United States (US) Activated Carbon for Mercury Control Market Trends and Opportunities
The US Activated Carbon for Mercury Control Market is witnessing a growing demand driven by stringent environmental regulations aimed at reducing mercury emissions from industrial processes, power plants, and waste incineration facilities. The market is experiencing a shift towards more sustainable and effective mercury control technologies, with activated carbon emerging as a preferred option due to its high adsorption capacity and cost-effectiveness. Key opportunities in the market include the development of advanced activated carbon products tailored for specific applications, increasing investments in research and development to enhance mercury removal efficiency, and collaborations between industry players to expand market reach. Additionally, the ongoing focus on cleaner energy sources and the rising awareness about the health and environmental impacts of mercury pollution present promising prospects for growth in the US Activated Carbon for Mercury Control Market.
United States (US) Activated Carbon for Mercury Control Market Challenges
In the US Activated Carbon for Mercury Control Market, challenges primarily revolve around regulatory uncertainties, technological advancements, and competition. Regulatory uncertainties stem from the changing landscape of environmental policies, which can impact the demand for activated carbon solutions. Additionally, the need for continuous technological advancements to improve the efficiency and cost-effectiveness of activated carbon products poses a challenge for market players. Moreover, the presence of competitive alternatives for mercury control, such as other sorbents or emission control technologies, adds pressure on activated carbon suppliers to differentiate their offerings. Overall, navigating these challenges requires companies to stay abreast of regulatory developments, invest in research and development, and effectively communicate the benefits of activated carbon solutions to potential customers in the US market.
United States (US) Activated Carbon for Mercury Control Market Drivers
The United States Activated Carbon for Mercury Control market is primarily driven by stringent environmental regulations aimed at reducing mercury emissions from various industries, particularly power plants. The Mercury and Air Toxics Standards (MATS) regulation by the Environmental Protection Agency (EPA) has mandated the use of activated carbon injection systems to capture and control mercury emissions. Additionally, the increasing awareness among industries regarding the harmful effects of mercury on human health and the environment is further driving the demand for activated carbon solutions for mercury control. The growing focus on sustainable practices and corporate social responsibility initiatives also play a significant role in the adoption of activated carbon technologies for mercury control in the US market.
United States (US) Activated Carbon for Mercury Control Market Government Policy
The US government has implemented regulations to control mercury emissions, driving the demand for activated carbon in mercury control applications. The Environmental Protection Agency (EPA) has established the Mercury and Air Toxics Standards (MATS) rule, which requires coal-fired power plants to limit mercury emissions. This has led to an increased adoption of activated carbon injection systems for mercury control in these facilities. Furthermore, the Clean Air Act mandates regular monitoring and reporting of mercury emissions, further emphasizing the importance of utilizing activated carbon technologies for compliance. The US government`s focus on reducing mercury pollution aligns with the growth prospects of the activated carbon market for mercury control applications in the country.
United States (US) Activated Carbon for Mercury Control Market Future Outlook
The United States Activated Carbon for Mercury Control Market is projected to experience steady growth in the coming years due to increasing regulations on emissions and a growing focus on environmental protection. The market is expected to be driven by the need for effective mercury removal solutions in industries such as coal-fired power plants, cement production, and waste incineration. Additionally, advancements in technology and research are likely to lead to the development of more efficient and cost-effective activated carbon solutions for mercury control. With a rising awareness of the harmful effects of mercury pollution on human health and the environment, the demand for activated carbon for mercury control is anticipated to rise, presenting opportunities for market expansion and innovation in the US.
Key Highlights of the Report:
- United States (US) Activated Carbon for Mercury Control Market Outlook
- Market Size of United States (US) Activated Carbon for Mercury Control Market, 2024
- Forecast of United States (US) Activated Carbon for Mercury Control Market, 2031
- Historical Data and Forecast of United States (US) Activated Carbon for Mercury Control Revenues & Volume for the Period 2021 - 2031
- United States (US) Activated Carbon for Mercury Control Market Trend Evolution
- United States (US) Activated Carbon for Mercury Control Market Drivers and Challenges
- United States (US) Activated Carbon for Mercury Control Price Trends
- United States (US) Activated Carbon for Mercury Control Porter's Five Forces
- United States (US) Activated Carbon for Mercury Control Industry Life Cycle
- Historical Data and Forecast of United States (US) Activated Carbon for Mercury Control Market Revenues & Volume By Application for the Period 2021 - 2031
- Historical Data and Forecast of United States (US) Activated Carbon for Mercury Control Market Revenues & Volume By Coal Burning for the Period 2021 - 2031
- Historical Data and Forecast of United States (US) Activated Carbon for Mercury Control Market Revenues & Volume By Gold Mining for the Period 2021 - 2031
- Historical Data and Forecast of United States (US) Activated Carbon for Mercury Control Market Revenues & Volume By Cement Production for the Period 2021 - 2031
- Historical Data and Forecast of United States (US) Activated Carbon for Mercury Control Market Revenues & Volume By Ferrous & Non-Ferrous Metals for the Period 2021 - 2031
- Historical Data and Forecast of United States (US) Activated Carbon for Mercury Control Market Revenues & Volume By Oil & Gas Burning for the Period 2021 - 2031
- Historical Data and Forecast of United States (US) Activated Carbon for Mercury Control Market Revenues & Volume By Oil Refining for the Period 2021 - 2031
- Historical Data and Forecast of United States (US) Activated Carbon for Mercury Control Market Revenues & Volume By Others for the Period 2021 - 2031
- United States (US) Activated Carbon for Mercury Control Import Export Trade Statistics
- Market Opportunity Assessment By Application
- United States (US) Activated Carbon for Mercury Control Top Companies Market Share
- United States (US) Activated Carbon for Mercury Control Competitive Benchmarking By Technical and Operational Parameters
- United States (US) Activated Carbon for Mercury Control Company Profiles
- United States (US) Activated Carbon for Mercury Control Key Strategic Recommendations
Frequently Asked Questions About the Market Study (FAQs):
6Wresearch actively monitors the United States (US) Activated Carbon for Mercury Control Market and publishes its comprehensive annual report, highlighting emerging trends, growth drivers, revenue analysis, and forecast outlook. Our insights help businesses to make data-backed strategic decisions with ongoing market dynamics. Our analysts track relevent industries related to the United States (US) Activated Carbon for Mercury Control Market, allowing our clients with actionable intelligence and reliable forecasts tailored to emerging regional needs.
Yes, we provide customisation as per your requirements. To learn more, feel free to contact us on sales@6wresearch.com
1 Executive Summary |
2 Introduction |
2.1 Key Highlights of the Report |
2.2 Report Description |
2.3 Market Scope & Segmentation |
2.4 Research Methodology |
2.5 Assumptions |
3 United States (US) Activated Carbon for Mercury Control Market Overview |
3.1 United States (US) Country Macro Economic Indicators |
3.2 United States (US) Activated Carbon for Mercury Control Market Revenues & Volume, 2021 & 2031F |
3.3 United States (US) Activated Carbon for Mercury Control Market - Industry Life Cycle |
3.4 United States (US) Activated Carbon for Mercury Control Market - Porter's Five Forces |
3.5 United States (US) Activated Carbon for Mercury Control Market Revenues & Volume Share, By Application, 2021 & 2031F |
4 United States (US) Activated Carbon for Mercury Control Market Dynamics |
4.1 Impact Analysis |
4.2 Market Drivers |
4.2.1 Increasing environmental regulations and stringent emission standards for mercury control in the United States |
4.2.2 Growing awareness about the harmful effects of mercury emissions on human health and the environment |
4.2.3 Rising demand for cleaner air and water, driving the adoption of activated carbon for mercury control |
4.3 Market Restraints |
4.3.1 High initial investment and operational costs associated with activated carbon mercury control technologies |
4.3.2 Competition from alternative mercury control technologies such as flue gas desulfurization and scrubbers |
5 United States (US) Activated Carbon for Mercury Control Market Trends |
6 United States (US) Activated Carbon for Mercury Control Market, By Types |
6.1 United States (US) Activated Carbon for Mercury Control Market, By Application |
6.1.1 Overview and Analysis |
6.1.2 United States (US) Activated Carbon for Mercury Control Market Revenues & Volume, By Application, 2021 - 2031F |
6.1.3 United States (US) Activated Carbon for Mercury Control Market Revenues & Volume, By Coal Burning, 2021 - 2031F |
6.1.4 United States (US) Activated Carbon for Mercury Control Market Revenues & Volume, By Gold Mining, 2021 - 2031F |
6.1.5 United States (US) Activated Carbon for Mercury Control Market Revenues & Volume, By Cement Production, 2021 - 2031F |
6.1.6 United States (US) Activated Carbon for Mercury Control Market Revenues & Volume, By Ferrous & Non-Ferrous Metals, 2021 - 2031F |
6.1.7 United States (US) Activated Carbon for Mercury Control Market Revenues & Volume, By Oil & Gas Burning, 2021 - 2031F |
6.1.8 United States (US) Activated Carbon for Mercury Control Market Revenues & Volume, By Oil Refining , 2021 - 2031F |
7 United States (US) Activated Carbon for Mercury Control Market Import-Export Trade Statistics |
7.1 United States (US) Activated Carbon for Mercury Control Market Export to Major Countries |
7.2 United States (US) Activated Carbon for Mercury Control Market Imports from Major Countries |
8 United States (US) Activated Carbon for Mercury Control Market Key Performance Indicators |
8.1 Average annual growth rate of activated carbon usage in mercury control applications in the US |
8.2 Number of new environmental regulations or policies related to mercury emissions in the US |
8.3 Adoption rate of activated carbon technologies in industries for mercury control in the US |
9 United States (US) Activated Carbon for Mercury Control Market - Opportunity Assessment |
9.1 United States (US) Activated Carbon for Mercury Control Market Opportunity Assessment, By Application, 2021 & 2031F |
10 United States (US) Activated Carbon for Mercury Control Market - Competitive Landscape |
10.1 United States (US) Activated Carbon for Mercury Control Market Revenue Share, By Companies, 2024 |
10.2 United States (US) Activated Carbon for Mercury Control Market Competitive Benchmarking, By Operating and Technical Parameters |
11 Company Profiles |
12 Recommendations |
13 Disclaimer |
Global Go To Market Strategy - 2030
Export potential enables firms to identify high-growth global markets with greater confidence by combining advanced trade intelligence with a structured quantitative methodology. The framework analyzes emerging demand trends and country-level import patterns while integrating macroeconomic and trade datasets such as GDP and population forecasts, bilateral import–export flows, tariff structures, elasticity differentials between developed and developing economies, geographic distance, and import demand projections. Using weighted trade values from 2020–2024 as the base period to project country-to-country export potential for 2030, these inputs are operationalized through calculated drivers such as gravity model parameters, tariff impact factors, and projected GDP per-capita growth. Through an analysis of hidden potentials, demand hotspots, and market conditions that are most favorable to success, this method enables firms to focus on target countries, maximize returns, and global expansion with data, backed by accuracy.
By factoring in the projected importer demand gap that is currently unmet and could be potential opportunity, it identifies the potential for the Exporter (Country) among 190 countries, against the general trade analysis, which identifies the biggest importer or exporter.
To discover high-growth global markets and optimize your business strategy:
Click Here
Pricing
- Single User License$ 1,995
- Department License$ 2,400
- Site License$ 3,120
- Global License$ 3,795

Leadership Perspectives from Industry Events
Search
Thought Leadership and Analyst Meet


Our Clients
6WResearch In News
- India Air Conditioner Market Set for Strong Rebound in 2026 After Weather-Led Correction and GST-Driven Recovery: 6Wresearch
- ADAS in India: How Automatic Emergency Braking, Blind Spot Detection & Driver Monitoring are Transforming Road Safety
- Doha a strategic location for EV manufacturing hub: IPA Qatar
- Demand for luxury TVs surging in the GCC, says Samsung
- Empowering Growth: The Thriving Journey of Bangladesh’s Cable Industry
- Demand for luxury TVs surging in the GCC, says Samsung
Latest Reports
- Nicaragua RPG Gaming Market (2026-2032)
- New Zealand RPG Gaming Market (2026-2032)
- Netherlands RPG Gaming Market (2026-2032)
- Nauru RPG Gaming Market (2026-2032)
- Namibia RPG Gaming Market (2026-2032)
- Mozambique RPG Gaming Market (2026-2032)
- Montenegro RPG Gaming Market (2026-2032)
- Mongolia RPG Gaming Market (2026-2032)
- Monaco RPG Gaming Market (2026-2032)
- Micronesia RPG Gaming Market (2026-2032)
Industry Events and Analyst Meet

HIMTEX 2026

India Refining Summit 2026

India EV Show 2026

EV tech India Expo 2026

Auto Tech Asia 2026
Whitepaper
- Middle East & Africa Commercial Security Market Click here to view more.
- Middle East & Africa Fire Safety Systems & Equipment Market Click here to view more.
- GCC Drone Market Click here to view more.
- Middle East Lighting Fixture Market Click here to view more.
- GCC Physical & Perimeter Security Market Click here to view more.