United States (US) Amenity Kits Market (2026-2032) | Trends, Share, Value, Outlook, Size & Revenue, Growth, Companies, Segmentation, Industry, Competitive Landscape, Forecast, Analysis
Market Forecast By Type (First Class Kits, Business Class Kits, Premium Economy Class Kits, Economy Class Kits), By Packaging (Bags, Pouches), By Element (Skincare Products, Dental & Oral Care Products, Eye Masks, Earplugs, Socks, Miscellaneous (Comb, Pen, Tissue, etc.), Others (Slippers, etc.)), By Application (Airlines, Premium Trains, Cruise Ships, Others (Luxury Buses, etc.)) And Competitive Landscape
| Product Code: ETC9959243 | Publication Date: Sep 2024 | Updated Date: Apr 2026 | Product Type: Market Research Report | |
| Publisher: 6Wresearch | Author: Summon Dutta | No. of Pages: 75 | No. of Figures: 35 | No. of Tables: 20 |
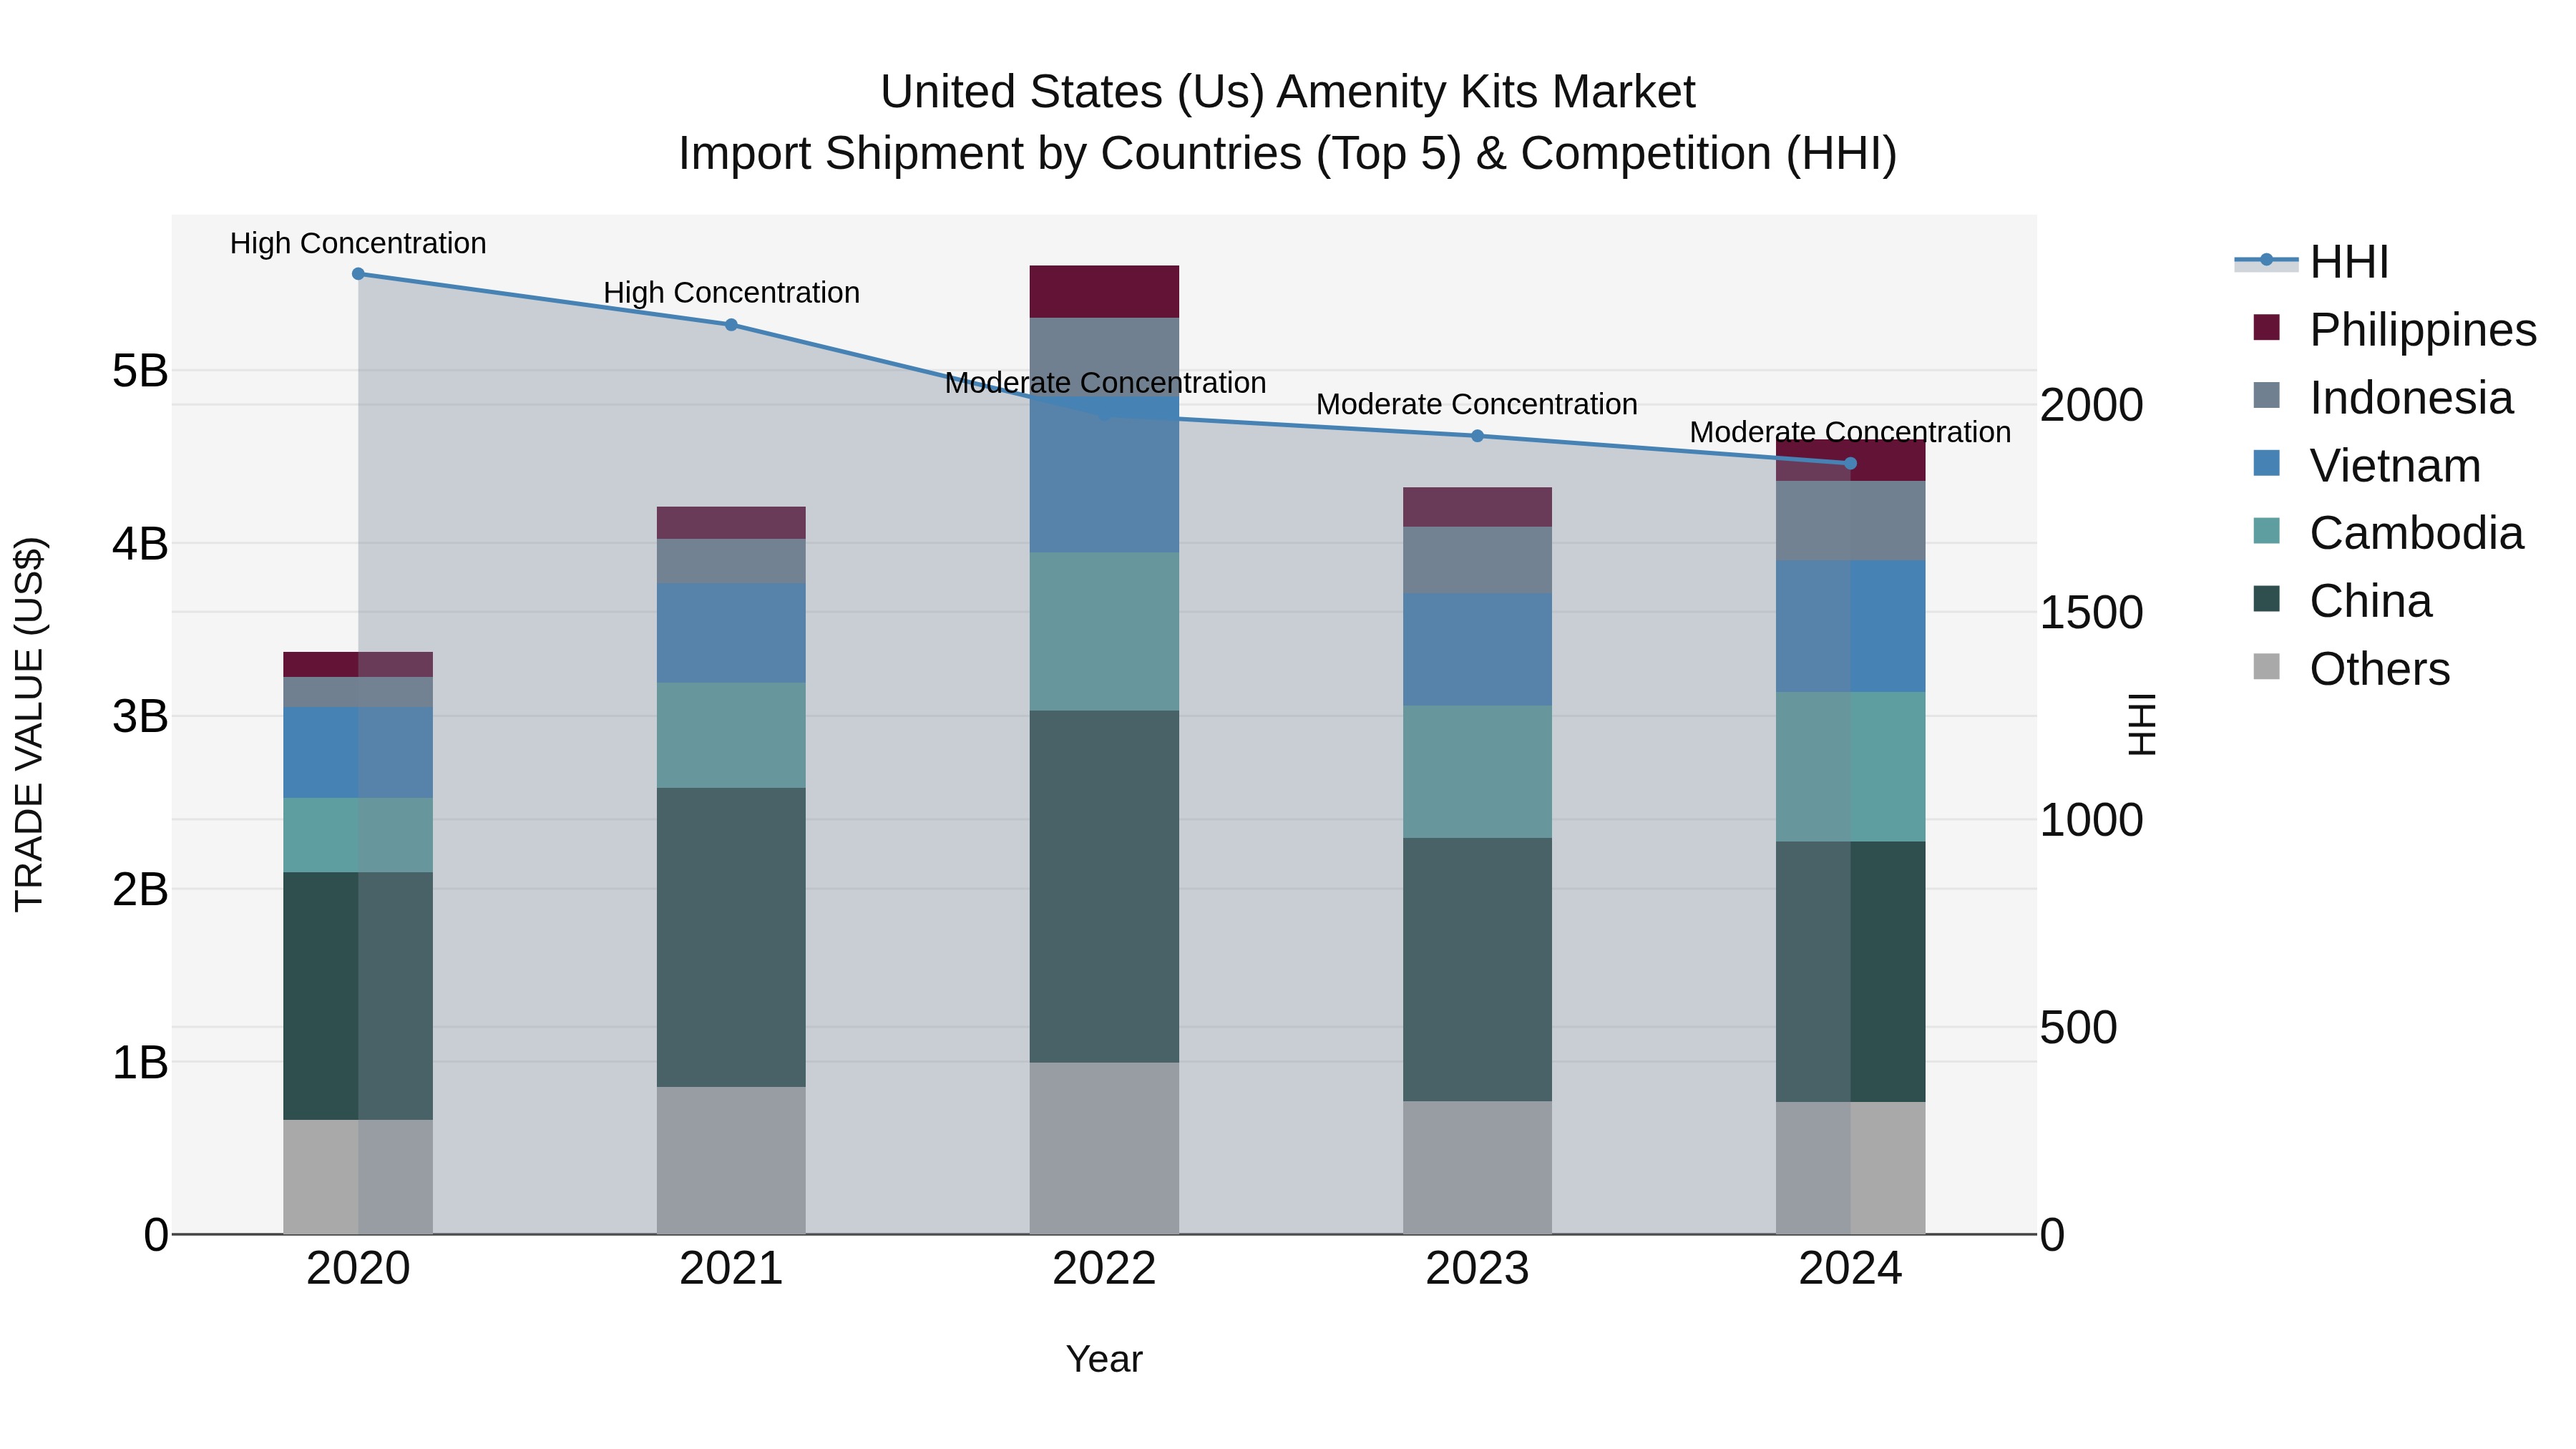
United States (US) Amenity Kits Market Top 5 Importing Countries and Market Competition (HHI) Analysis
The United States continues to see a steady increase in the importation of amenity kits, with top exporting countries in 2024 being China, Cambodia, Vietnam, Indonesia, and the Philippines. Despite moderate concentration levels, the industry is experiencing a healthy Compound Annual Growth Rate (CAGR) of 8.08% from 2020 to 2024. The growth rate for 2023-24 has also shown a positive trend of 6.38%, indicating a promising outlook for the market. The diverse range of exporting countries suggests a competitive landscape, driving innovation and variety in amenity kit offerings for consumers in the US.
Key Highlights of the Report:
- United States (US) Amenity Kits Market Outlook
- Market Size of United States (US) Amenity Kits Market, 2025
- Forecast of United States (US) Amenity Kits Market, 2032
- Historical Data and Forecast of United States (US) Amenity Kits Revenues & Volume for the Period 2022 - 2032
- United States (US) Amenity Kits Market Trend Evolution
- United States (US) Amenity Kits Market Drivers and Challenges
- United States (US) Amenity Kits Price Trends
- United States (US) Amenity Kits Porter's Five Forces
- United States (US) Amenity Kits Industry Life Cycle
- Historical Data and Forecast of United States (US) Amenity Kits Market Revenues & Volume By Type for the Period 2022 - 2032
- Historical Data and Forecast of United States (US) Amenity Kits Market Revenues & Volume By First Class Kits for the Period 2022 - 2032
- Historical Data and Forecast of United States (US) Amenity Kits Market Revenues & Volume By Business Class Kits for the Period 2022 - 2032
- Historical Data and Forecast of United States (US) Amenity Kits Market Revenues & Volume By Premium Economy Class Kits for the Period 2022 - 2032
- Historical Data and Forecast of United States (US) Amenity Kits Market Revenues & Volume By Economy Class Kits for the Period 2022 - 2032
- Historical Data and Forecast of United States (US) Amenity Kits Market Revenues & Volume By Packaging for the Period 2022 - 2032
- Historical Data and Forecast of United States (US) Amenity Kits Market Revenues & Volume By Bags for the Period 2022 - 2032
- Historical Data and Forecast of United States (US) Amenity Kits Market Revenues & Volume By Pouches for the Period 2022 - 2032
- Historical Data and Forecast of United States (US) Amenity Kits Market Revenues & Volume By Element for the Period 2022 - 2032
- Historical Data and Forecast of United States (US) Amenity Kits Market Revenues & Volume By Skincare Products for the Period 2022 - 2032
- Historical Data and Forecast of United States (US) Amenity Kits Market Revenues & Volume By Dental & Oral Care Products for the Period 2022 - 2032
- Historical Data and Forecast of United States (US) Amenity Kits Market Revenues & Volume By Eye Masks for the Period 2022 - 2032
- Historical Data and Forecast of United States (US) Amenity Kits Market Revenues & Volume By Earplugs for the Period 2022 - 2032
- Historical Data and Forecast of United States (US) Amenity Kits Market Revenues & Volume By Socks for the Period 2022 - 2032
- Historical Data and Forecast of United States (US) Amenity Kits Market Revenues & Volume By Miscellaneous (Comb, Pen, Tissue, etc.) for the Period 2022 - 2032
- Historical Data and Forecast of United States (US) Amenity Kits Market Revenues & Volume By Others (Slippers, etc.) for the Period 2022 - 2032
- Historical Data and Forecast of United States (US) Amenity Kits Market Revenues & Volume By Application for the Period 2022 - 2032
- Historical Data and Forecast of United States (US) Amenity Kits Market Revenues & Volume By Airlines for the Period 2022 - 2032
- Historical Data and Forecast of United States (US) Amenity Kits Market Revenues & Volume By Premium Trains for the Period 2022 - 2032
- Historical Data and Forecast of United States (US) Amenity Kits Market Revenues & Volume By Cruise Ships for the Period 2022 - 2032
- Historical Data and Forecast of United States (US) Amenity Kits Market Revenues & Volume By Others (Luxury Buses, etc.) for the Period 2022 - 2032
- United States (US) Amenity Kits Import Export Trade Statistics
- Market Opportunity Assessment By Type
- Market Opportunity Assessment By Packaging
- Market Opportunity Assessment By Element
- Market Opportunity Assessment By Application
- United States (US) Amenity Kits Top Companies Market Share
- United States (US) Amenity Kits Competitive Benchmarking By Technical and Operational Parameters
- United States (US) Amenity Kits Company Profiles
- United States (US) Amenity Kits Key Strategic Recommendations
Frequently Asked Questions About the Market Study (FAQs):
6Wresearch actively monitors the United States (US) Amenity Kits Market and publishes its comprehensive annual report, highlighting emerging trends, growth drivers, revenue analysis, and forecast outlook. Our insights help businesses to make data-backed strategic decisions with ongoing market dynamics. Our analysts track relevent industries related to the United States (US) Amenity Kits Market, allowing our clients with actionable intelligence and reliable forecasts tailored to emerging regional needs.
Yes, we provide customisation as per your requirements. To learn more, feel free to contact us on sales@6wresearch.com
1 Executive Summary |
2 Introduction |
2.1 Key Highlights of the Report |
2.2 Report Description |
2.3 Market Scope & Segmentation |
2.4 Research Methodology |
2.5 Assumptions |
3 United States (US) Amenity Kits Market Overview |
3.1 United States (US) Country Macro Economic Indicators |
3.2 United States (US) Amenity Kits Market Revenues & Volume, 2022 & 2032F |
3.3 United States (US) Amenity Kits Market - Industry Life Cycle |
3.4 United States (US) Amenity Kits Market - Porter's Five Forces |
3.5 United States (US) Amenity Kits Market Revenues & Volume Share, By Type, 2022 & 2032F |
3.6 United States (US) Amenity Kits Market Revenues & Volume Share, By Packaging, 2022 & 2032F |
3.7 United States (US) Amenity Kits Market Revenues & Volume Share, By Element, 2022 & 2032F |
3.8 United States (US) Amenity Kits Market Revenues & Volume Share, By Application, 2022 & 2032F |
4 United States (US) Amenity Kits Market Dynamics |
4.1 Impact Analysis |
4.2 Market Drivers |
4.2.1 Increasing demand for premium travel experiences |
4.2.2 Growth in the aviation industry leading to higher air travel |
4.2.3 Rising focus on customer satisfaction and loyalty programs in airlines |
4.3 Market Restraints |
4.3.1 Fluctuating fuel prices impacting airline profitability |
4.3.2 Competition from alternative products such as eco-friendly or digital amenities |
4.3.3 Economic downturn affecting travel frequency and spending |
5 United States (US) Amenity Kits Market Trends |
6 United States (US) Amenity Kits Market, By Types |
6.1 United States (US) Amenity Kits Market, By Type |
6.1.1 Overview and Analysis |
6.1.2 United States (US) Amenity Kits Market Revenues & Volume, By Type, 2022 - 2032F |
6.1.3 United States (US) Amenity Kits Market Revenues & Volume, By First Class Kits, 2022 - 2032F |
6.1.4 United States (US) Amenity Kits Market Revenues & Volume, By Business Class Kits, 2022 - 2032F |
6.1.5 United States (US) Amenity Kits Market Revenues & Volume, By Premium Economy Class Kits, 2022 - 2032F |
6.1.6 United States (US) Amenity Kits Market Revenues & Volume, By Economy Class Kits, 2022 - 2032F |
6.2 United States (US) Amenity Kits Market, By Packaging |
6.2.1 Overview and Analysis |
6.2.2 United States (US) Amenity Kits Market Revenues & Volume, By Bags, 2022 - 2032F |
6.2.3 United States (US) Amenity Kits Market Revenues & Volume, By Pouches, 2022 - 2032F |
6.3 United States (US) Amenity Kits Market, By Element |
6.3.1 Overview and Analysis |
6.3.2 United States (US) Amenity Kits Market Revenues & Volume, By Skincare Products, 2022 - 2032F |
6.3.3 United States (US) Amenity Kits Market Revenues & Volume, By Dental & Oral Care Products, 2022 - 2032F |
6.3.4 United States (US) Amenity Kits Market Revenues & Volume, By Eye Masks, 2022 - 2032F |
6.3.5 United States (US) Amenity Kits Market Revenues & Volume, By Earplugs, 2022 - 2032F |
6.3.6 United States (US) Amenity Kits Market Revenues & Volume, By Socks, 2022 - 2032F |
6.3.7 United States (US) Amenity Kits Market Revenues & Volume, By Miscellaneous (Comb, Pen, Tissue, etc.), 2022 - 2032F |
6.4 United States (US) Amenity Kits Market, By Application |
6.4.1 Overview and Analysis |
6.4.2 United States (US) Amenity Kits Market Revenues & Volume, By Airlines, 2022 - 2032F |
6.4.3 United States (US) Amenity Kits Market Revenues & Volume, By Premium Trains, 2022 - 2032F |
6.4.4 United States (US) Amenity Kits Market Revenues & Volume, By Cruise Ships, 2022 - 2032F |
6.4.5 United States (US) Amenity Kits Market Revenues & Volume, By Others (Luxury Buses, etc.), 2022 - 2032F |
7 United States (US) Amenity Kits Market Import-Export Trade Statistics |
7.1 United States (US) Amenity Kits Market Export to Major Countries |
7.2 United States (US) Amenity Kits Market Imports from Major Countries |
8 United States (US) Amenity Kits Market Key Performance Indicators |
8.1 Customer satisfaction scores related to in-flight amenities |
8.2 Number of airline partnerships offering amenity kits |
8.3 Percentage of repeat customers who cite amenity kits as a factor in their choice of airline |
9 United States (US) Amenity Kits Market - Opportunity Assessment |
9.1 United States (US) Amenity Kits Market Opportunity Assessment, By Type, 2022 & 2032F |
9.2 United States (US) Amenity Kits Market Opportunity Assessment, By Packaging, 2022 & 2032F |
9.3 United States (US) Amenity Kits Market Opportunity Assessment, By Element, 2022 & 2032F |
9.4 United States (US) Amenity Kits Market Opportunity Assessment, By Application, 2022 & 2032F |
10 United States (US) Amenity Kits Market - Competitive Landscape |
10.1 United States (US) Amenity Kits Market Revenue Share, By Companies, 2025 |
10.2 United States (US) Amenity Kits Market Competitive Benchmarking, By Operating and Technical Parameters |
11 Company Profiles |
12 Recommendations |
13 Disclaimer |
Export potential assessment - trade Analytics for 2030
Export potential enables firms to identify high-growth global markets with greater confidence by combining advanced trade intelligence with a structured quantitative methodology. The framework analyzes emerging demand trends and country-level import patterns while integrating macroeconomic and trade datasets such as GDP and population forecasts, bilateral import–export flows, tariff structures, elasticity differentials between developed and developing economies, geographic distance, and import demand projections. Using weighted trade values from 2020–2024 as the base period to project country-to-country export potential for 2030, these inputs are operationalized through calculated drivers such as gravity model parameters, tariff impact factors, and projected GDP per-capita growth. Through an analysis of hidden potentials, demand hotspots, and market conditions that are most favorable to success, this method enables firms to focus on target countries, maximize returns, and global expansion with data, backed by accuracy.
By factoring in the projected importer demand gap that is currently unmet and could be potential opportunity, it identifies the potential for the Exporter (Country) among 190 countries, against the general trade analysis, which identifies the biggest importer or exporter.
To discover high-growth global markets and optimize your business strategy:
Click Here
Pricing
- Single User License$ 1,995
- Department License$ 2,400
- Site License$ 3,120
- Global License$ 3,795

Search
Thought Leadership and Analyst Meet


Our Clients
Latest Reports
- Syria Air Conditioner Market (2026-2032) | Outlook, Competition, Drivers, Trends, Demand, Competitive, Strategic Insights, Companies, Challenges, Strategy, Consumer Insights, Analysis, Opportunities, Growth, Size, Share, Industry, Revenue, Segments, Value, Segmentation, Supply, Forecast, Restraints,
- Philippines Polyhydroxybutyrate-co-Hydroxyvalerate Market (2026-2032) | Trends, Insights, Challenges, Restraints, Competition, Size, Value, Forecast, Pricing, Share, Outlook, Revenue, Investment Opportunities, Strategy, Drivers, Demand, Growth, segmentation, Analysis, Companies
- Peru Polyhydroxybutyrate-co-Hydroxyvalerate Market (2026-2032) | Growth, Demand, Challenges, Share, Trends, Analysis, Pricing, Investment Opportunities, Drivers, Value, Forecast, Competition, Size, Companies, Insights, Outlook, Restraints, segmentation, Revenue, Strategy
- Pakistan Polyhydroxybutyrate-co-Hydroxyvalerate Market (2026-2032) | Restraints, segmentation, Pricing, Forecast, Share, Strategy, Competition, Trends, Insights, Drivers, Challenges, Growth, Revenue, Outlook, Value, Investment Opportunities, Companies, Size, Analysis, Demand
- Oman Polyhydroxybutyrate-co-Hydroxyvalerate Market (2026-2032) | Drivers, segmentation, Insights, Competition, Pricing, Outlook, Size, Revenue, Challenges, Forecast, Analysis, Growth, Value, Share, Trends, Investment Opportunities, Strategy, Restraints, Companies, Demand
- Nigeria Polyhydroxybutyrate-co-Hydroxyvalerate Market (2026-2032) | Value, Investment Opportunities, Analysis, Revenue, Restraints, Pricing, Outlook, Competition, Demand, Growth, Forecast, Companies, Trends, Challenges, segmentation, Drivers, Insights, Share, Size, Strategy
- Nepal Polyhydroxybutyrate-co-Hydroxyvalerate Market (2026-2032) | Insights, Analysis, Drivers, Share, Revenue, Demand, segmentation, Investment Opportunities, Competition, Forecast, Growth, Pricing, Companies, Strategy, Trends, Restraints, Challenges, Outlook, Size, Value
- Myanmar Polyhydroxybutyrate-co-Hydroxyvalerate Market (2026-2032) | Outlook, Revenue, Strategy, Restraints, Drivers, segmentation, Share, Forecast, Competition, Insights, Growth, Pricing, Size, Demand, Value, Companies, Trends, Challenges, Investment Opportunities, Analysis
- Morocco Polyhydroxybutyrate-co-Hydroxyvalerate Market (2026-2032) | Outlook, Investment Opportunities, Restraints, Strategy, Forecast, Challenges, Drivers, Growth, Companies, segmentation, Trends, Size, Competition, Revenue, Demand, Insights, Share, Analysis, Value, Pricing
- Mexico Polyhydroxybutyrate-co-Hydroxyvalerate Market (2026-2032) | Size, Drivers, Outlook, Share, Strategy, Growth, Pricing, Challenges, Companies, Demand, Value, Investment Opportunities, Restraints, Trends, Forecast, segmentation, Analysis, Insights, Competition, Revenue
Industry Events and Analyst Meet

HIMTEX 2026

India Refining Summit 2026

India EV Show 2026

EV tech India Expo 2026

Auto Tech Asia 2026
Whitepaper
- Middle East & Africa Commercial Security Market Click here to view more.
- Middle East & Africa Fire Safety Systems & Equipment Market Click here to view more.
- GCC Drone Market Click here to view more.
- Middle East Lighting Fixture Market Click here to view more.
- GCC Physical & Perimeter Security Market Click here to view more.
6WResearch In News
- Doha a strategic location for EV manufacturing hub: IPA Qatar
- Demand for luxury TVs surging in the GCC, says Samsung
- Empowering Growth: The Thriving Journey of Bangladesh’s Cable Industry
- Demand for luxury TVs surging in the GCC, says Samsung
- Video call with a traditional healer? Once unthinkable, it’s now common in South Africa
- Intelligent Buildings To Smooth GCC’s Path To Net Zero