United States (US) Antimony Market (2025-2031) Outlook | Share, Forecast, Analysis, Industry, Size, Companies, Value, Trends, Growth & Revenue
Market Forecast By Type (Metal Ingot, Antimony Trioxide, Antimony Pentoxide, Alloys, Other), By Application (Flame Retardant, Lead Acid Batteries, Alloy Strengthening Agent, Fiberglass Composites, Catalyst, Other) And Competitive Landscape
| Product Code: ETC087020 | Publication Date: Jun 2021 | Updated Date: Nov 2025 | Product Type: Report | |
| Publisher: 6Wresearch | Author: Shubham Deep | No. of Pages: 70 | No. of Figures: 35 | No. of Tables: 5 |
United States Antimony Market Year-wise Growth Rate (2021-2031F)
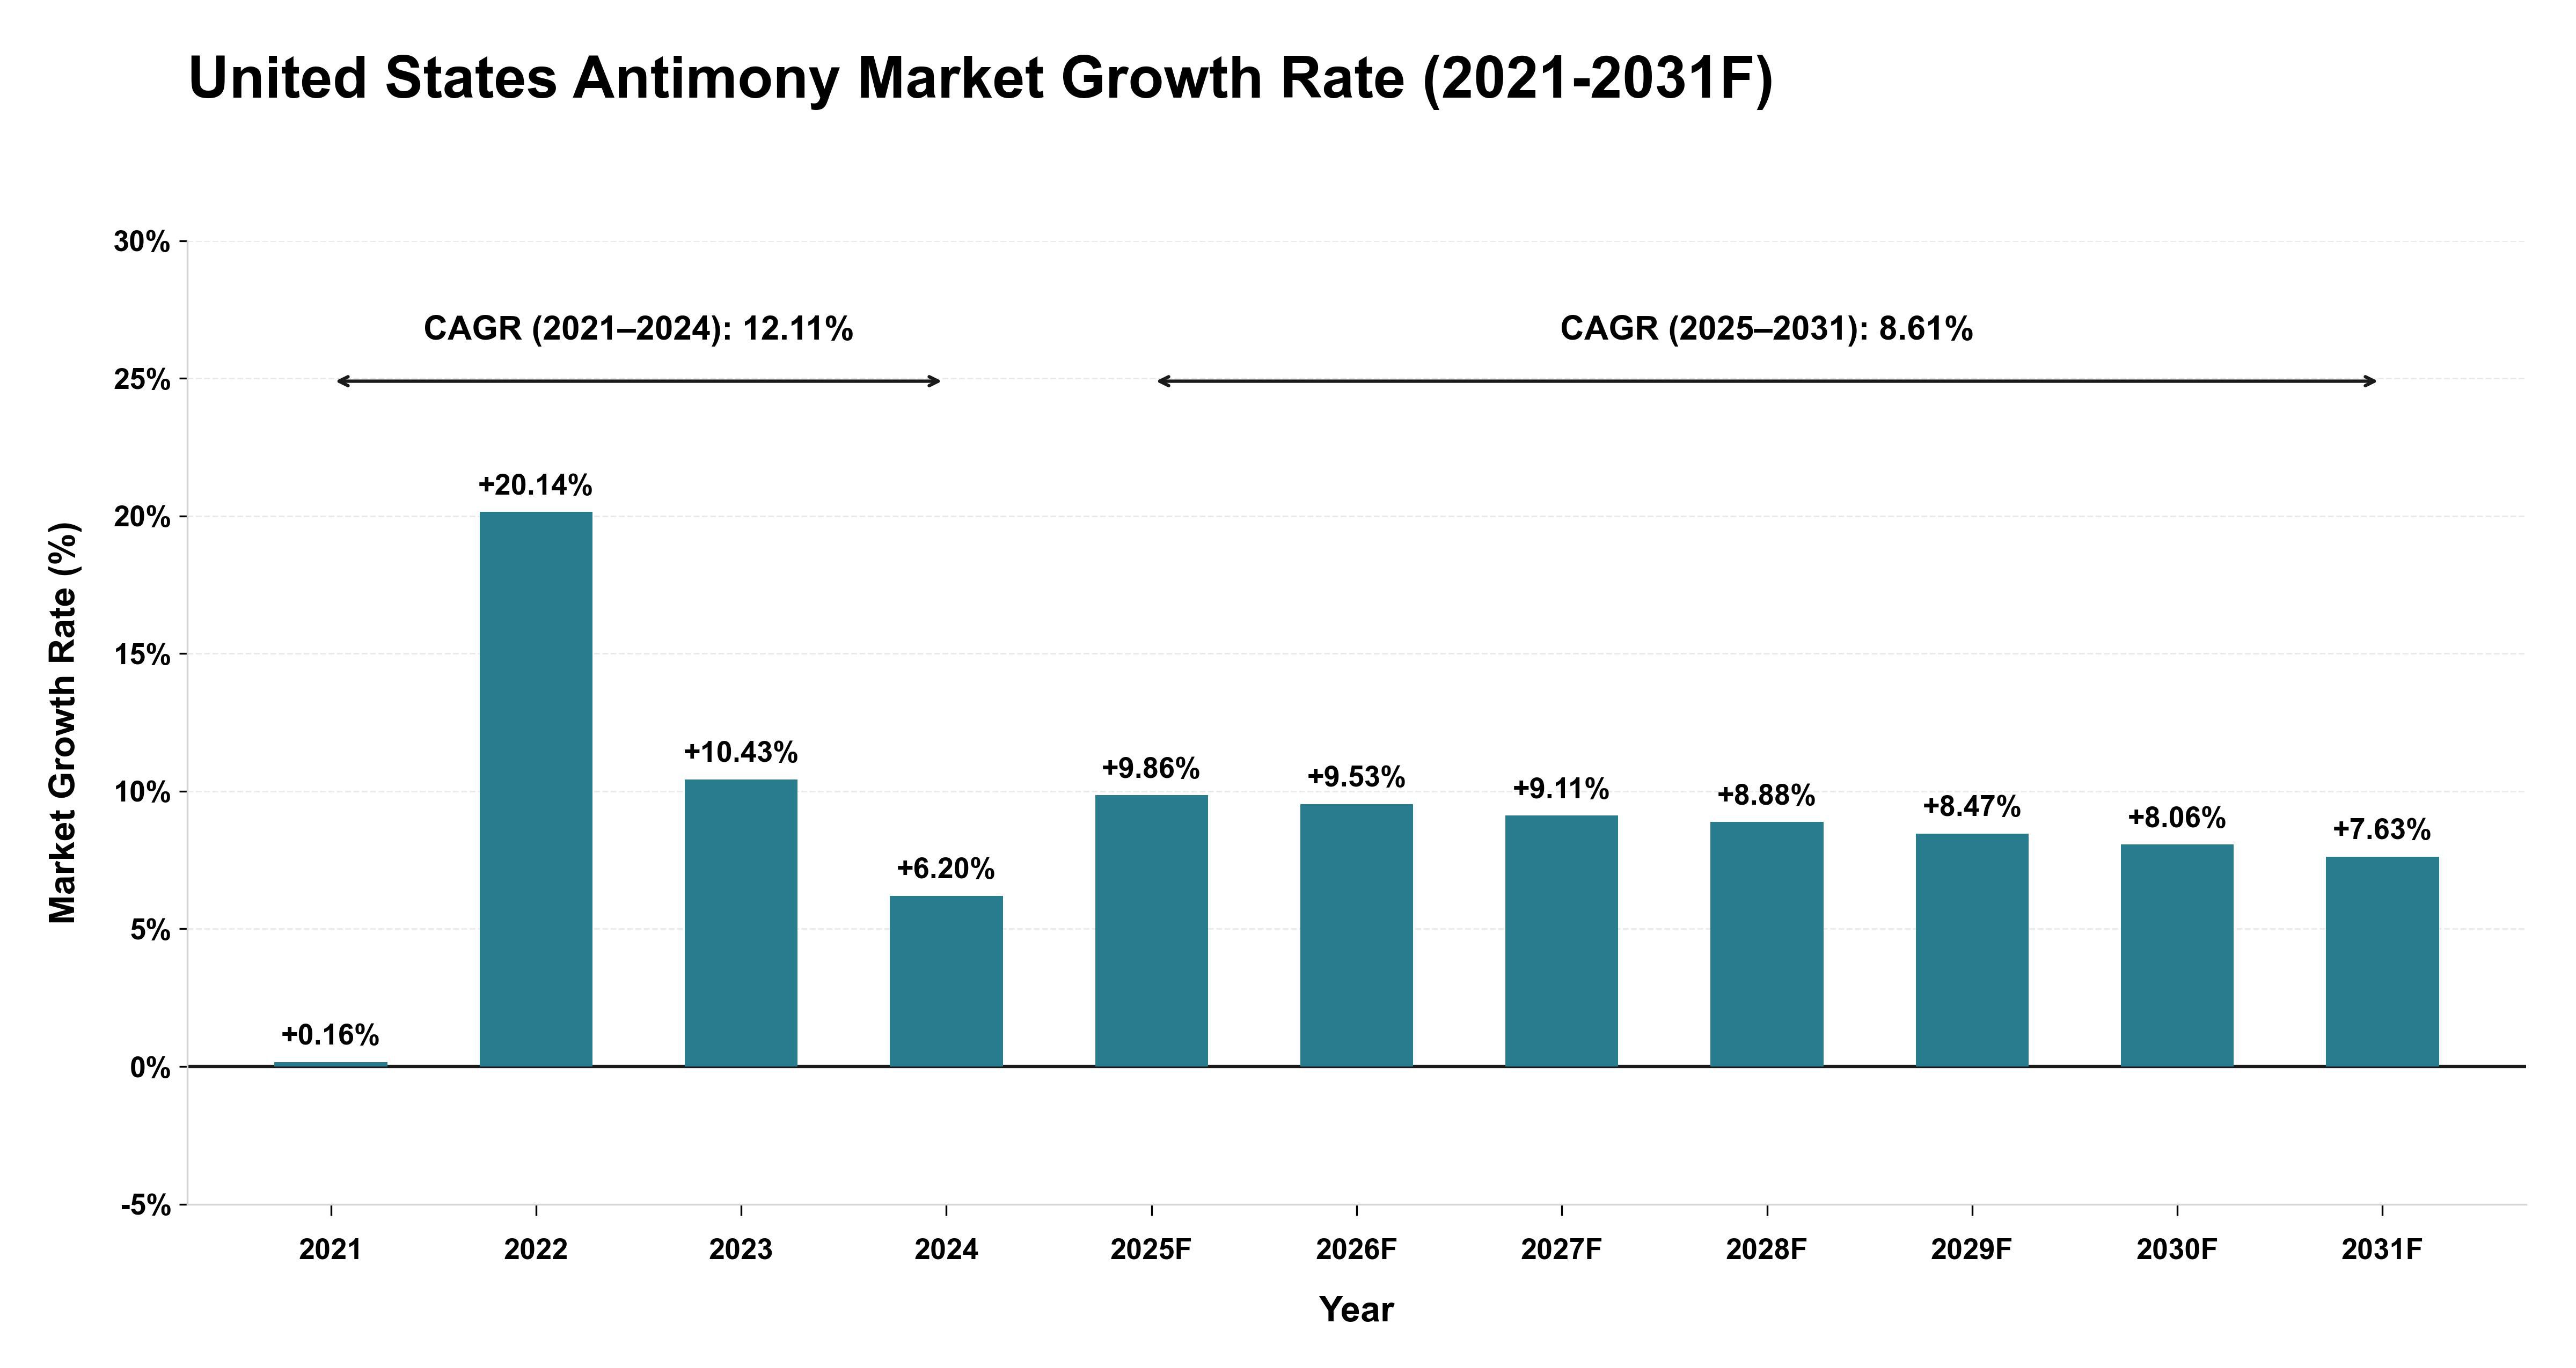
The United States Antimony Market witnessed a fluctuating trajectory from 2021 to 2024, with growth rates ranging from a minimal 0.16% to a substantial 20.14%. The historical CAGR of 12.11% indicates periods of acceleration and deceleration driven by end-use industries adopting antimony, influenced by technological advancements and regulatory factors. Moving into the forecast period of 2025-2031, the growth rates stabilize around the forecasted CAGR of 8.61%, suggesting a more mature market phase characterized by steady demand drivers and supply chain dynamics. Anticipated steady growth reflects a balanced market outlook, with consumption patterns aligning with economic principles of gradual expansion and sustainable development within the sector.
United States (US) Antimony Market Overview
The United States antimony market is primarily driven by its use in flame retardants, lead-acid batteries, and ceramics. Antimony is a critical mineral with applications in various industries, including electronics, construction, and automotive. The US relies heavily on imports to meet its antimony needs, with China being a major supplier. However, increasing concerns over supply chain security and the growing demand for antimony in defense applications are prompting the US to explore domestic production opportunities. Regulatory developments, such as the US Antimony Act, are also impacting the market dynamics. Overall, the US antimony market is poised for growth, driven by increasing industrial applications and efforts to secure domestic sources of this essential mineral.
United States (US) Antimony Market Trends
The US antimony market is experiencing a growing demand due to its wide range of applications in industries such as electronics, flame retardants, and batteries. The increasing focus on sustainable and eco-friendly products has also led to a surge in the use of antimony as a substitute for harmful chemicals in various applications. Additionally, the rising investments in infrastructure and construction projects in the US are driving the demand for antimony-based materials. However, challenges such as fluctuating raw material prices and regulatory constraints on antimony mining are impacting market growth. Companies in the US antimony market are focusing on technological advancements and strategic partnerships to overcome these challenges and capitalize on the growing opportunities in the market.
United States (US) Antimony Market Challenges
In the US Antimony Market, challenges primarily revolve around the reliance on imports due to limited domestic production, economic factors affecting mining operations, and environmental regulations impacting the mining and processing of antimony. Fluctuating global market prices and competition from cheaper foreign sources also pose challenges for US antimony producers. Additionally, the limited number of antimony mines in operation in the US and the high costs associated with exploration and development further hinder the growth and stability of the domestic antimony industry. Overcoming these challenges would require strategic investments in domestic production capabilities, technological advancements to improve efficiency, and a focus on sustainable mining practices to ensure long-term viability in the US antimony market.
United States (US) Antimony Market Investment Opportunities
In the US Antimony Market, there are several investment opportunities for those looking to capitalize on the growing demand for this critical mineral. Antimony is primarily used in flame-retardant materials, batteries, and as a hardening agent in alloys, making it essential for various industries including electronics, automotive, and construction. Investing in US-based antimony mining companies or exploration firms could be a lucrative opportunity as the domestic production of antimony is relatively low compared to its demand. Additionally, investing in companies that utilize antimony in their manufacturing processes or supply chain could also be a strategic move to benefit from the anticipated increase in demand for this mineral. Overall, the US Antimony Market presents diverse investment prospects for those willing to tap into its potential growth.
United States (US) Antimony Market Government Policy
Government policies related to the US Antimony Market include regulations on mining operations, environmental impact assessments, and export controls. The US government has implemented measures to promote domestic antimony production and reduce reliance on imports, with a focus on national security and supply chain resilience. Additionally, trade policies and tariffs may affect the import and export of antimony products, influencing market dynamics and pricing. Regulatory agencies such as the Environmental Protection Agency (EPA) and the Mine Safety and Health Administration (MSHA) oversee compliance with environmental and safety standards in antimony mining and processing operations. Overall, government policies play a significant role in shaping the US Antimony Market by influencing production levels, market competition, and sustainability practices within the industry.
United States (US) Antimony Market Future Outlook
The United States antimony market is expected to witness steady growth in the coming years due to increasing demand from various end-use industries such as electronics, automotive, and construction. The growing focus on sustainable and eco-friendly products is driving the use of antimony in flame retardants and batteries, further boosting market growth. Additionally, the rising investments in infrastructure development and the expansion of the electronics industry are likely to contribute to the increasing demand for antimony in the US market. However, challenges such as regulatory restrictions and fluctuating prices of raw materials may impact the market growth to some extent. Overall, the US antimony market is anticipated to show promising growth prospects in the foreseeable future.
Key Highlights of the Report:
- United States (US) Antimony Market Outlook
- Market Size of United States (US) Antimony Market, 2021
- Forecast of United States (US) Antimony Market, 2031
- Historical Data and Forecast of United States (US) Antimony Revenues & Volume for the Period 2021 - 2031
- United States (US) Antimony Market Trend Evolution
- United States (US) Antimony Market Drivers and Challenges
- United States (US) Antimony Price Trends
- United States (US) Antimony Porter's Five Forces
- United States (US) Antimony Industry Life Cycle
- Historical Data and Forecast of United States (US) Antimony Market Revenues & Volume By Type for the Period 2021 - 2031
- Historical Data and Forecast of United States (US) Antimony Market Revenues & Volume By Metal Ingot for the Period 2021 - 2031
- Historical Data and Forecast of United States (US) Antimony Market Revenues & Volume By Antimony Trioxide for the Period 2021 - 2031
- Historical Data and Forecast of United States (US) Antimony Market Revenues & Volume By Antimony Pentoxide for the Period 2021 - 2031
- Historical Data and Forecast of United States (US) Antimony Market Revenues & Volume By Alloys for the Period 2021 - 2031
- Historical Data and Forecast of United States (US) Antimony Market Revenues & Volume By Other for the Period 2021 - 2031
- Historical Data and Forecast of United States (US) Antimony Market Revenues & Volume By Application for the Period 2021 - 2031
- Historical Data and Forecast of United States (US) Antimony Market Revenues & Volume By Flame Retardant for the Period 2021 - 2031
- Historical Data and Forecast of United States (US) Antimony Market Revenues & Volume By Lead Acid Batteries for the Period 2021 - 2031
- Historical Data and Forecast of United States (US) Antimony Market Revenues & Volume By Alloy Strengthening Agent for the Period 2021 - 2031
- Historical Data and Forecast of United States (US) Antimony Market Revenues & Volume By Fiberglass Composites for the Period 2021 - 2031
- Historical Data and Forecast of United States (US) Antimony Market Revenues & Volume By Catalyst for the Period 2021 - 2031
- Historical Data and Forecast of United States (US) Antimony Market Revenues & Volume By Other for the Period 2021 - 2031
- United States (US) Antimony Import Export Trade Statistics
- Market Opportunity Assessment By Type
- Market Opportunity Assessment By Application
- United States (US) Antimony Top Companies Market Share
- United States (US) Antimony Competitive Benchmarking By Technical and Operational Parameters
- United States (US) Antimony Company Profiles
- United States (US) Antimony Key Strategic Recommendations
Frequently Asked Questions About the Market Study (FAQs):
6Wresearch actively monitors the United States (US) Antimony Market and publishes its comprehensive annual report, highlighting emerging trends, growth drivers, revenue analysis, and forecast outlook. Our insights help businesses to make data-backed strategic decisions with ongoing market dynamics. Our analysts track relevent industries related to the United States (US) Antimony Market, allowing our clients with actionable intelligence and reliable forecasts tailored to emerging regional needs.
Yes, we provide customisation as per your requirements. To learn more, feel free to contact us on sales@6wresearch.com
1 Executive Summary |
2 Introduction |
2.1 Key Highlights of the Report |
2.2 Report Description |
2.3 Market Scope & Segmentation |
2.4 Research Methodology |
2.5 Assumptions |
3 United States (US) Antimony Market Overview |
3.1 United States (US) Country Macro Economic Indicators |
3.2 United States (US) Antimony Market Revenues & Volume, 2021 & 2031F |
3.3 United States (US) Antimony Market - Industry Life Cycle |
3.4 United States (US) Antimony Market - Porter's Five Forces |
3.5 United States (US) Antimony Market Revenues & Volume Share, By Type, 2021 & 2031F |
3.6 United States (US) Antimony Market Revenues & Volume Share, By Form, 2021 & 2031F |
4 United States (US) Antimony Market Dynamics |
4.1 Impact Analysis |
4.2 Market Drivers |
4.2.1 Increasing demand for flame retardants and lead-acid batteries, where antimony is used as an essential component. |
4.2.2 Growing applications in the electronics industry for semiconductors and infrared detectors. |
4.2.3 Rising investments in infrastructure projects, leading to higher demand for antimony-based materials. |
4.3 Market Restraints |
4.3.1 Volatility in antimony prices due to supply-demand imbalances and geopolitical factors. |
4.3.2 Stringent environmental regulations impacting antimony mining and processing operations. |
4.3.3 Competition from substitutes like bismuth and tin affecting the market share of antimony. |
5 United States (US) Antimony Market Trends |
6 United States (US) Antimony Market, By Types |
6.1 United States (US) Antimony Market, By Type |
6.1.1 Overview and Analysis |
6.1.2 United States (US) Antimony Market Revenues & Volume, By Type, 2018 - 2027F |
6.1.3 United States (US) Antimony Market Revenues & Volume, By Metal Ingot, 2018 - 2027F |
6.1.4 United States (US) Antimony Market Revenues & Volume, By Antimony Trioxide, 2018 - 2027F |
6.1.5 United States (US) Antimony Market Revenues & Volume, By Antimony Pentoxide, 2018 - 2027F |
6.1.6 United States (US) Antimony Market Revenues & Volume, By Alloys, 2018 - 2027F |
6.1.7 United States (US) Antimony Market Revenues & Volume, By Other, 2018 - 2027F |
6.2 United States (US) Antimony Market, By Application |
6.2.1 Overview and Analysis |
6.2.2 United States (US) Antimony Market Revenues & Volume, By Flame Retardant, 2018 - 2027F |
6.2.3 United States (US) Antimony Market Revenues & Volume, By Lead Acid Batteries, 2018 - 2027F |
6.2.4 United States (US) Antimony Market Revenues & Volume, By Alloy Strengthening Agent, 2018 - 2027F |
6.2.5 United States (US) Antimony Market Revenues & Volume, By Fiberglass Composites, 2018 - 2027F |
6.2.6 United States (US) Antimony Market Revenues & Volume, By Catalyst, 2018 - 2027F |
6.2.7 United States (US) Antimony Market Revenues & Volume, By Other, 2018 - 2027F |
7 United States (US) Antimony Market Import-Export Trade Statistics |
7.1 United States (US) Antimony Market Export to Major Countries |
7.2 United States (US) Antimony Market Imports from Major Countries |
8 United States (US) Antimony Market Key Performance Indicators |
8.1 Antimony spot price trends in the US market. |
8.2 Percentage of antimony used in key industries such as flame retardants and electronics. |
8.3 Number of new infrastructure projects requiring antimony-based materials. |
9 United States (US) Antimony Market - Opportunity Assessment |
9.1 United States (US) Antimony Market Opportunity Assessment, By Type, 2021 & 2031F |
9.2 United States (US) Antimony Market Opportunity Assessment, By Application, 2021 & 2031F |
10 United States (US) Antimony Market - Competitive Landscape |
10.1 United States (US) Antimony Market Revenue Share, By Companies, 2021 |
10.2 United States (US) Antimony Market Competitive Benchmarking, By Operating and Technical Parameters |
11 Company Profiles |
12 Recommendations |
13 Disclaimer |
Global Go To Market Strategy - 2030
Export potential enables firms to identify high-growth global markets with greater confidence by combining advanced trade intelligence with a structured quantitative methodology. The framework analyzes emerging demand trends and country-level import patterns while integrating macroeconomic and trade datasets such as GDP and population forecasts, bilateral import–export flows, tariff structures, elasticity differentials between developed and developing economies, geographic distance, and import demand projections. Using weighted trade values from 2020–2024 as the base period to project country-to-country export potential for 2030, these inputs are operationalized through calculated drivers such as gravity model parameters, tariff impact factors, and projected GDP per-capita growth. Through an analysis of hidden potentials, demand hotspots, and market conditions that are most favorable to success, this method enables firms to focus on target countries, maximize returns, and global expansion with data, backed by accuracy.
By factoring in the projected importer demand gap that is currently unmet and could be potential opportunity, it identifies the potential for the Exporter (Country) among 190 countries, against the general trade analysis, which identifies the biggest importer or exporter.
To discover high-growth global markets and optimize your business strategy:
Click Here
Pricing
- Single User License$ 1,995
- Department License$ 2,400
- Site License$ 3,120
- Global License$ 3,795

Leadership Perspectives from Industry Events
Search
Thought Leadership and Analyst Meet


Our Clients
6WResearch In News
- India Air Conditioner Market Set for Strong Rebound in 2026 After Weather-Led Correction and GST-Driven Recovery: 6Wresearch
- ADAS in India: How Automatic Emergency Braking, Blind Spot Detection & Driver Monitoring are Transforming Road Safety
- Doha a strategic location for EV manufacturing hub: IPA Qatar
- Demand for luxury TVs surging in the GCC, says Samsung
- Empowering Growth: The Thriving Journey of Bangladesh’s Cable Industry
- Demand for luxury TVs surging in the GCC, says Samsung
Latest Reports
- Nicaragua RPG Gaming Market (2026-2032)
- New Zealand RPG Gaming Market (2026-2032)
- Netherlands RPG Gaming Market (2026-2032)
- Nauru RPG Gaming Market (2026-2032)
- Namibia RPG Gaming Market (2026-2032)
- Mozambique RPG Gaming Market (2026-2032)
- Montenegro RPG Gaming Market (2026-2032)
- Mongolia RPG Gaming Market (2026-2032)
- Monaco RPG Gaming Market (2026-2032)
- Micronesia RPG Gaming Market (2026-2032)
Industry Events and Analyst Meet

HIMTEX 2026

India Refining Summit 2026

India EV Show 2026

EV tech India Expo 2026

Auto Tech Asia 2026
Whitepaper
- Middle East & Africa Commercial Security Market Click here to view more.
- Middle East & Africa Fire Safety Systems & Equipment Market Click here to view more.
- GCC Drone Market Click here to view more.
- Middle East Lighting Fixture Market Click here to view more.
- GCC Physical & Perimeter Security Market Click here to view more.