United States (US) Bronopol Market (2026-2032) | Outlook, Segmentation, Companies, Trends, Competitive Landscape, Share, Value, Analysis, Industry, Size & Revenue, Forecast, Growth
Market Forecast By Type (Coagulants, Flocculants, Biocides, Disinfectants, PH Adjusters, Stabilizers, Inhibitors, Defoaming Agents), By Form (Liquid, Solid), By Application (Water Treatment, Formulators, Oil and Gas, Paper and Pulp, Paints, Coating, Adhesives) And Competitive Landscape
| Product Code: ETC9961346 | Publication Date: Sep 2024 | Updated Date: Apr 2026 | Product Type: Market Research Report | |
| Publisher: 6Wresearch | Author: Sumit Sagar | No. of Pages: 75 | No. of Figures: 35 | No. of Tables: 20 |
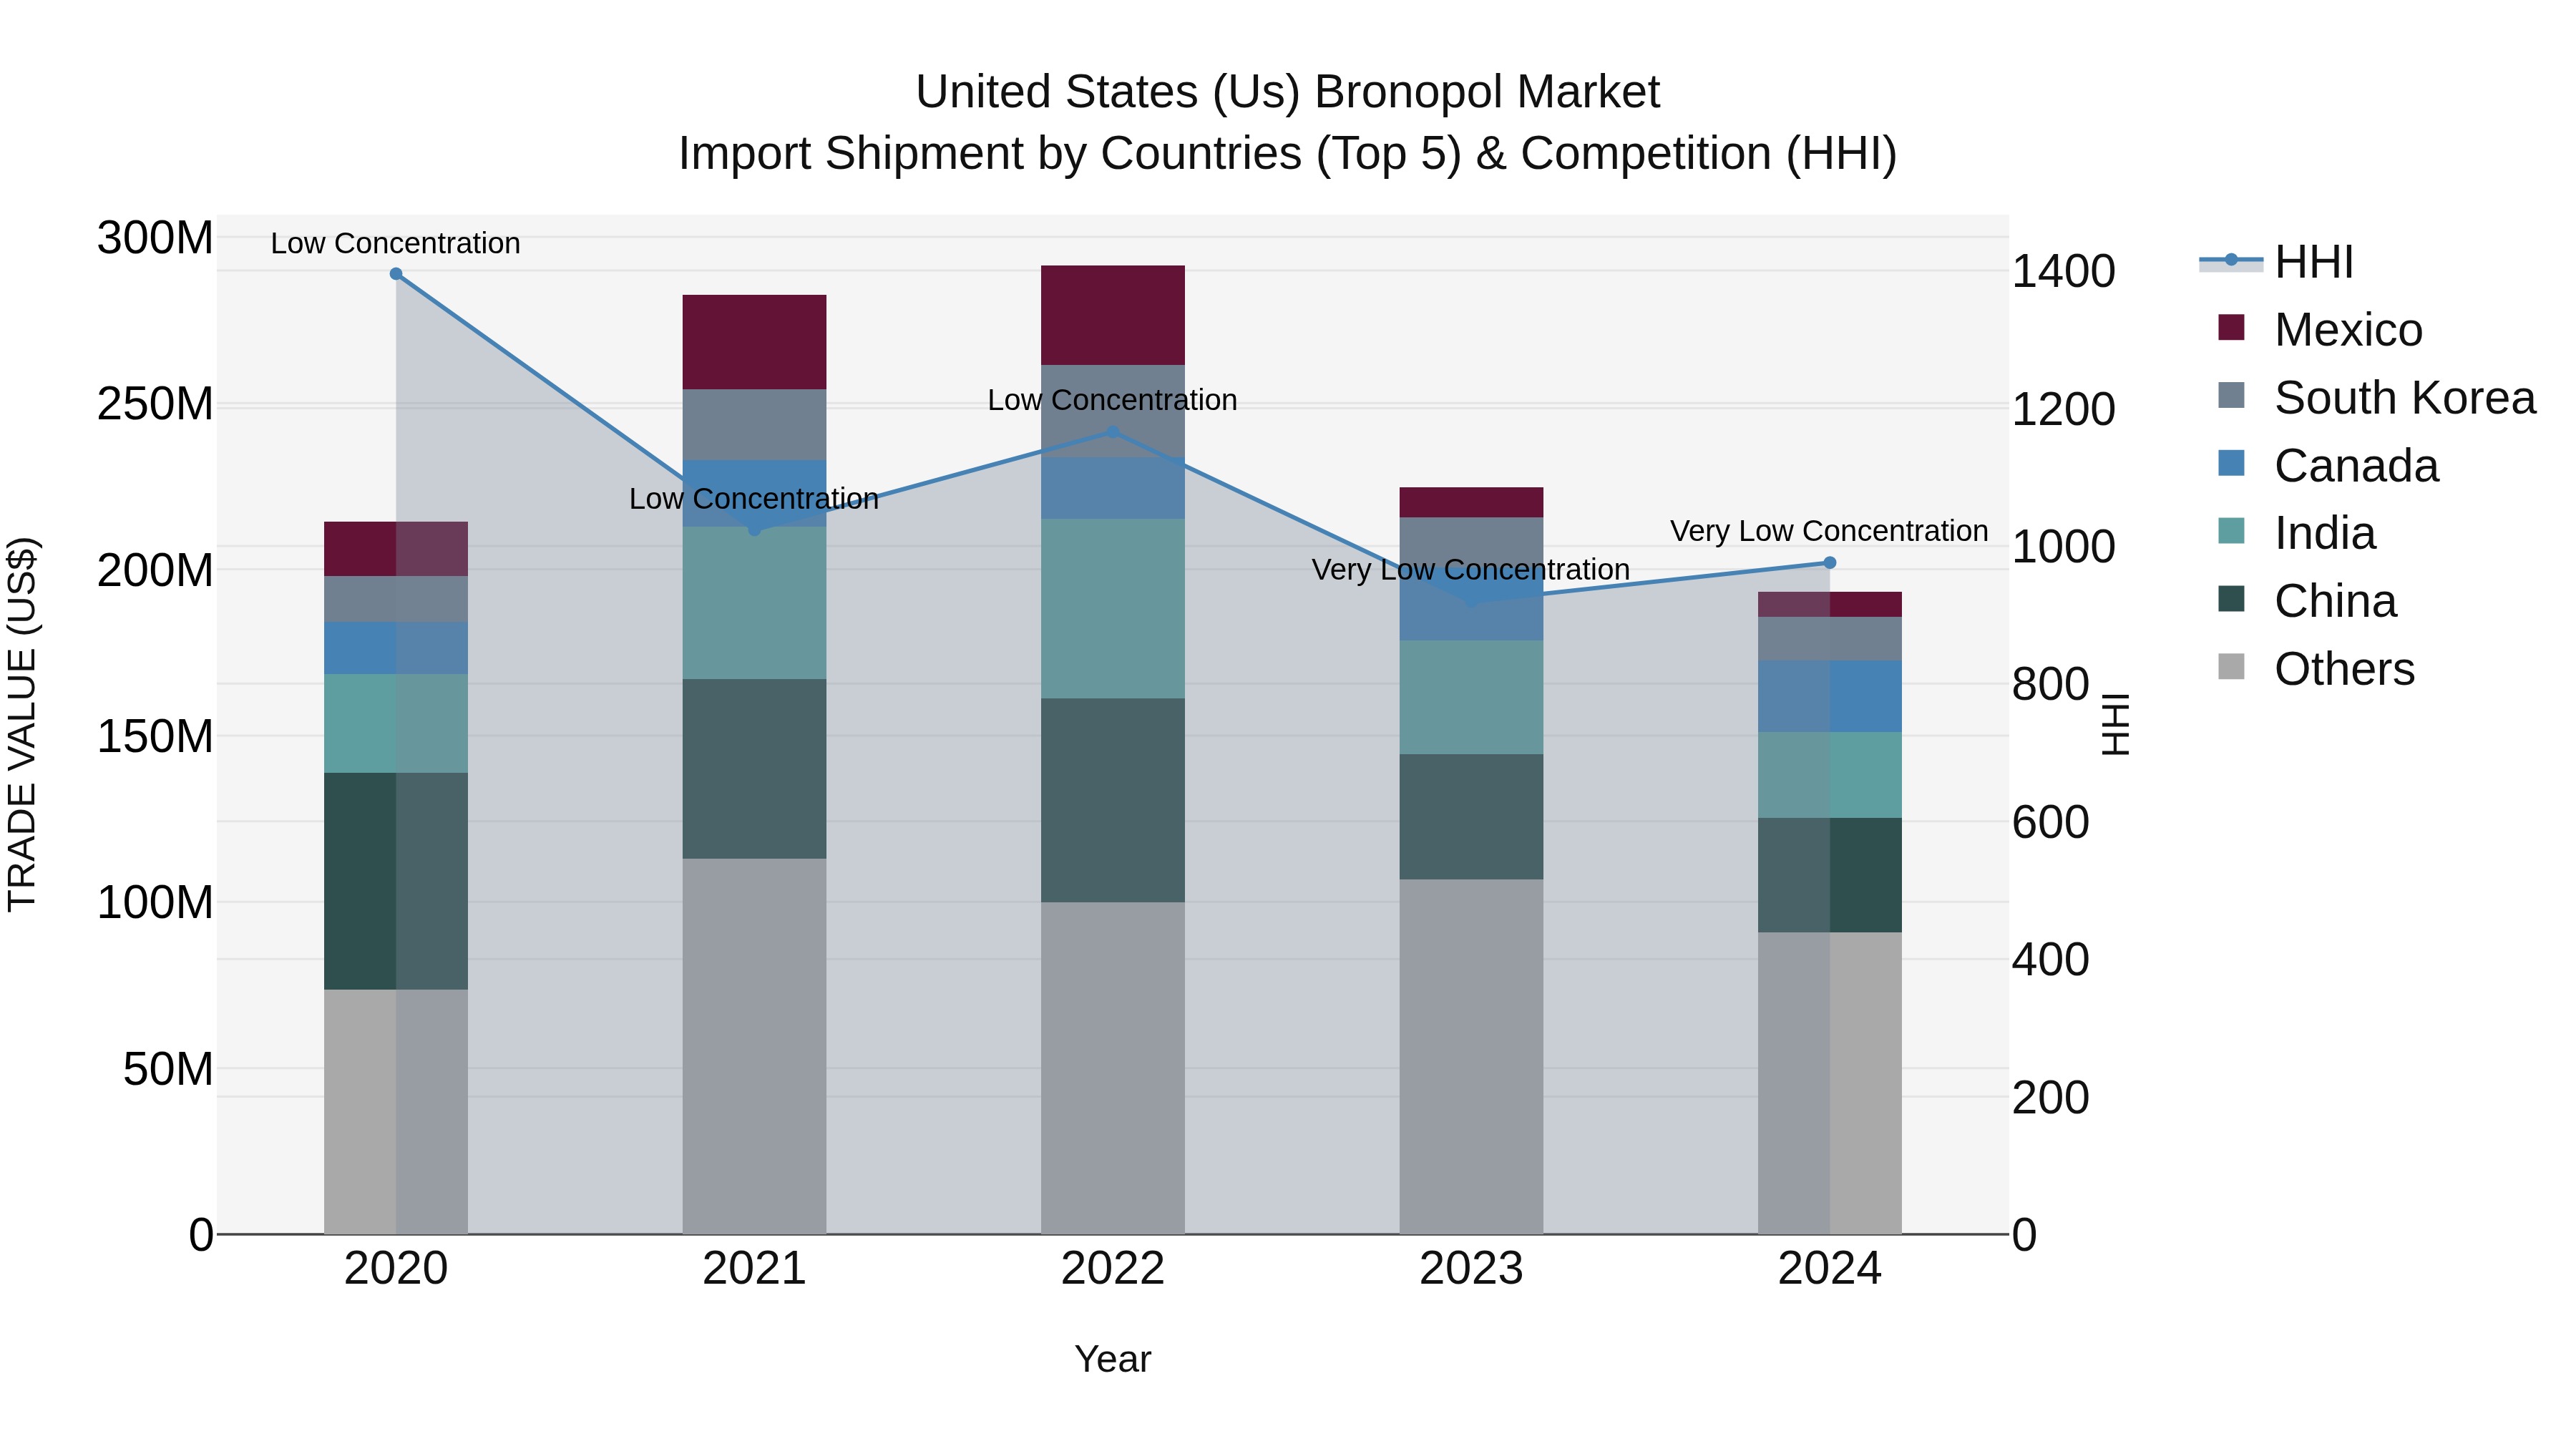
United States (US) Bronopol Market Top 5 Importing Countries and Market Competition (HHI) Analysis
In 2024, the United States continued to import Bronopol primarily from China, India, Taiwan, Canada, and Germany. The market showed low concentration with a low Herfindahl-Hirschman Index (HHI). The compound annual growth rate (CAGR) for Bronopol imports from 2020 to 2024 was -2.55%, indicating a slight decline over the period. Furthermore, the growth rate from 2023 to 2024 saw a significant drop of -13.99%, reflecting a challenging year for Bronopol imports into the USA. These statistics suggest a competitive market landscape and potential shifts in sourcing strategies for Bronopol in the coming years.
Key Highlights of the Report:
- United States (US) Bronopol Market Outlook
- Market Size of United States (US) Bronopol Market, 2025
- Forecast of United States (US) Bronopol Market, 2032
- Historical Data and Forecast of United States (US) Bronopol Revenues & Volume for the Period 2022 - 2032
- United States (US) Bronopol Market Trend Evolution
- United States (US) Bronopol Market Drivers and Challenges
- United States (US) Bronopol Price Trends
- United States (US) Bronopol Porter's Five Forces
- United States (US) Bronopol Industry Life Cycle
- Historical Data and Forecast of United States (US) Bronopol Market Revenues & Volume By Type for the Period 2022 - 2032
- Historical Data and Forecast of United States (US) Bronopol Market Revenues & Volume By Coagulants for the Period 2022 - 2032
- Historical Data and Forecast of United States (US) Bronopol Market Revenues & Volume By Flocculants for the Period 2022 - 2032
- Historical Data and Forecast of United States (US) Bronopol Market Revenues & Volume By Biocides for the Period 2022 - 2032
- Historical Data and Forecast of United States (US) Bronopol Market Revenues & Volume By Disinfectants for the Period 2022 - 2032
- Historical Data and Forecast of United States (US) Bronopol Market Revenues & Volume By PH Adjusters for the Period 2022 - 2032
- Historical Data and Forecast of United States (US) Bronopol Market Revenues & Volume By Stabilizers for the Period 2022 - 2032
- Historical Data and Forecast of United States (US) Bronopol Market Revenues & Volume By Inhibitors for the Period 2022 - 2032
- Historical Data and Forecast of United States (US) Coagulants Bronopol Market Revenues & Volume By Defoaming Agents for the Period 2022 - 2032
- Historical Data and Forecast of United States (US) Bronopol Market Revenues & Volume By Form for the Period 2022 - 2032
- Historical Data and Forecast of United States (US) Bronopol Market Revenues & Volume By Liquid for the Period 2022 - 2032
- Historical Data and Forecast of United States (US) Bronopol Market Revenues & Volume By Solid for the Period 2022 - 2032
- Historical Data and Forecast of United States (US) Bronopol Market Revenues & Volume By Application for the Period 2022 - 2032
- Historical Data and Forecast of United States (US) Bronopol Market Revenues & Volume By Water Treatment for the Period 2022 - 2032
- Historical Data and Forecast of United States (US) Bronopol Market Revenues & Volume By Formulators for the Period 2022 - 2032
- Historical Data and Forecast of United States (US) Bronopol Market Revenues & Volume By Oil and Gas for the Period 2022 - 2032
- Historical Data and Forecast of United States (US) Bronopol Market Revenues & Volume By Paper and Pulp for the Period 2022 - 2032
- Historical Data and Forecast of United States (US) Bronopol Market Revenues & Volume By Paints for the Period 2022 - 2032
- Historical Data and Forecast of United States (US) Bronopol Market Revenues & Volume By Coating for the Period 2022 - 2032
- Historical Data and Forecast of United States (US) Bronopol Market Revenues & Volume By Adhesives for the Period 2022 - 2032
- United States (US) Bronopol Import Export Trade Statistics
- Market Opportunity Assessment By Type
- Market Opportunity Assessment By Form
- Market Opportunity Assessment By Application
- United States (US) Bronopol Top Companies Market Share
- United States (US) Bronopol Competitive Benchmarking By Technical and Operational Parameters
- United States (US) Bronopol Company Profiles
- United States (US) Bronopol Key Strategic Recommendations
Frequently Asked Questions About the Market Study (FAQs):
6Wresearch actively monitors the United States (US) Bronopol Market and publishes its comprehensive annual report, highlighting emerging trends, growth drivers, revenue analysis, and forecast outlook. Our insights help businesses to make data-backed strategic decisions with ongoing market dynamics. Our analysts track relevent industries related to the United States (US) Bronopol Market, allowing our clients with actionable intelligence and reliable forecasts tailored to emerging regional needs.
Yes, we provide customisation as per your requirements. To learn more, feel free to contact us on sales@6wresearch.com
1 Executive Summary |
2 Introduction |
2.1 Key Highlights of the Report |
2.2 Report Description |
2.3 Market Scope & Segmentation |
2.4 Research Methodology |
2.5 Assumptions |
3 United States (US) Bronopol Market Overview |
3.1 United States (US) Country Macro Economic Indicators |
3.2 United States (US) Bronopol Market Revenues & Volume, 2022 & 2032F |
3.3 United States (US) Bronopol Market - Industry Life Cycle |
3.4 United States (US) Bronopol Market - Porter's Five Forces |
3.5 United States (US) Bronopol Market Revenues & Volume Share, By Type, 2022 & 2032F |
3.6 United States (US) Bronopol Market Revenues & Volume Share, By Form, 2022 & 2032F |
3.7 United States (US) Bronopol Market Revenues & Volume Share, By Application, 2022 & 2032F |
4 United States (US) Bronopol Market Dynamics |
4.1 Impact Analysis |
4.2 Market Drivers |
4.2.1 Increasing demand for bronopol as a preservative in various industries such as personal care, water treatment, and oil gas. |
4.2.2 Growing awareness about the need for clean and safe water systems, driving the adoption of bronopol in water treatment applications. |
4.2.3 Stringent regulations and guidelines pertaining to industrial hygiene and safety, leading to higher usage of bronopol as a biocide. |
4.3 Market Restraints |
4.3.1 Concerns regarding the environmental impact of bronopol leading to stricter regulations on its usage. |
4.3.2 Competition from alternative preservatives and biocides in the market. |
4.3.3 Fluctuating prices of raw materials used in the production of bronopol affecting profit margins of manufacturers. |
5 United States (US) Bronopol Market Trends |
6 United States (US) Bronopol Market, By Types |
6.1 United States (US) Bronopol Market, By Type |
6.1.1 Overview and Analysis |
6.1.2 United States (US) Bronopol Market Revenues & Volume, By Type, 2022 - 2032F |
6.1.3 United States (US) Bronopol Market Revenues & Volume, By Coagulants, 2022 - 2032F |
6.1.4 United States (US) Bronopol Market Revenues & Volume, By Flocculants, 2022 - 2032F |
6.1.5 United States (US) Bronopol Market Revenues & Volume, By Biocides, 2022 - 2032F |
6.1.6 United States (US) Bronopol Market Revenues & Volume, By Disinfectants, 2022 - 2032F |
6.1.7 United States (US) Bronopol Market Revenues & Volume, By PH Adjusters, 2022 - 2032F |
6.1.8 United States (US) Bronopol Market Revenues & Volume, By Stabilizers, 2022 - 2032F |
6.1.9 United States (US) Bronopol Market Revenues & Volume, By Defoaming Agents, 2022 - 2032F |
6.1.10 United States (US) Bronopol Market Revenues & Volume, By Defoaming Agents, 2022 - 2032F |
6.2 United States (US) Bronopol Market, By Form |
6.2.1 Overview and Analysis |
6.2.2 United States (US) Bronopol Market Revenues & Volume, By Liquid, 2022 - 2032F |
6.2.3 United States (US) Bronopol Market Revenues & Volume, By Solid, 2022 - 2032F |
6.3 United States (US) Bronopol Market, By Application |
6.3.1 Overview and Analysis |
6.3.2 United States (US) Bronopol Market Revenues & Volume, By Water Treatment, 2022 - 2032F |
6.3.3 United States (US) Bronopol Market Revenues & Volume, By Formulators, 2022 - 2032F |
6.3.4 United States (US) Bronopol Market Revenues & Volume, By Oil and Gas, 2022 - 2032F |
6.3.5 United States (US) Bronopol Market Revenues & Volume, By Paper and Pulp, 2022 - 2032F |
6.3.6 United States (US) Bronopol Market Revenues & Volume, By Paints, 2022 - 2032F |
6.3.7 United States (US) Bronopol Market Revenues & Volume, By Coating, 2022 - 2032F |
7 United States (US) Bronopol Market Import-Export Trade Statistics |
7.1 United States (US) Bronopol Market Export to Major Countries |
7.2 United States (US) Bronopol Market Imports from Major Countries |
8 United States (US) Bronopol Market Key Performance Indicators |
8.1 Percentage of bronopol usage in water treatment applications compared to other biocides. |
8.2 Number of regulatory approvals for bronopol in different industries. |
8.3 Research and development investment in finding eco-friendly alternatives to bronopol. |
9 United States (US) Bronopol Market - Opportunity Assessment |
9.1 United States (US) Bronopol Market Opportunity Assessment, By Type, 2022 & 2032F |
9.2 United States (US) Bronopol Market Opportunity Assessment, By Form, 2022 & 2032F |
9.3 United States (US) Bronopol Market Opportunity Assessment, By Application, 2022 & 2032F |
10 United States (US) Bronopol Market - Competitive Landscape |
10.1 United States (US) Bronopol Market Revenue Share, By Companies, 2025 |
10.2 United States (US) Bronopol Market Competitive Benchmarking, By Operating and Technical Parameters |
11 Company Profiles |
12 Recommendations |
13 Disclaimer |
Global Go To Market Strategy - 2030
Export potential enables firms to identify high-growth global markets with greater confidence by combining advanced trade intelligence with a structured quantitative methodology. The framework analyzes emerging demand trends and country-level import patterns while integrating macroeconomic and trade datasets such as GDP and population forecasts, bilateral import–export flows, tariff structures, elasticity differentials between developed and developing economies, geographic distance, and import demand projections. Using weighted trade values from 2020–2024 as the base period to project country-to-country export potential for 2030, these inputs are operationalized through calculated drivers such as gravity model parameters, tariff impact factors, and projected GDP per-capita growth. Through an analysis of hidden potentials, demand hotspots, and market conditions that are most favorable to success, this method enables firms to focus on target countries, maximize returns, and global expansion with data, backed by accuracy.
By factoring in the projected importer demand gap that is currently unmet and could be potential opportunity, it identifies the potential for the Exporter (Country) among 190 countries, against the general trade analysis, which identifies the biggest importer or exporter.
To discover high-growth global markets and optimize your business strategy:
Click Here
Pricing
- Single User License$ 1,995
- Department License$ 2,400
- Site License$ 3,120
- Global License$ 3,795

Leadership Perspectives from Industry Events
Search
Thought Leadership and Analyst Meet


Our Clients
6WResearch In News
- Doha a strategic location for EV manufacturing hub: IPA Qatar
- Demand for luxury TVs surging in the GCC, says Samsung
- Empowering Growth: The Thriving Journey of Bangladesh’s Cable Industry
- Demand for luxury TVs surging in the GCC, says Samsung
- Video call with a traditional healer? Once unthinkable, it’s now common in South Africa
- Intelligent Buildings To Smooth GCC’s Path To Net Zero
Latest Reports
- Taiwan Airport Wireless Infrastructure Market (2026-2032)
- Vietnam Airport Wireless Infrastructure Market (2026-2032)
- Thailand Airport Wireless Infrastructure Market (2026-2032)
- South Korea Airport Wireless Infrastructure Market (2026-2032)
- Romania Airport Wireless Infrastructure Market (2026-2032)
- Qatar Airport Wireless Infrastructure Market (2026-2032)
- Philippines Airport Wireless Infrastructure Market (2026-2032)
- Japan Airport Wireless Infrastructure Market (2026-2032)
- Taiwan Airport Winter Services Market (2026-2032)
- Vietnam Airport Winter Services Market (2026-2032)
Industry Events and Analyst Meet

HIMTEX 2026

India Refining Summit 2026

India EV Show 2026

EV tech India Expo 2026

Auto Tech Asia 2026
Whitepaper
- Middle East & Africa Commercial Security Market Click here to view more.
- Middle East & Africa Fire Safety Systems & Equipment Market Click here to view more.
- GCC Drone Market Click here to view more.
- Middle East Lighting Fixture Market Click here to view more.
- GCC Physical & Perimeter Security Market Click here to view more.