United States (US) Contactor Market (2026-2032) | Industry, COVID-19 IMPACT, Size, Analysis, Share, Companies, Forecast, Revenue, Value, Outlook, Growth & Trends
Market Forecast By Type (Solid-State Contactor, Magnetic Contactor, Vacuum Contactor, Lighting Contactor), By Product (DC Contactor, AC Contactor), By Poles (2-Pole, 3-Pole, 4-Pole, Others), By Voltage (Low Voltage (Up To 1 KV), Medium Voltage (1 KV – 7.2 KV), High Voltage (Above 7.2 KV)), By End-users (Automotive, Power, Oil & Gas, Food & Beverage, Construction, Data Centers, FA Robots , Others) And Competitive Landscape
| Product Code: ETC014001 | Publication Date: Jun 2023 | Updated Date: Jun 2026 | Product Type: Report | |
| Publisher: 6Wresearch | Author: Ravi Bhandari | No. of Pages: 70 | No. of Figures: 35 | No. of Tables: 5 |
United States (US) Contactor Market Summary
The united states (us) contactor market was estimated at USD 109 Million in 2025 and is projected to reach USD 128 Million by 2032, growing at a CAGR of 2.8% from 2026 to 2032.
United States (US) Contactor Market Growth Rate Analysis (2021-2032)
The U.S. contactor market experienced a notable rebound post-2021, with a growth rate of 5.9% in 2022 driven by increased investments in infrastructure and the ongoing energy transition. This upward trend continued into 2023 at 2.7%, supported by heightened consumer demand and advancements in industrial automation technologies. Forecasts indicate sustained growth through 2024, achieving 3.4%, as businesses further upgrade their electrical systems to enhance efficiency. Although growth rates may moderate to around 2.2% by 2032, the long-term outlook remains promising, bolstered by digitalization and evolving policy frameworks that prioritize sustainability and innovation within the sector. Overall, a cyclical pattern reflects the dynamic interplay of technological advancements and market demands.
United States (US) Contactor Market Year-wise Growth Rate and Key Drivers
This graph highlights how the United States (US) Contactor Market has steadily grown over the past five years, supported by major growth factors.
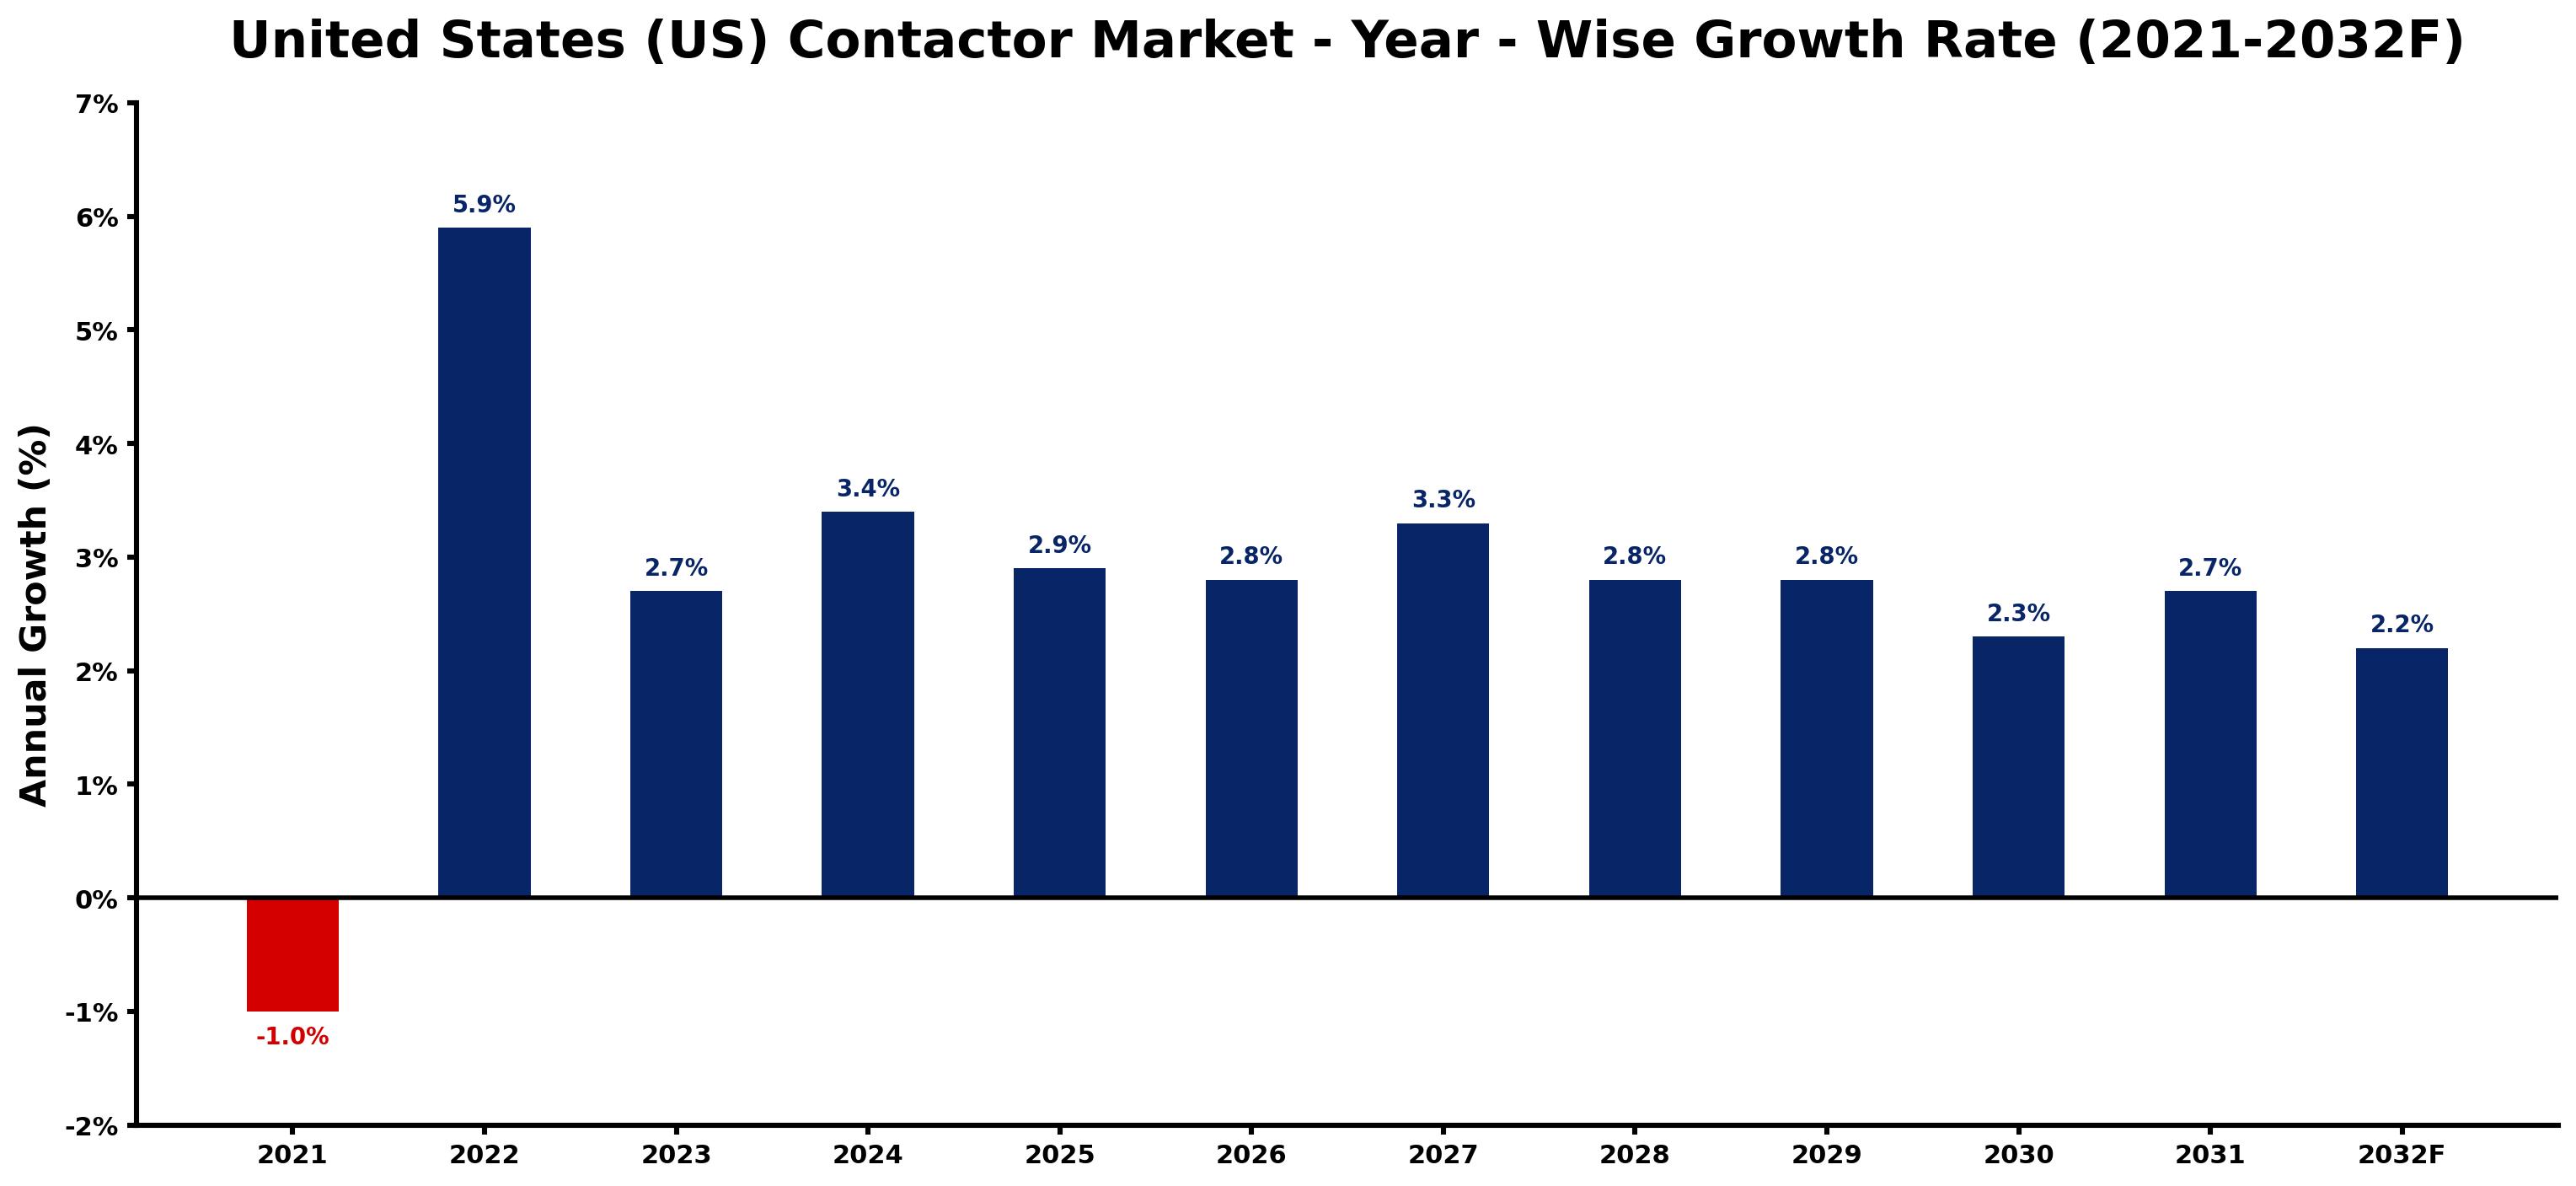
The table below presents the year wise growth rates along with the key drivers influencing the market
| Year | Growth Rate | Major Drivers |
| 2021 | -1.0% | Supply chain disruptions hindered project timelines, resulting in reduced demand for contractor services nationwide. |
| 2022 | 5.9% | Market consolidation leads to fewer, larger contractors dominating project bids effectively. |
| 2023 | 2.7% | Sustainability trends push contractors to adopt eco-friendly building materials consistently. |
| 2024 | 3.4% | Labor shortages compel firms to invest in automation and skilled training programs. |
| 2025 | 2.9% | Infrastructure spending plans create a surge in public sector construction initiatives. |
| 2026 | 2.8% | Technological integration enhances project management efficiency and reduces costs significantly. |
| 2027 | 3.3% | Urbanization drives demand for multifamily housing developments in metropolitan areas. |
| 2028 | 2.8% | Residential renovations gain momentum, fueled by increasing home values and equity. |
| 2029 | 2.8% | Green building certifications become essential differentiators in contractor competition. |
| 2030 | 2.3% | Smart technology adoption reshapes construction sites, improving safety and productivity metrics. |
| 2031 | 2.7% | Economic recovery boosts investment in commercial properties, expanding the contractor base. |
| 2032 | 2.2% | Aging infrastructure demands comprehensive upgrades, revitalizing public-private partnerships nationwide. |
Note - Market size estimations and growth projections presented in this report are based on 6Wresearch's advanced forecasting approach, validated with industry datasets as of June 2026.
United States (US) Contactor Market Synopsis
The United States (US) Contactor Market is projected to reach 2.8% and witness significant growth during the forecast period (2026-2032). The anticipated market value is estimated to be USD 4.02 billion by 2026, driven by a compound annual growth rate (CAGR) of 5.2%. This growth is fueled by various factors, including rising demand across multiple sectors, advancements in technology pertaining to contactors, and stringent governmental regulations aimed at enhancing energy efficiency. Furthermore, the ongoing investments by leading manufacturers are also playing a pivotal role in propelling the market forward.
United States (US) Contactor Market Growth Drivers
The growth trajectory of the United States (US) Contactor Market is primarily supported by several key factors:
- The increasing demand for contactors from various industries such as construction, manufacturing, and energy is a major driver. As businesses expand and modernize, their need for reliable electrical control solutions becomes critical.
- Technological advancements have led to the production of more efficient and reliable contactors. Innovations in materials and designs have resulted in products that offer improved performance, durability, and energy savings.
- Government regulations mandating higher energy efficiency standards are compelling industries to adopt advanced contactor solutions. This regulatory landscape is fostering a shift toward more sustainable practices.
- Investments in infrastructure and smart grid technology are creating opportunities for contactors, as these systems require robust electrical control mechanisms for optimal performance.
- An increasing focus on automation in various sectors is driving the demand for contactors, which are essential components in automated electrical systems, further solidifying their market position.
United States (US) Contactor Market Challenges and Restraints
Despite the promising growth outlook for the United States (US) Contactor Market, several challenges and restraints could impact its development:
- Intense competition among manufacturers can lead to price wars, potentially affecting profit margins and market sustainability.
- Fluctuations in raw material prices can hamper production costs, resulting in unpredictable pricing for end-users.
- The rapid pace of technological change necessitates continuous innovation from manufacturers, which can be resource-intensive.
- Regulatory changes concerning environmental standards may impose additional pressures on manufacturers to adapt their products, leading to increased compliance costs.
- Market saturation in certain segments may slow down growth rates, compelling companies to explore niche markets or innovative product offerings to differentiate themselves.
United States (US) Contactor Market Regional Analysis
The regional landscape of the United States (US) Contactor Market showcases various dynamics that contribute to its overall performance. Regions with significant industrial activities, such as the Midwest and West, exhibit higher demand for contactors due to their robust manufacturing and energy sectors. Moreover, states prioritizing renewable energy and sustainability initiatives are likely to see accelerated growth in contactor usage, aligning with governmental policies promoting energy efficiency. The South is experiencing growth driven by infrastructure development projects, further enhancing contractor adoption in this region.
United States (US) Contactor Market Government Investment and Initiatives
Government initiatives play a crucial role in shaping the United States (US) Contactor Market. Various policies aimed at promoting energy efficiency have led to increased public spending in this sector. The government is actively investing in infrastructure development and renewable energy projects, which necessitate advanced electrical solutions, including contactors. Additionally, incentives and grants aimed at upgrading energy systems in both public and private sectors are fostering greater adoption of efficient contactor technologies. These initiatives not only stimulate market growth but also promote sustainable practices within industries.
United States (US) Contactor Market Latest Developments (May 2025 - June 2026)
In the period from May 2025 to June 2026, the United States (US) Contactor Market has experienced a series of notable developments. The period has seen increased collaboration between manufacturers and technology firms to enhance product offerings, particularly in automation and energy management solutions. Furthermore, there has been a clear upward trend in the integration of IoT (Internet of Things) technologies within contactor systems, allowing for smarter operational capabilities. Regulatory bodies have introduced new energy efficiency standards, prompting manufacturers to innovate more robust and compliant products. Expectations remain positive for market performance as various industries continue to prioritize modernization and sustainability.
United States (US) Contactor Market - Key Attractiveness of the Report
- 10 Years of Market Numbers
- Historical Data Starting from 2022 to 2025
- Base Year: 2025
- Forecast Data until 2032
- Key Performance Indicators Impacting the Market
- Major Upcoming Developments and Projects
Key Highlights of the Report:
- United States (US) Contactor Market Outlook
- Market Size of United States (US) Contactor Market, 2025
- Forecast of United States (US) Contactor Market, 2032F
- Historical Data and Forecast of United States (US) Contactor Revenues & Volume for the Period 2022-2032F
- United States (US) Contactor Market Trend Evolution
- United States (US) Contactor Market Drivers and Challenges
- United States (US) Contactor Price Trends
- United States (US) Contactor Porter's Five Forces
- United States (US) Contactor Industry Life Cycle
- Historical Data and Forecast of United States (US) Contactor Market Revenues & Volume By Type for the Period 2022-2032F
- Historical Data and Forecast of United States (US) Contactor Market Revenues & Volume By Solid-State Contactor for the Period 2022-2032F
- Historical Data and Forecast of United States (US) Contactor Market Revenues & Volume By Magnetic Contactor for the Period 2022-2032F
- Historical Data and Forecast of United States (US) Contactor Market Revenues & Volume By Vacuum Contactor for the Period 2022-2032F
- Historical Data and Forecast of United States (US) Contactor Market Revenues & Volume By Lighting Contactor for the Period 2022-2032F
- Historical Data and Forecast of United States (US) Contactor Market Revenues & Volume By Product for the Period 2022-2032F
- Historical Data and Forecast of United States (US) Contactor Market Revenues & Volume By DC Contactor for the Period 2022-2032F
- Historical Data and Forecast of United States (US) Contactor Market Revenues & Volume By AC Contactor for the Period 2022-2032F
- Historical Data and Forecast of United States (US) Contactor Market Revenues & Volume By Poles for the Period 2022-2032F
- Historical Data and Forecast of United States (US) Contactor Market Revenues & Volume By 2-Pole for the Period 2022-2032F
- Historical Data and Forecast of United States (US) Contactor Market Revenues & Volume By 3-Pole for the Period 2022-2032F
- Historical Data and Forecast of United States (US) Contactor Market Revenues & Volume By 4-Pole for the Period 2022-2032F
- Historical Data and Forecast of United States (US) Contactor Market Revenues & Volume By Others for the Period 2022-2032F
- Historical Data and Forecast of United States (US) Contactor Market Revenues & Volume By Voltage for the Period 2022-2032F
- Historical Data and Forecast of United States (US) Contactor Market Revenues & Volume By Low Voltage (Up To 1 KV) for the Period 2022-2032F
- Historical Data and Forecast of United States (US) Contactor Market Revenues & Volume By Medium Voltage (1 KV ? 7.2 KV) for the Period 2022-2032F
- Historical Data and Forecast of United States (US) Contactor Market Revenues & Volume By High Voltage (Above 7.2 KV) for the Period 2022-2032F
- Historical Data and Forecast of United States (US) Contactor Market Revenues & Volume By End-users for the Period 2022-2032F
- Historical Data and Forecast of United States (US) Contactor Market Revenues & Volume By Automotive for the Period 2022-2032F
- Historical Data and Forecast of United States (US) Contactor Market Revenues & Volume By Power for the Period 2022-2032F
- Historical Data and Forecast of United States (US) Contactor Market Revenues & Volume By Oil & Gas for the Period 2022-2032F
- Historical Data and Forecast of United States (US) Contactor Market Revenues & Volume By Food & Beverage for the Period 2022-2032F
- Historical Data and Forecast of United States (US) Contactor Market Revenues & Volume By Construction for the Period 2022-2032F
- Historical Data and Forecast of United States (US) Contactor Market Revenues & Volume By Data Centers for the Period 2022-2032F
- Historical Data and Forecast of United States (US) Contactor Market Revenues & Volume By FA Robots for the Period 2022-2032F
- Historical Data and Forecast of United States (US) Contactor Market Revenues & Volume By Others for the Period 2022-2032F
- United States (US) Contactor Import Export Trade Statistics
- Market Opportunity Assessment By Type
- Market Opportunity Assessment By Product
- Market Opportunity Assessment By Poles
- Market Opportunity Assessment By Voltage
- Market Opportunity Assessment By End-users
- United States (US) Contactor Top Companies Market Share
- United States (US) Contactor Competitive Benchmarking By Technical and Operational Parameters
- United States (US) Contactor Company Profiles
- United States (US) Contactor Key Strategic Recommendations
Frequently Asked Questions About the Market Study (FAQs):
The growth is driven by increased demand across various industries, technological advancements, and government regulations focused on energy efficiency.
Key challenges include intense competition, fluctuations in raw material prices, and the need for continuous technological innovation.
Government initiatives are contributing to market growth by investing in infrastructure projects and promoting energy efficiency through regulations and incentives.
Recent developments include increased collaboration between manufacturers and technology firms, the integration of IoT technologies, and the introduction of new energy efficiency standards.
6Wresearch actively monitors the United States (US) Contactor Market and publishes its comprehensive annual report, highlighting emerging trends, growth drivers, revenue analysis, and forecast outlook. Our insights help businesses to make data-backed strategic decisions with ongoing market dynamics. Our analysts track relevent industries related to the United States (US) Contactor Market, allowing our clients with actionable intelligence and reliable forecasts tailored to emerging regional needs.
Yes, we provide customisation as per your requirements. To learn more, feel free to contact us on sales@6wresearch.com
1 Executive Summary |
2 Introduction |
2.1 Key Highlights of the Report |
2.2 Report Description |
2.3 Market Scope & Segmentation |
2.4 Research Methodology |
2.5 Assumptions |
3 United States (US) Contactor Market Overview |
3.1 United States (US) Country Macro Economic Indicators |
3.2 United States (US) Contactor Market Revenues & Volume, 2022 & 2032F |
3.3 United States (US) Contactor Market - Industry Life Cycle |
3.4 United States (US) Contactor Market - Porter's Five Forces |
3.5 United States (US) Contactor Market Revenues & Volume Share, By Type, 2022 & 2032F |
3.6 United States (US) Contactor Market Revenues & Volume Share, By Product, 2022 & 2032F |
3.7 United States (US) Contactor Market Revenues & Volume Share, By Poles, 2022 & 2032F |
3.8 United States (US) Contactor Market Revenues & Volume Share, By Voltage, 2022 & 2032F |
3.9 United States (US) Contactor Market Revenues & Volume Share, By End-users, 2022 & 2032F |
4 United States (US) Contactor Market Dynamics |
4.1 Impact Analysis |
4.2 Market Drivers |
4.3 Market Restraints |
5 United States (US) Contactor Market Trends |
6 United States (US) Contactor Market, By Types |
6.1 United States (US) Contactor Market, By Type |
6.1.1 Overview and Analysis |
6.1.2 United States (US) Contactor Market Revenues & Volume, By Type, 2022-2032F |
6.1.3 United States (US) Contactor Market Revenues & Volume, By Solid-State Contactor, 2022-2032F |
6.1.4 United States (US) Contactor Market Revenues & Volume, By Magnetic Contactor, 2022-2032F |
6.1.5 United States (US) Contactor Market Revenues & Volume, By Vacuum Contactor, 2022-2032F |
6.1.6 United States (US) Contactor Market Revenues & Volume, By Lighting Contactor, 2022-2032F |
6.2 United States (US) Contactor Market, By Product |
6.2.1 Overview and Analysis |
6.2.2 United States (US) Contactor Market Revenues & Volume, By DC Contactor, 2022-2032F |
6.2.3 United States (US) Contactor Market Revenues & Volume, By AC Contactor, 2022-2032F |
6.3 United States (US) Contactor Market, By Poles |
6.3.1 Overview and Analysis |
6.3.2 United States (US) Contactor Market Revenues & Volume, By 2-Pole, 2022-2032F |
6.3.3 United States (US) Contactor Market Revenues & Volume, By 3-Pole, 2022-2032F |
6.3.4 United States (US) Contactor Market Revenues & Volume, By 4-Pole, 2022-2032F |
6.3.5 United States (US) Contactor Market Revenues & Volume, By Others, 2022-2032F |
6.4 United States (US) Contactor Market, By Voltage |
6.4.1 Overview and Analysis |
6.4.2 United States (US) Contactor Market Revenues & Volume, By Low Voltage (Up To 1 KV), 2022-2032F |
6.4.3 United States (US) Contactor Market Revenues & Volume, By Medium Voltage (1 KV ? 7.2 KV), 2022-2032F |
6.4.4 United States (US) Contactor Market Revenues & Volume, By High Voltage (Above 7.2 KV), 2022-2032F |
6.5 United States (US) Contactor Market, By End-users |
6.5.1 Overview and Analysis |
6.5.2 United States (US) Contactor Market Revenues & Volume, By Automotive, 2022-2032F |
6.5.3 United States (US) Contactor Market Revenues & Volume, By Power, 2022-2032F |
6.5.4 United States (US) Contactor Market Revenues & Volume, By Oil & Gas, 2022-2032F |
6.5.5 United States (US) Contactor Market Revenues & Volume, By Food & Beverage, 2022-2032F |
6.5.6 United States (US) Contactor Market Revenues & Volume, By Construction, 2022-2032F |
6.5.7 United States (US) Contactor Market Revenues & Volume, By Data Centers, 2022-2032F |
6.5.8 United States (US) Contactor Market Revenues & Volume, By Others, 2022-2032F |
6.5.9 United States (US) Contactor Market Revenues & Volume, By Others, 2022-2032F |
7 United States (US) Contactor Market Import-Export Trade Statistics |
7.1 United States (US) Contactor Market Export to Major Countries |
7.2 United States (US) Contactor Market Imports from Major Countries |
8 United States (US) Contactor Market Key Performance Indicators |
9 United States (US) Contactor Market - Opportunity Assessment |
9.1 United States (US) Contactor Market Opportunity Assessment, By Type, 2022 & 2032F |
9.2 United States (US) Contactor Market Opportunity Assessment, By Product, 2022 & 2032F |
9.3 United States (US) Contactor Market Opportunity Assessment, By Poles, 2022 & 2032F |
9.4 United States (US) Contactor Market Opportunity Assessment, By Voltage, 2022 & 2032F |
9.5 United States (US) Contactor Market Opportunity Assessment, By End-users, 2022 & 2032F |
10 United States (US) Contactor Market - Competitive Landscape |
10.1 United States (US) Contactor Market Revenue Share, By Companies, 2025 |
10.2 United States (US) Contactor Market Competitive Benchmarking, By Operating and Technical Parameters |
11 Company Profiles |
12 Recommendations |
13 Disclaimer |
Global Go To Market Strategy - 2030
Export potential enables firms to identify high-growth global markets with greater confidence by combining advanced trade intelligence with a structured quantitative methodology. The framework analyzes emerging demand trends and country-level import patterns while integrating macroeconomic and trade datasets such as GDP and population forecasts, bilateral import–export flows, tariff structures, elasticity differentials between developed and developing economies, geographic distance, and import demand projections. Using weighted trade values from 2020–2024 as the base period to project country-to-country export potential for 2030, these inputs are operationalized through calculated drivers such as gravity model parameters, tariff impact factors, and projected GDP per-capita growth. Through an analysis of hidden potentials, demand hotspots, and market conditions that are most favorable to success, this method enables firms to focus on target countries, maximize returns, and global expansion with data, backed by accuracy.
By factoring in the projected importer demand gap that is currently unmet and could be potential opportunity, it identifies the potential for the Exporter (Country) among 190 countries, against the general trade analysis, which identifies the biggest importer or exporter.
To discover high-growth global markets and optimize your business strategy:
Click Here
Pricing
- Single User License$ 1,995
- Department License$ 2,400
- Site License$ 3,120
- Global License$ 3,795

Leadership Perspectives from Industry Events
Search
Thought Leadership and Analyst Meet


Our Clients
6WResearch In News
- India Air Conditioner Market Set for Strong Rebound in 2026 After Weather-Led Correction and GST-Driven Recovery: 6Wresearch
- ADAS in India: How Automatic Emergency Braking, Blind Spot Detection & Driver Monitoring are Transforming Road Safety
- Doha a strategic location for EV manufacturing hub: IPA Qatar
- Demand for luxury TVs surging in the GCC, says Samsung
- Empowering Growth: The Thriving Journey of Bangladesh’s Cable Industry
- Demand for luxury TVs surging in the GCC, says Samsung
Latest Reports
- Nicaragua RPG Gaming Market (2026-2032)
- New Zealand RPG Gaming Market (2026-2032)
- Netherlands RPG Gaming Market (2026-2032)
- Nauru RPG Gaming Market (2026-2032)
- Namibia RPG Gaming Market (2026-2032)
- Mozambique RPG Gaming Market (2026-2032)
- Montenegro RPG Gaming Market (2026-2032)
- Mongolia RPG Gaming Market (2026-2032)
- Monaco RPG Gaming Market (2026-2032)
- Micronesia RPG Gaming Market (2026-2032)
Industry Events and Analyst Meet

HIMTEX 2026

India Refining Summit 2026

India EV Show 2026

EV tech India Expo 2026

Auto Tech Asia 2026
Whitepaper
- Middle East & Africa Commercial Security Market Click here to view more.
- Middle East & Africa Fire Safety Systems & Equipment Market Click here to view more.
- GCC Drone Market Click here to view more.
- Middle East Lighting Fixture Market Click here to view more.
- GCC Physical & Perimeter Security Market Click here to view more.