United States (US) Electronic Products Market (2026-2032) Outlook | Industry, Revenue, Companies, Analysis, Size, Share, Value, Trends, Forecast & Growth
Market Forecast By Type (Audio And Video Equipment, Semiconductor, Other Electronic Component), By End-Use (B2B, B2C), By Sales Channel (OEM, Aftermarket), By Mode (Online, Offline) And Competitive Landscape
| Product Code: ETC430917 | Publication Date: Oct 2022 | Updated Date: Jul 2026 | Product Type: Market Research Report | |
| Publisher: 6Wresearch | Author: Shubham Deep | No. of Pages: 75 | No. of Figures: 35 | No. of Tables: 20 |
United States (US) Electronic Products Market Size, Share & Growth Rate
The United States (US) Electronic Products Market was estimated at USD 135 Million in 2025 and is projected to reach USD 159 Million by 2032, growing at a CAGR of 2.4% from 2026 to 2032. This growth trajectory is primarily driven by the relentless pace of technological innovation, shifting consumer preferences towards smart and eco-friendly devices, and the increasing integration of advanced connectivity solutions such as 5G. Furthermore, the surge in e-commerce has transformed the way consumers purchase electronic products, making convenience a significant driver in this evolving market landscape.
United States (US) Electronic Products Market Year-wise Growth Rate and Key Drivers
This graph highlights how the United States (US) Electronic Products Market has steadily grown over the years, supported by major growth factors.
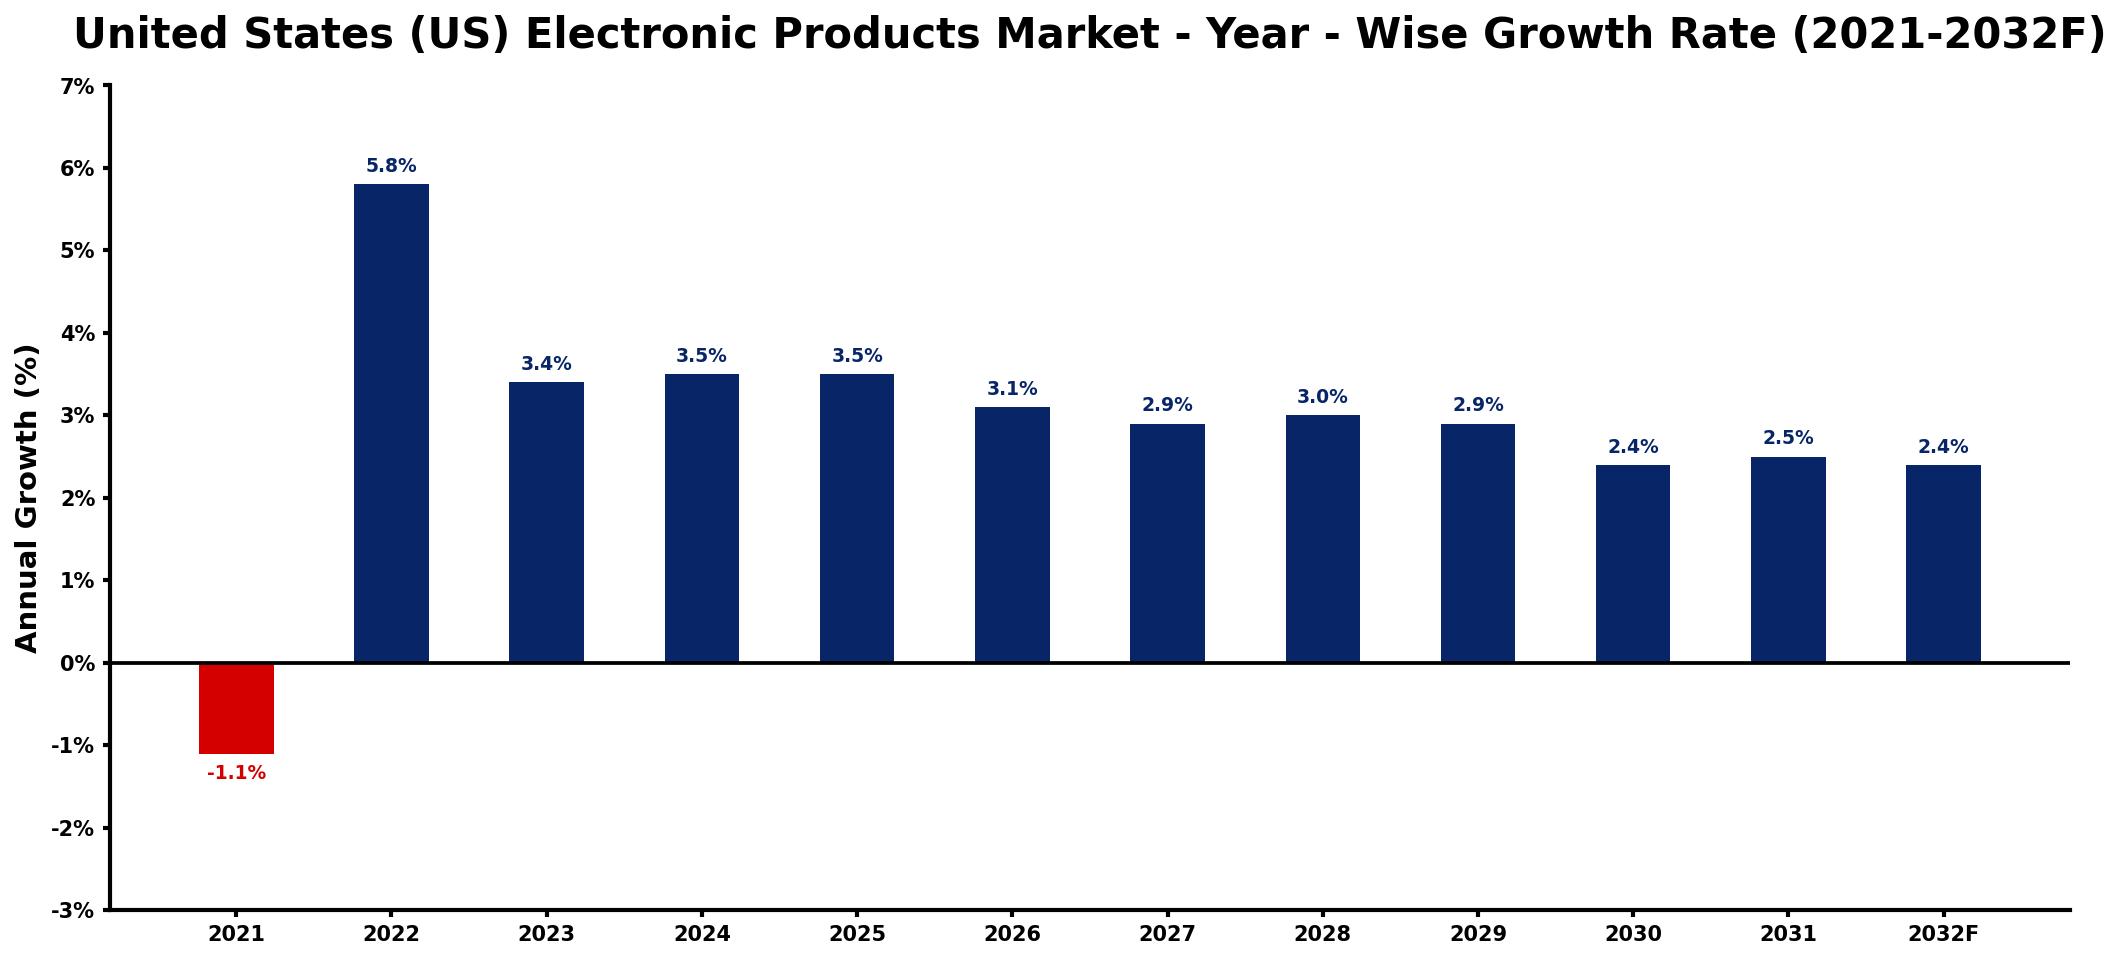
The table below presents the year‑wise growth rates along with the key drivers influencing the market
| Year | Growth Rate | Major Drivers |
| 2021 | -1.1% | shifted consumer spending patterns |
| 2022 | 5.8% | increased demand for smart devices |
| 2023 | 3.4% | growth in renewable energy applications |
| 2024 | 3.5% | expansion of home automation systems |
| 2025 | 3.5% | surge in cloud computing investments |
| 2026 | 3.1% | rise in remote work solutions |
| 2027 | 2.9% | enhanced connectivity infrastructure investments |
| 2028 | 3.0% | adoption of AI technologies increases |
| 2029 | 2.9% | development of 5G networks accelerates |
| 2030 | 2.4% | growing emerging market penetration |
| 2031 | 2.5% | emergence of sustainable technologies |
| 2032 | 2.4% | advancements in IoT applications |
Note: Market size estimations and growth projections presented in this report are based on 6Wresearch's proprietary forecasting methodology, utilizing the latest available industry data, government publications, and primary research inputs.
United States (US) Electronic Products Market Synopsis
The US Electronic Products Market is characterized by rapid technological advancements and an ever-growing consumer appetite for innovative gadgets. With the rise of smart home technologies and connected devices, the market is undergoing a significant transformation, catering to increasingly tech-savvy consumers.
In this highly competitive landscape, major players are continuously investing in research and development to introduce cutting-edge products. The blend of consumer demand for energy-efficient solutions and the proliferation of online shopping is reshaping the distribution dynamics, further elevating the market's potential for growth.
United States (US) Electronic Products Market Key Takeaways
- The market is evolving rapidly, with smart and connected devices leading consumer preferences.
- Energy efficiency is becoming a key purchasing factor for consumers across all product segments.
- Online sales channels are increasingly favored due to convenience and competitive pricing.
- Technological advancements, particularly in AI and IoT, are driving product innovation.
- The landscape is shaped by major players consistently pushing for new product releases and improvements.
Evaluation of Restraints in United States (US) Electronic Products Market
Despite its promising growth, the United States Electronic Products Market faces several restraints. The rapid pace of technological advancements can lead to shorter product lifecycles, challenging companies to continuously innovate while managing costs effectively. Smaller firms may struggle to keep up, as substantial investments in research and development are necessary to remain competitive. Furthermore, supply chain disruptions, including component shortages and geopolitical trade tensions, can hinder production and distribution capabilities. Compliance with regulatory standards, particularly those concerning data privacy and product safety, adds another layer of complexity, demanding strategic planning and adaptability from market players.
United States (US) Electronic Products Market Trends
Current trends in the US Electronic Products Market showcase a strong shift towards smart home devices that enhance connectivity and convenience. Products such as smart speakers, security systems, and energy-efficient appliances are seeing increasing adoption. Furthermore, the surge in consumer interest for sustainable solutions has led to a rise in solar-powered gadgets and energy-efficient electronics. Technologies like 5G and artificial intelligence are further influencing product development, as manufacturers explore their applications in innovative devices such as wearables and virtual reality systems. The growing e-commerce sector is also reshaping consumer buying behaviors, leading to an increasing number of online purchases.
United States (US) Electronic Products Market Opportunities
The US Electronic Products Market presents lucrative investment opportunities across various segments. Areas of significant potential include the development of smart devices and healthcare technologies that integrate with IoT and AI. As consumers prioritize energy efficiency and sustainability, there is room for growth in renewable energy technologies and eco-friendly electronic products. Additionally, companies focusing on cutting-edge advancements and unique innovations are well-positioned to capitalize on emerging consumer trends. Investing in companies with a strong e-commerce presence can also yield favorable returns as online shopping continues to dominate the retail landscape.
Government Initiatives in the United States (US) Electronic Products Market
The US government has enacted various policies aimed at ensuring consumer safety and encouraging innovation in the electronic products market. Regulatory agencies like the Federal Trade Commission (FTC) and the Environmental Protection Agency (EPA) play vital roles in managing standards and compliance related to product safety and electronic waste management. Furthermore, policies addressing cybersecurity concerns and consumer protection are continuously evolving to adapt to market dynamics. By promoting competition and establishing guidelines for fair practices, government initiatives help foster a stable environment for market participants.
Future Insights of the United States (US) Electronic Products Market
Looking ahead to 2026-2032, the United States Electronic Products Market is anticipated to flourish, driven by ongoing technological advancements and an increasing consumer inclination towards smart devices and automation. Market growth will be particularly strong in segments like wearables, IoT technologies, and smart home products, propelled by the rollout of 5G technology. However, challenges such as supply chain vulnerabilities and evolving regulatory frameworks will require companies to remain agile and innovative. Overall, the market is set to thrive as it adapts to the changing landscape and meets the diverse demands of consumers.
United States (US) Electronic Products Market Latest Developments (2025 - 2026)
Recent developments in the US Electronic Products Market indicate a heightened focus on sustainability and smart technology integration. Companies are increasingly prioritizing research and development efforts aimed at creating energy-efficient products and enhancing consumer experiences through connectivity. Collaborations between technology firms are becoming more common as industry players seek to harness synergies in innovation. Additionally, the rise of regulatory scrutiny regarding data protection and environmental standards is prompting organizations to reevaluate their compliance strategies to maintain market competitiveness.
United States (US) Electronic Products Market - Key Attractiveness of the Report
- 10 Years of Market Numbers
- Historical Data Starting from 2022 to 2025
- Base Year: 2025
- Forecast Data until 2032
- Key Performance Indicators Impacting the Market
- Major Upcoming Developments and Projects
Key Highlights of the Report:
- United States (US) Electronic Products Market Outlook
- Market Size of United States (US) Electronic Products Market, 2025
- Forecast of United States (US) Electronic Products Market, 2032
- Historical Data and Forecast of United States (US) Electronic Products Revenues & Volume for the Period 2022-2032F
- United States (US) Electronic Products Market Trend Evolution
- United States (US) Electronic Products Market Drivers and Challenges
- United States (US) Electronic Products Price Trends
- United States (US) Electronic Products Porter's Five Forces
- United States (US) Electronic Products Industry Life Cycle
- Historical Data and Forecast of United States (US) Electronic Products Market Revenues & Volume By Type for the Period 2022-2032F
- Historical Data and Forecast of United States (US) Electronic Products Market Revenues & Volume By Audio And Video Equipment for the Period 2022-2032F
- Historical Data and Forecast of United States (US) Electronic Products Market Revenues & Volume By Semiconductor for the Period 2022-2032F
- Historical Data and Forecast of United States (US) Electronic Products Market Revenues & Volume By Other Electronic Component for the Period 2022-2032F
- Historical Data and Forecast of United States (US) Electronic Products Market Revenues & Volume By End-Use for the Period 2022-2032F
- Historical Data and Forecast of United States (US) Electronic Products Market Revenues & Volume By B2B for the Period 2022-2032F
- Historical Data and Forecast of United States (US) Electronic Products Market Revenues & Volume By B2C for the Period 2022-2032F
- Historical Data and Forecast of United States (US) Electronic Products Market Revenues & Volume By Sales Channel for the Period 2022-2032F
- Historical Data and Forecast of United States (US) Electronic Products Market Revenues & Volume By OEM for the Period 2022-2032F
- Historical Data and Forecast of United States (US) Electronic Products Market Revenues & Volume By Aftermarket for the Period 2022-2032F
- Historical Data and Forecast of United States (US) Electronic Products Market Revenues & Volume By Mode for the Period 2022-2032F
- Historical Data and Forecast of United States (US) Electronic Products Market Revenues & Volume By Online for the Period 2022-2032F
- Historical Data and Forecast of United States (US) Electronic Products Market Revenues & Volume By Offline for the Period 2022-2032F
- United States (US) Electronic Products Import Export Trade Statistics
- Market Opportunity Assessment By Type
- Market Opportunity Assessment By End-Use
- Market Opportunity Assessment By Sales Channel
- Market Opportunity Assessment By Mode
- United States (US) Electronic Products Top Companies Market Share
- United States (US) Electronic Products Competitive Benchmarking By Technical and Operational Parameters
- United States (US) Electronic Products Company Profiles
- United States (US) Electronic Products Key Strategic Recommendations
Frequently Asked Questions About the Market Study (FAQs):
The market is expected to grow at a CAGR of 2.4% from 2026 to 2032, with the market size estimated to reach USD 159 Million by 2032.
E-commerce is increasingly driving sales in the electronic products market, offering consumers convenience and competitive pricing, which has led to a significant shift in purchasing behaviors.
The demand for smart home devices is reshaping consumer choices by prioritizing connectivity and convenience, resulting in greater adoption of products like smart speakers and security systems.
Key growth factors include advancements in technology, rising consumer demand for smart and energy-efficient devices, and the influence of e-commerce on purchasing patterns.
Government regulations are essential in shaping the electronic products market by ensuring compliance with safety standards, promoting competition, and addressing emerging concerns related to cybersecurity and environmental sustainability.
6Wresearch actively monitors the United States (US) Electronic Products Market and publishes its comprehensive annual report, highlighting emerging trends, growth drivers, revenue analysis, and forecast outlook. Our insights help businesses to make data-backed strategic decisions with ongoing market dynamics. Our analysts track relevent industries related to the United States (US) Electronic Products Market, allowing our clients with actionable intelligence and reliable forecasts tailored to emerging regional needs.
Yes, we provide customisation as per your requirements. To learn more, feel free to contact us on sales@6wresearch.com
1 Executive Summary |
2 Introduction |
2.1 Key Highlights of the Report |
2.2 Report Description |
2.3 Market Scope & Segmentation |
2.4 Research Methodology |
2.5 Assumptions |
3 United States (US) Electronic Products Market Overview |
3.1 United States (US) Country Macro Economic Indicators |
3.2 United States (US) Electronic Products Market Revenues & Volume, 2022 & 2032F |
3.3 United States (US) Electronic Products Market - Industry Life Cycle |
3.4 United States (US) Electronic Products Market - Porter's Five Forces |
3.5 United States (US) Electronic Products Market Revenues & Volume Share, By Type, 2022 & 2032F |
3.6 United States (US) Electronic Products Market Revenues & Volume Share, By End-Use, 2022 & 2032F |
3.7 United States (US) Electronic Products Market Revenues & Volume Share, By Sales Channel, 2022 & 2032F |
3.8 United States (US) Electronic Products Market Revenues & Volume Share, By Mode, 2022 & 2032F |
4 United States (US) Electronic Products Market Dynamics |
4.1 Impact Analysis |
4.2 Market Drivers |
4.2.1 Technological advancements and innovations in electronic products |
4.2.2 Increasing demand for smart home devices and wearable technology |
4.2.3 Growing adoption of Internet of Things (IoT) devices in various sectors |
4.3 Market Restraints |
4.3.1 Increasing competition among electronic product manufacturers |
4.3.2 Supply chain disruptions and component shortages |
4.3.3 Regulatory challenges related to product safety and environmental concerns |
5 United States (US) Electronic Products Market Trends |
6 United States (US) Electronic Products Market, By Types |
6.1 United States (US) Electronic Products Market, By Type |
6.1.1 Overview and Analysis |
6.1.2 United States (US) Electronic Products Market Revenues & Volume, By Type, 2022-2032F |
6.1.3 United States (US) Electronic Products Market Revenues & Volume, By Audio And Video Equipment, 2022-2032F |
6.1.4 United States (US) Electronic Products Market Revenues & Volume, By Semiconductor, 2022-2032F |
6.1.5 United States (US) Electronic Products Market Revenues & Volume, By Other Electronic Component, 2022-2032F |
6.2 United States (US) Electronic Products Market, By End-Use |
6.2.1 Overview and Analysis |
6.2.2 United States (US) Electronic Products Market Revenues & Volume, By B2B, 2022-2032F |
6.2.3 United States (US) Electronic Products Market Revenues & Volume, By B2C, 2022-2032F |
6.3 United States (US) Electronic Products Market, By Sales Channel |
6.3.1 Overview and Analysis |
6.3.2 United States (US) Electronic Products Market Revenues & Volume, By OEM, 2022-2032F |
6.3.3 United States (US) Electronic Products Market Revenues & Volume, By Aftermarket, 2022-2032F |
6.4 United States (US) Electronic Products Market, By Mode |
6.4.1 Overview and Analysis |
6.4.2 United States (US) Electronic Products Market Revenues & Volume, By Online, 2022-2032F |
6.4.3 United States (US) Electronic Products Market Revenues & Volume, By Offline, 2022-2032F |
7 United States (US) Electronic Products Market Import-Export Trade Statistics |
7.1 United States (US) Electronic Products Market Export to Major Countries |
7.2 United States (US) Electronic Products Market Imports from Major Countries |
8 United States (US) Electronic Products Market Key Performance Indicators |
8.1 Average selling price (ASP) of electronic products |
8.2 Adoption rate of new technologies in electronic products |
8.3 Customer satisfaction and retention rates with electronic products |
8.4 Rate of return on investment (ROI) for research and development in electronic products |
8.5 Number of patents filed for electronic product innovations |
9 United States (US) Electronic Products Market - Opportunity Assessment |
9.1 United States (US) Electronic Products Market Opportunity Assessment, By Type, 2022 & 2032F |
9.2 United States (US) Electronic Products Market Opportunity Assessment, By End-Use, 2022 & 2032F |
9.3 United States (US) Electronic Products Market Opportunity Assessment, By Sales Channel, 2022 & 2032F |
9.4 United States (US) Electronic Products Market Opportunity Assessment, By Mode, 2022 & 2032F |
10 United States (US) Electronic Products Market - Competitive Landscape |
10.1 United States (US) Electronic Products Market Revenue Share, By Companies, 2025 |
10.2 United States (US) Electronic Products Market Competitive Benchmarking, By Operating and Technical Parameters |
11 Company Profiles |
12 Recommendations |
13 Disclaimer |
Global Go To Market Strategy - 2030
Export potential enables firms to identify high-growth global markets with greater confidence by combining advanced trade intelligence with a structured quantitative methodology. The framework analyzes emerging demand trends and country-level import patterns while integrating macroeconomic and trade datasets such as GDP and population forecasts, bilateral import–export flows, tariff structures, elasticity differentials between developed and developing economies, geographic distance, and import demand projections. Using weighted trade values from 2020–2024 as the base period to project country-to-country export potential for 2030, these inputs are operationalized through calculated drivers such as gravity model parameters, tariff impact factors, and projected GDP per-capita growth. Through an analysis of hidden potentials, demand hotspots, and market conditions that are most favorable to success, this method enables firms to focus on target countries, maximize returns, and global expansion with data, backed by accuracy.
By factoring in the projected importer demand gap that is currently unmet and could be potential opportunity, it identifies the potential for the Exporter (Country) among 190 countries, against the general trade analysis, which identifies the biggest importer or exporter.
To discover high-growth global markets and optimize your business strategy:
Click Here
Pricing
- Single User License$ 1,995
- Department License$ 2,400
- Site License$ 3,120
- Global License$ 3,795

Leadership Perspectives from Industry Events
Search
Thought Leadership and Analyst Meet


Our Clients
6WResearch In News
- India Air Conditioner Market Set for Strong Rebound in 2026 After Weather-Led Correction and GST-Driven Recovery: 6Wresearch
- ADAS in India: How Automatic Emergency Braking, Blind Spot Detection & Driver Monitoring are Transforming Road Safety
- Doha a strategic location for EV manufacturing hub: IPA Qatar
- Demand for luxury TVs surging in the GCC, says Samsung
- Empowering Growth: The Thriving Journey of Bangladesh’s Cable Industry
- Demand for luxury TVs surging in the GCC, says Samsung
Latest Reports
- Nicaragua RPG Gaming Market (2026-2032)
- New Zealand RPG Gaming Market (2026-2032)
- Netherlands RPG Gaming Market (2026-2032)
- Nauru RPG Gaming Market (2026-2032)
- Namibia RPG Gaming Market (2026-2032)
- Mozambique RPG Gaming Market (2026-2032)
- Montenegro RPG Gaming Market (2026-2032)
- Mongolia RPG Gaming Market (2026-2032)
- Monaco RPG Gaming Market (2026-2032)
- Micronesia RPG Gaming Market (2026-2032)
Industry Events and Analyst Meet

EV India Expo 2026

HIMTEX 2026

India Refining Summit 2026

India EV Show 2026

EV tech India Expo 2026
Whitepaper
- Middle East & Africa Commercial Security Market Click here to view more.
- Middle East & Africa Fire Safety Systems & Equipment Market Click here to view more.
- GCC Drone Market Click here to view more.
- Middle East Lighting Fixture Market Click here to view more.
- GCC Physical & Perimeter Security Market Click here to view more.