United States (US) Industrial Silica Sand Market Outlook | Growth, Companies, Industry, Share, Forecast, Value, Revenue, Analysis, COVID-19 IMPACT, Trends & Size
Market Forecast By Classification (Less Than 40 Mesh, 40-70 Mesh, More Than 70 Mesh), By Application (Hydraulic Fracturing, Glassmaking, Foundry, Ceramics and Refractories, Others) And Competitive Landscape
| Product Code: ETC084320 | Publication Date: Jun 2021 | Updated Date: Nov 2025 | Product Type: Report | |
| Publisher: 6Wresearch | Author: Shubham Padhi | No. of Pages: 70 | No. of Figures: 35 | No. of Tables: 5 |
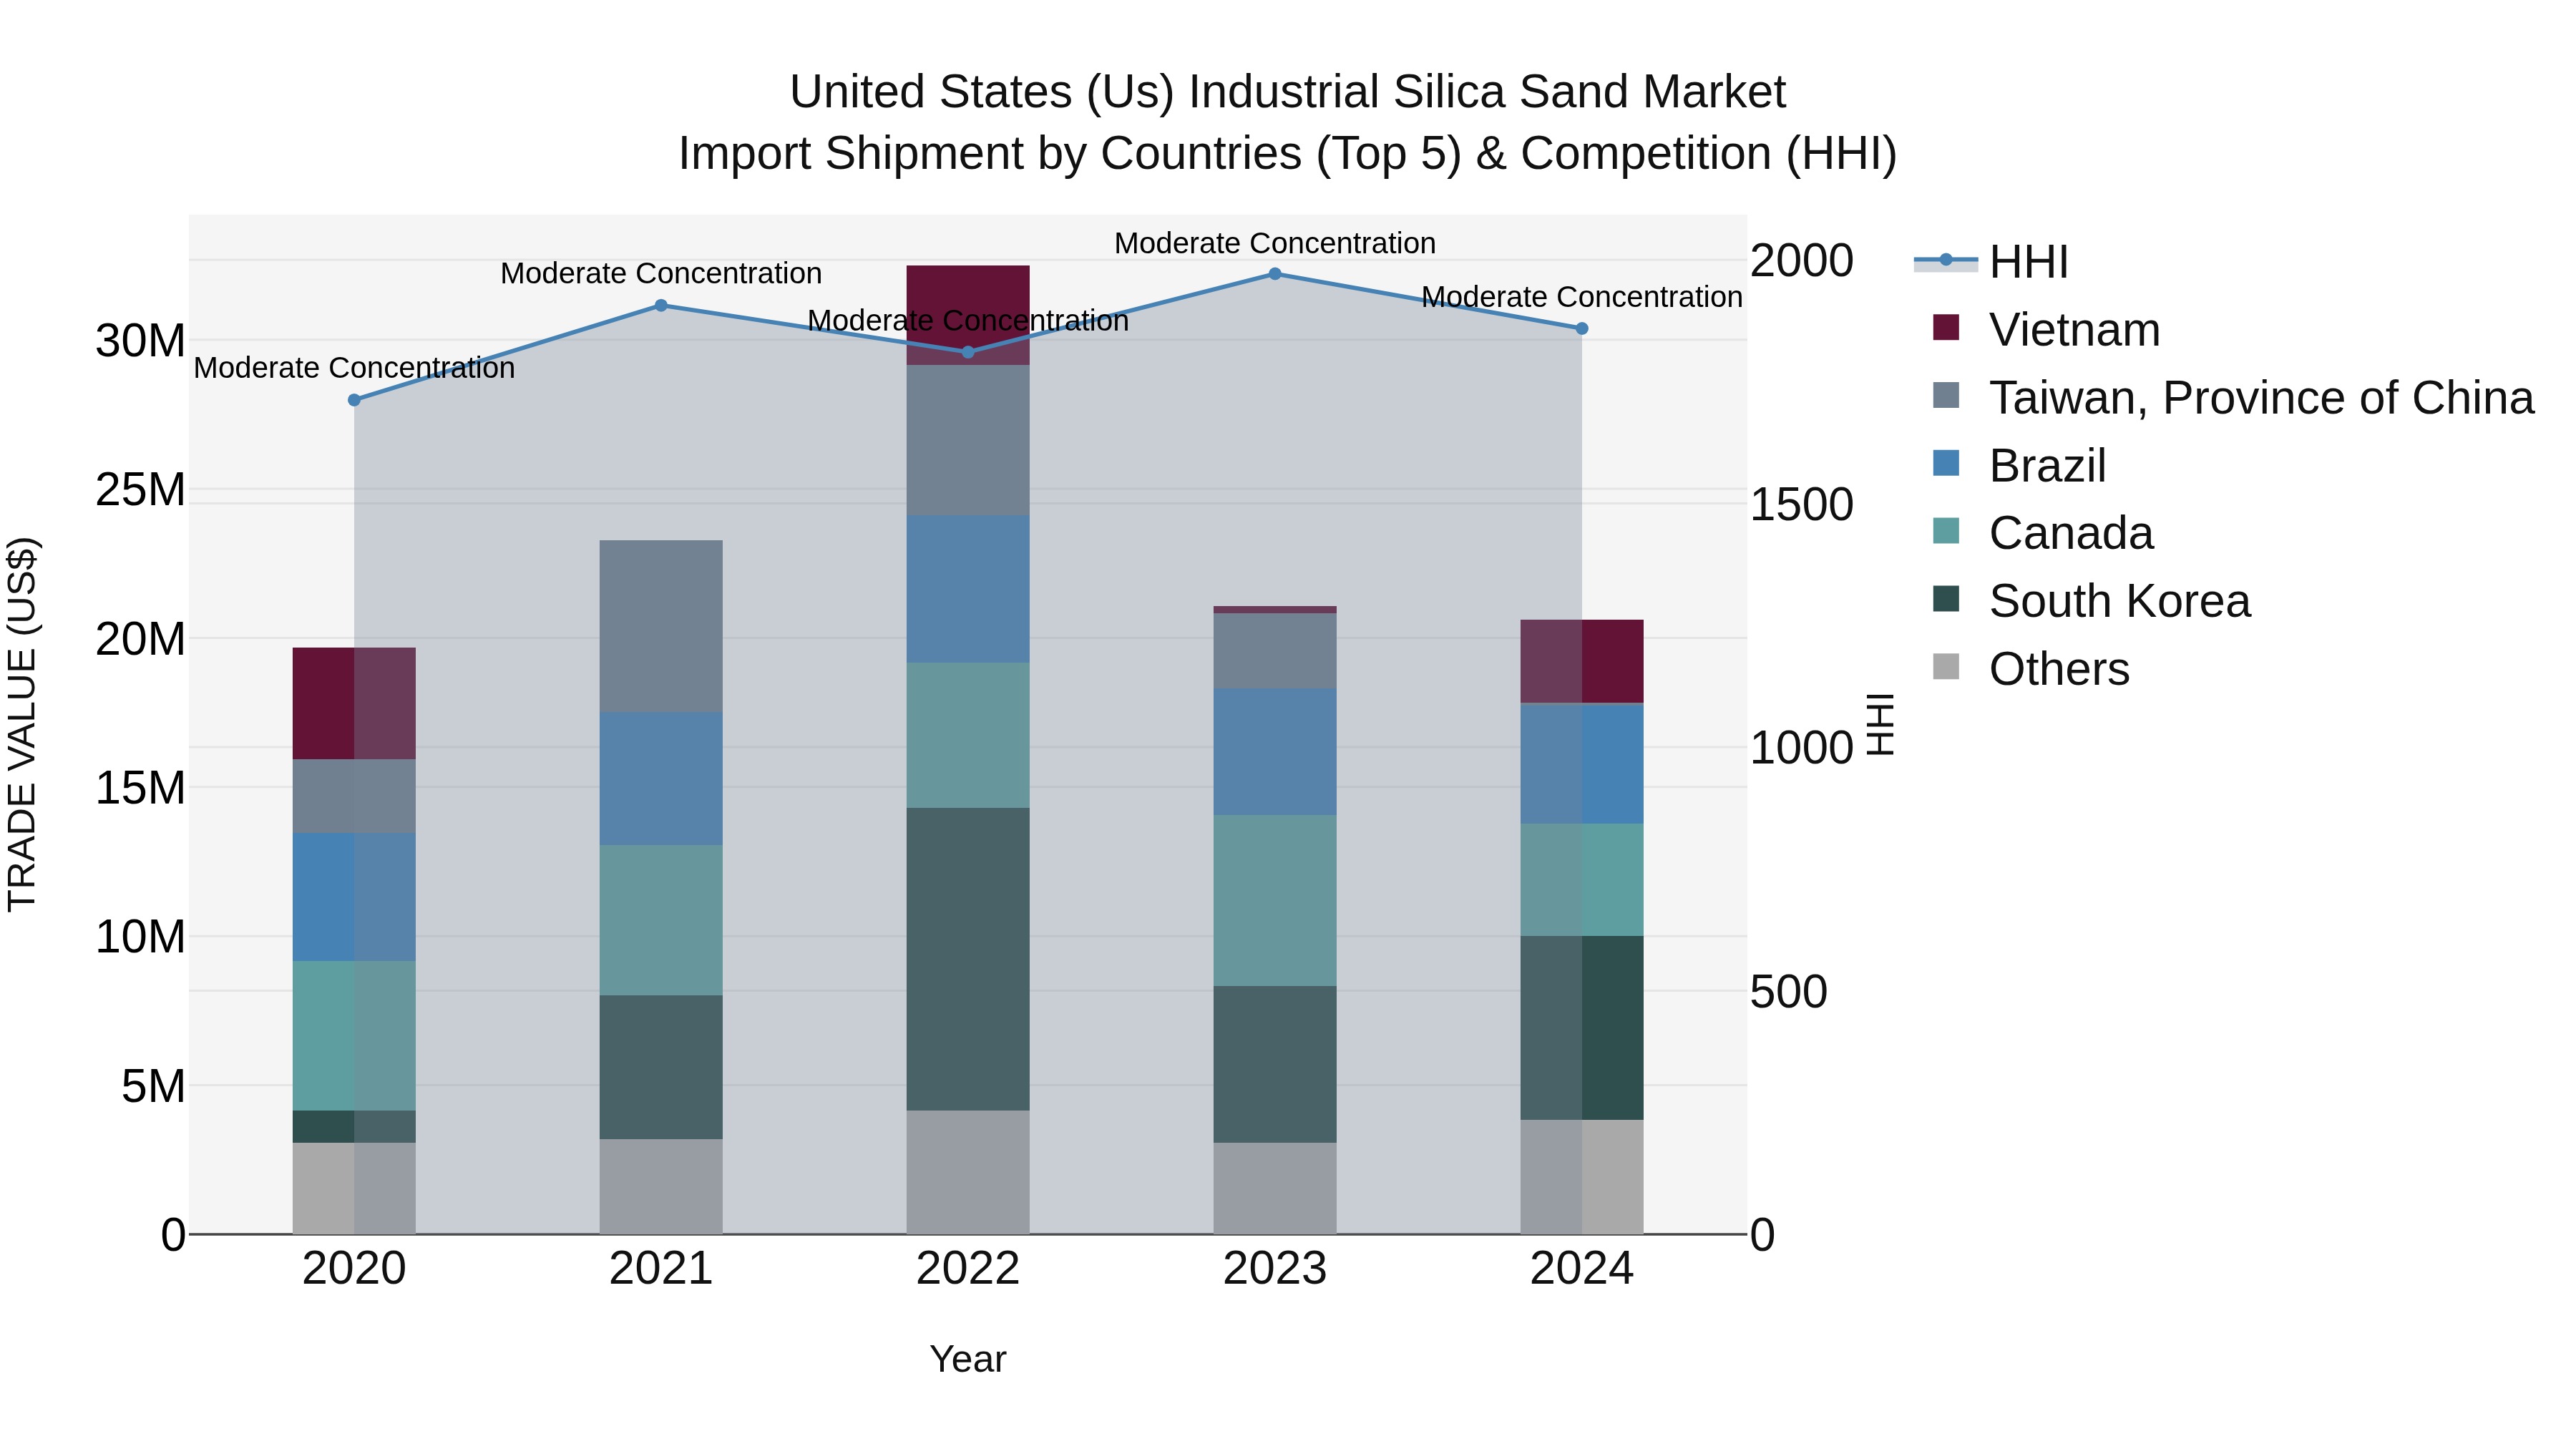
United States (US) IndUStrial Silica Sand Market Top 5 Importing Countries and Market Competition (HHI) Analysis
In 2024, the United States continued to import industrial silica sand primarily from South Korea, Brazil, Canada, Vietnam, and Australia. The market saw a moderate concentration with no significant shifts in the Herfindahl-Hirschman Index (HHI). The compound annual growth rate (CAGR) from 2020 to 2024 stood at 1.16%, indicating steady but modest growth. However, there was a slight decline in the growth rate from 2023 to 2024 at -2.12%, possibly reflecting some market challenges or fluctuations during that period. Overall, the US industrial silica sand import market appears to have maintained stability with room for potential growth opportunities.
USA Export Potential Assessment For Industrial Silica Sand Market (Values in USD Thousand)
United States (US) Industrial Silica Sand Market Overview
The United States Industrial Silica Sand Market is a significant sector within the country`s industrial minerals industry, driven by its widespread applications in various end-use industries such as glass manufacturing, foundry, construction, and chemical production. The market is characterized by a high demand for high-quality silica sand due to its properties like purity, grain size, and strength. Major silica sand-producing states in the US include Wisconsin, Illinois, Texas, and Oklahoma. The market is influenced by factors such as the construction industry`s growth, infrastructure development projects, and the increasing use of hydraulic fracturing techniques in the oil and gas sector. However, environmental concerns related to silica sand mining practices and regulations regarding air quality standards pose challenges for market growth. Overall, the US Industrial Silica Sand Market is poised for steady growth, driven by various industrial applications and technological advancements.
United States (US) Industrial Silica Sand Market Trends
The US Industrial Silica Sand Market is witnessing several key trends, including increasing demand from the oil and gas industry for use in hydraulic fracturing, also known as fracking, to extract shale oil and natural gas. Additionally, the growing construction industry in the US is driving demand for silica sand in applications such as glass manufacturing, foundry molds, and abrasives. Environmental concerns around silica sand mining have prompted stricter regulations in some regions, leading to a focus on sustainable and responsible sourcing practices. Market players are also investing in research and development to enhance product quality and cater to evolving customer preferences. Overall, the US Industrial Silica Sand Market is expected to continue growing, driven by the expanding industrial and construction sectors and technological advancements in silica sand processing.
United States (US) Industrial Silica Sand Market Challenges
In the US Industrial Silica Sand Market, challenges include fluctuating demand from end-use industries such as glass manufacturing, foundry, and oil and gas exploration, which can impact market stability. Environmental concerns regarding the extraction and processing of silica sand, particularly related to potential air and water pollution, also pose challenges for companies operating in this market. Additionally, competition from alternative materials and imports from other countries can affect market share and pricing dynamics. Regulatory changes and permitting issues at both federal and state levels further contribute to the complexity of operating in the US Industrial Silica Sand Market. Overall, navigating these challenges requires companies to adapt to market conditions, invest in sustainable practices, and stay informed about industry trends and regulations.
United States (US) Industrial Silica Sand Market Investment Opportunities
The US Industrial Silica Sand Market presents promising investment opportunities due to the growing demand from various sectors such as construction, oil and gas, and foundry industries. The increasing use of industrial silica sand in hydraulic fracturing activities for oil and gas extraction, as well as in the production of glass, ceramics, and silicon wafers for electronics, is driving market growth. Additionally, the construction industry`s robust expansion, particularly in infrastructure development projects, is further fueling the demand for industrial silica sand. Investors can consider opportunities in companies involved in silica sand mining and processing, as well as those providing transportation and logistics services for the distribution of silica sand to end-users. With the market poised for continuous growth, strategic investments in this sector can yield favorable returns in the long term.
United States (US) Industrial Silica Sand Market Government Policy
Government policies related to the US Industrial Silica Sand Market primarily revolve around regulating mining operations to ensure environmental sustainability and worker safety. The US Mine Safety and Health Administration (MSHA) enforces regulations to protect workers in silica sand mining operations from exposure to harmful dust particles. Additionally, the Environmental Protection Agency (EPA) regulates air quality standards to minimize the impact of silica sand mining activities on the environment and surrounding communities. Local governments may also impose zoning restrictions to control mining activities and mitigate potential negative effects on land use and water resources. Overall, government policies aim to strike a balance between supporting the industrial silica sand market`s growth and safeguarding public health and the environment.
United States (US) Industrial Silica Sand Market Future Outlook
The future outlook for the US Industrial Silica Sand Market appears positive, with steady growth anticipated in the coming years. Factors driving this growth include the expanding construction and infrastructure development activities, particularly in the oil and gas industry. The demand for industrial silica sand in hydraulic fracturing operations is expected to remain robust, supporting market growth. Additionally, the increasing use of silica sand in the manufacturing of glass, ceramics, and foundry applications will further contribute to market expansion. However, environmental concerns and regulations related to silica sand mining and processing could pose challenges for market players. Overall, the US Industrial Silica Sand Market is poised for growth, driven by various end-use industries and applications.
Key Highlights of the Report:
- United States (US) Industrial Silica Sand Market Outlook
- Market Size of United States (US) Industrial Silica Sand Market, 2021
- Forecast of United States (US) Industrial Silica Sand Market, 2027
- Historical Data and Forecast of United States (US) Industrial Silica Sand Revenues & Volume for the Period 2018 - 2027
- United States (US) Industrial Silica Sand Market Trend Evolution
- United States (US) Industrial Silica Sand Market Drivers and Challenges
- United States (US) Industrial Silica Sand Price Trends
- United States (US) Industrial Silica Sand Porter's Five Forces
- United States (US) Industrial Silica Sand Industry Life Cycle
- Historical Data and Forecast of United States (US) Industrial Silica Sand Market Revenues & Volume By Classification for the Period 2018 - 2027
- Historical Data and Forecast of United States (US) Industrial Silica Sand Market Revenues & Volume By Less Than 40 Mesh for the Period 2018 - 2027
- Historical Data and Forecast of United States (US) Industrial Silica Sand Market Revenues & Volume By 40-70 Mesh for the Period 2018 - 2027
- Historical Data and Forecast of United States (US) Industrial Silica Sand Market Revenues & Volume By More Than 70 Mesh for the Period 2018 - 2027
- Historical Data and Forecast of United States (US) Industrial Silica Sand Market Revenues & Volume By Application for the Period 2018 - 2027
- Historical Data and Forecast of United States (US) Industrial Silica Sand Market Revenues & Volume By Hydraulic Fracturing for the Period 2018 - 2027
- Historical Data and Forecast of United States (US) Industrial Silica Sand Market Revenues & Volume By Glassmaking for the Period 2018 - 2027
- Historical Data and Forecast of United States (US) Industrial Silica Sand Market Revenues & Volume By Foundry for the Period 2018 - 2027
- Historical Data and Forecast of United States (US) Industrial Silica Sand Market Revenues & Volume By Ceramics and Refractories for the Period 2018 - 2027
- Historical Data and Forecast of United States (US) Industrial Silica Sand Market Revenues & Volume By Others for the Period 2018 - 2027
- United States (US) Industrial Silica Sand Import Export Trade Statistics
- Market Opportunity Assessment By Classification
- Market Opportunity Assessment By Application
- United States (US) Industrial Silica Sand Top Companies Market Share
- United States (US) Industrial Silica Sand Competitive Benchmarking By Technical and Operational Parameters
- United States (US) Industrial Silica Sand Company Profiles
- United States (US) Industrial Silica Sand Key Strategic Recommendations
Frequently Asked Questions About the Market Study (FAQs):
6Wresearch actively monitors the United States (US) Industrial Silica Sand Market and publishes its comprehensive annual report, highlighting emerging trends, growth drivers, revenue analysis, and forecast outlook. Our insights help businesses to make data-backed strategic decisions with ongoing market dynamics. Our analysts track relevent industries related to the United States (US) Industrial Silica Sand Market, allowing our clients with actionable intelligence and reliable forecasts tailored to emerging regional needs.
Yes, we provide customisation as per your requirements. To learn more, feel free to contact us on sales@6wresearch.com
1 Executive Summary |
2 Introduction |
2.1 Key Highlights of the Report |
2.2 Report Description |
2.3 Market Scope & Segmentation |
2.4 Research Methodology |
2.5 Assumptions |
3 United States (US) Industrial Silica Sand Market Overview |
3.1 United States (US) Country Macro Economic Indicators |
3.2 United States (US) Industrial Silica Sand Market Revenues & Volume, 2021 & 2027F |
3.3 United States (US) Industrial Silica Sand Market - Industry Life Cycle |
3.4 United States (US) Industrial Silica Sand Market - Porter's Five Forces |
3.5 United States (US) Industrial Silica Sand Market Revenues & Volume Share, By Classification, 2021 & 2027F |
3.6 United States (US) Industrial Silica Sand Market Revenues & Volume Share, By Application, 2021 & 2027F |
4 United States (US) Industrial Silica Sand Market Dynamics |
4.1 Impact Analysis |
4.2 Market Drivers |
4.2.1 Growing demand for industrial silica sand in the construction industry for applications such as concrete and asphalt production. |
4.2.2 Increasing use of industrial silica sand in the oil and gas sector for hydraulic fracturing operations. |
4.2.3 Technological advancements leading to the development of high-purity silica sand for use in the electronics industry. |
4.3 Market Restraints |
4.3.1 Environmental concerns related to silica sand mining and processing. |
4.3.2 Fluctuations in crude oil prices impacting the demand for industrial silica sand in the oil and gas sector. |
4.3.3 Competition from alternative materials and substitutes for industrial silica sand in various industries. |
5 United States (US) Industrial Silica Sand Market Trends |
6 United States (US) Industrial Silica Sand Market, By Types |
6.1 United States (US) Industrial Silica Sand Market, By Classification |
6.1.1 Overview and Analysis |
6.1.2 United States (US) Industrial Silica Sand Market Revenues & Volume, By Classification, 2018 - 2027F |
6.1.3 United States (US) Industrial Silica Sand Market Revenues & Volume, By Less Than 40 Mesh, 2018 - 2027F |
6.1.4 United States (US) Industrial Silica Sand Market Revenues & Volume, By 40-70 Mesh, 2018 - 2027F |
6.1.5 United States (US) Industrial Silica Sand Market Revenues & Volume, By More Than 70 Mesh, 2018 - 2027F |
6.2 United States (US) Industrial Silica Sand Market, By Application |
6.2.1 Overview and Analysis |
6.2.2 United States (US) Industrial Silica Sand Market Revenues & Volume, By Hydraulic Fracturing, 2018 - 2027F |
6.2.3 United States (US) Industrial Silica Sand Market Revenues & Volume, By Glassmaking, 2018 - 2027F |
6.2.4 United States (US) Industrial Silica Sand Market Revenues & Volume, By Foundry, 2018 - 2027F |
6.2.5 United States (US) Industrial Silica Sand Market Revenues & Volume, By Ceramics and Refractories, 2018 - 2027F |
6.2.6 United States (US) Industrial Silica Sand Market Revenues & Volume, By Others, 2018 - 2027F |
7 United States (US) Industrial Silica Sand Market Import-Export Trade Statistics |
7.1 United States (US) Industrial Silica Sand Market Export to Major Countries |
7.2 United States (US) Industrial Silica Sand Market Imports from Major Countries |
8 United States (US) Industrial Silica Sand Market Key Performance Indicators |
8.1 Average selling price of industrial silica sand. |
8.2 Number of new construction projects using industrial silica sand. |
8.3 Investments in research and development for improving the quality of industrial silica sand. |
8.4 Utilization rate of industrial silica sand processing plants. |
8.5 Environmental compliance measures implemented by companies in the industrial silica sand market. |
9 United States (US) Industrial Silica Sand Market - Opportunity Assessment |
9.1 United States (US) Industrial Silica Sand Market Opportunity Assessment, By Classification, 2021 & 2027F |
9.2 United States (US) Industrial Silica Sand Market Opportunity Assessment, By Application, 2021 & 2027F |
10 United States (US) Industrial Silica Sand Market - Competitive Landscape |
10.1 United States (US) Industrial Silica Sand Market Revenue Share, By Companies, 2021 |
10.2 United States (US) Industrial Silica Sand Market Competitive Benchmarking, By Operating and Technical Parameters |
11 Company Profiles |
12 Recommendations |
13 Disclaimer |
Global Go To Market Strategy - 2030
Export potential enables firms to identify high-growth global markets with greater confidence by combining advanced trade intelligence with a structured quantitative methodology. The framework analyzes emerging demand trends and country-level import patterns while integrating macroeconomic and trade datasets such as GDP and population forecasts, bilateral import–export flows, tariff structures, elasticity differentials between developed and developing economies, geographic distance, and import demand projections. Using weighted trade values from 2020–2024 as the base period to project country-to-country export potential for 2030, these inputs are operationalized through calculated drivers such as gravity model parameters, tariff impact factors, and projected GDP per-capita growth. Through an analysis of hidden potentials, demand hotspots, and market conditions that are most favorable to success, this method enables firms to focus on target countries, maximize returns, and global expansion with data, backed by accuracy.
By factoring in the projected importer demand gap that is currently unmet and could be potential opportunity, it identifies the potential for the Exporter (Country) among 190 countries, against the general trade analysis, which identifies the biggest importer or exporter.
To discover high-growth global markets and optimize your business strategy:
Click Here
Pricing
- Single User License$ 1,995
- Department License$ 2,400
- Site License$ 3,120
- Global License$ 3,795

Leadership Perspectives from Industry Events
Search
Thought Leadership and Analyst Meet


Our Clients
6WResearch In News
- India Export Attractiveness Tracker 2026
- India Air Conditioner Market Set for Strong Rebound in 2026 After Weather-Led Correction and GST-Driven Recovery: 6Wresearch
- ADAS in India: How Automatic Emergency Braking, Blind Spot Detection & Driver Monitoring are Transforming Road Safety
- Doha a strategic location for EV manufacturing hub: IPA Qatar
- Demand for luxury TVs surging in the GCC, says Samsung
- Empowering Growth: The Thriving Journey of Bangladesh’s Cable Industry
Latest Reports
- Nicaragua RPG Gaming Market (2026-2032)
- New Zealand RPG Gaming Market (2026-2032)
- Netherlands RPG Gaming Market (2026-2032)
- Nauru RPG Gaming Market (2026-2032)
- Namibia RPG Gaming Market (2026-2032)
- Mozambique RPG Gaming Market (2026-2032)
- Montenegro RPG Gaming Market (2026-2032)
- Mongolia RPG Gaming Market (2026-2032)
- Monaco RPG Gaming Market (2026-2032)
- Micronesia RPG Gaming Market (2026-2032)
Industry Events and Analyst Meet

EV India Expo 2026

HIMTEX 2026

India Refining Summit 2026

India EV Show 2026

EV tech India Expo 2026
Whitepaper
- Middle East & Africa Commercial Security Market Click here to view more.
- Middle East & Africa Fire Safety Systems & Equipment Market Click here to view more.
- GCC Drone Market Click here to view more.
- Middle East Lighting Fixture Market Click here to view more.
- GCC Physical & Perimeter Security Market Click here to view more.