United States (US) Photosensitive Semiconductor Device Market (2026-2032) Outlook | Companies, Analysis, Share, Forecast, Revenue, Size, Value, Growth, Industry & Trends
Market Forecast By Device (Photocell, Photodiode, Phototransistor, Photoresistor, Photo IC), By End User (Automotive and Transportation, Consumer Electronics, Aerospace and Defence, Healthcare, Industrial, Security and Survelliance) And Competitive Landscape
| Product Code: ETC268141 | Publication Date: Aug 2022 | Updated Date: Jul 2026 | Product Type: Market Research Report | |
| Publisher: 6Wresearch | Author: Shubham Deep | No. of Pages: 75 | No. of Figures: 35 | No. of Tables: 20 |
United States (US) Photosensitive Semiconductor Device Market Size, Share & Growth Rate
The United States (US) Photosensitive Semiconductor Device Market was estimated at USD 268 Million in 2025 and is projected to reach USD 357 Million by 2032, growing at a CAGR of 4.2% from 2026 to 2032. This growth trajectory is primarily fueled by increasing demand for high-quality imaging solutions across various sectors, such as automotive and consumer electronics. Furthermore, the rise in applications like autonomous vehicles and advanced driver-assistance systems serves as a key driver for the market, compelling manufacturers to innovate continuously.
United States (US) Photosensitive Semiconductor Device Market Year-wise Growth Rate and Key Drivers
This graph highlights how the United States (US) Photosensitive Semiconductor Device Market has steadily grown over the years, supported by major growth factors.
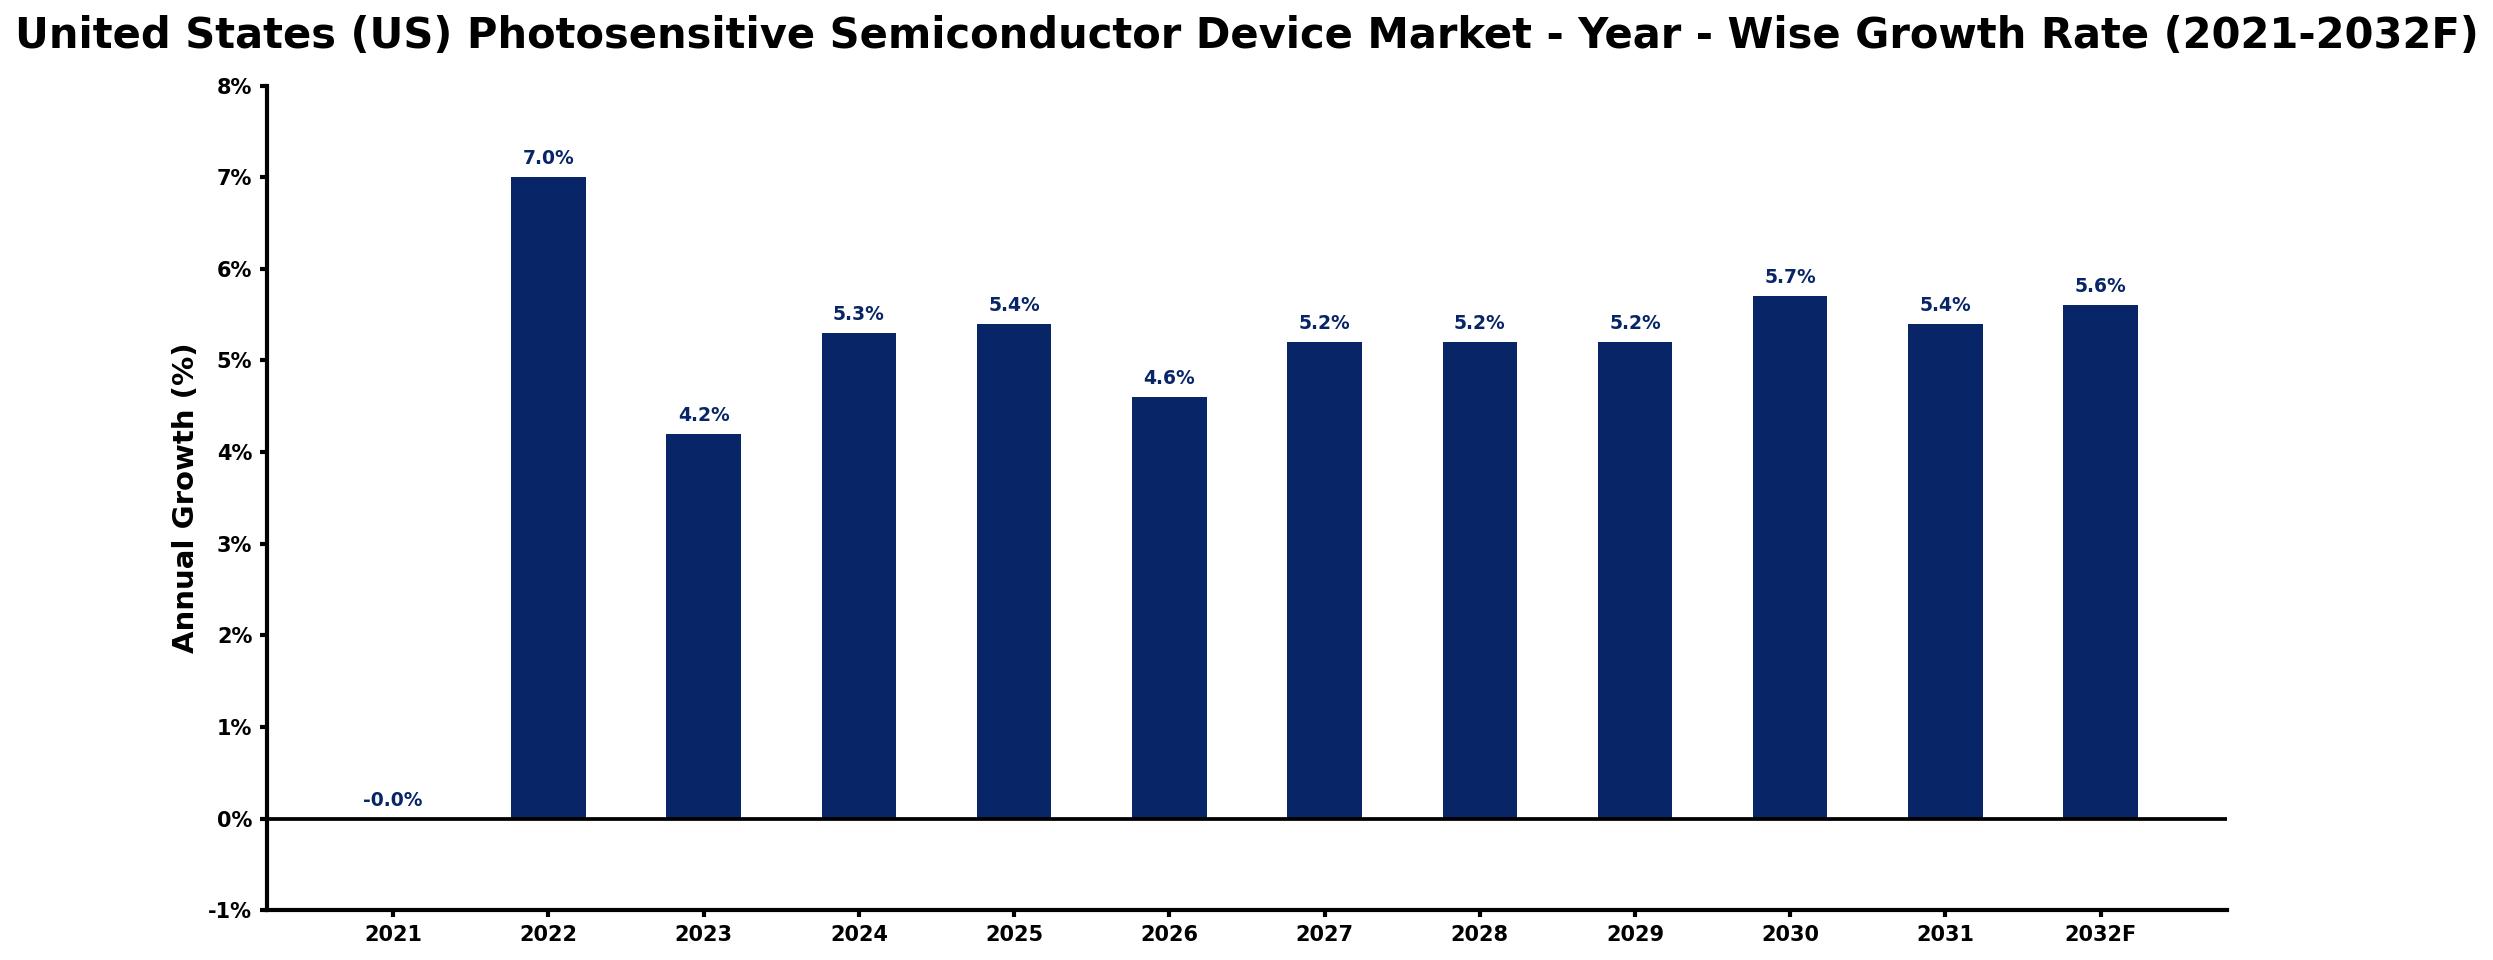
The table below presents the year‑wise growth rates along with the key drivers influencing the market
| Year | Growth Rate | Major Drivers |
| 2021 | -0.0% | Emerging technologies driving demand |
| 2022 | 7.0% | Increased investment in R&D |
| 2023 | 4.2% | Growing adoption in healthcare |
| 2024 | 5.3% | Expansion of renewable energy sector |
| 2025 | 5.4% | Rising consumer electronics market |
| 2026 | 4.6% | Advancements in smart technologies |
| 2027 | 5.2% | Increasing automation in industries |
| 2028 | 5.2% | Surge in automotive applications |
| 2029 | 5.2% | Growth in IoT market applications |
| 2030 | 5.7% | Development of smart cities initiatives |
| 2031 | 5.4% | Enhanced government funding initiatives |
| 2032 | 5.6% | Rising demand for energy efficiency |
Note: Market size estimations and growth projections presented in this report are based on 6Wresearch's proprietary forecasting methodology, utilizing the latest available industry data, government publications, and primary research inputs.
United States (US) Photosensitive Semiconductor Device Market Synopsis
The most influential force shaping the United States (US) Photosensitive Semiconductor Device Market is the surge in demand for sophisticated imaging technologies. This demand is predominantly seen in sectors like automotive, healthcare, and security, where enhanced image quality is imperative for operational efficiency and safety.
Moreover, the evolving landscape of consumer electronics is pushing manufacturers to integrate advanced photosensitive technologies into smartphones and cameras, further amplifying market growth. With the industry leaning towards next-generation sensors, stakeholders are poised to capitalize on innovative advancements.
United States (US) Photosensitive Semiconductor Device Market Key Takeaways
- The market is driven by the increasing application of advanced imaging technologies across multiple industries.
- Key sectors include automotive, consumer electronics, healthcare, and security, showcasing diverse opportunities.
- Emerging technologies like organic photodetectors are challenging traditional devices, necessitating continual innovation.
- Significant investments are being made in R&D to enhance sensor performance and energy efficiency.
- Government initiatives support market growth through funding and regulations focused on safety and innovation.
Evaluation of Restraints in United States (US) Photosensitive Semiconductor Device Market
Despite its robust growth, the United States (US) Photosensitive Semiconductor Device Market faces several restraints. Intense competition from both established manufacturers and new entrants can lead to pricing pressures, impacting profit margins. Additionally, emerging technologies, including organic photodetectors and quantum dot sensors, pose a challenge to traditional semiconductor devices, pushing manufacturers to invest heavily in R&D. Volatility in raw material prices and potential supply chain disruptions further complicate the production landscape, requiring companies to develop adaptive strategies for sustainable growth.
United States (US) Photosensitive Semiconductor Device Market Trends
Key trends shaping the United States (US) Photosensitive Semiconductor Device Market include a significant shift towards compact and energy-efficient sensors. This trend is largely driven by the integration of imaging technologies in smaller consumer devices, enhancing usability and performance. Additionally, the rising popularity of augmented reality (AR) and machine vision applications is fostering demand for high-resolution imaging solutions.
The automotive sector is increasingly adopting advanced driver-assistance systems (ADAS) that rely on photosensitive sensors, further propelling market growth. Furthermore, the expansion of 5G networks is expected to enhance the capabilities of imaging and sensing devices, paving the way for innovative applications that require rapid data processing and analysis.
United States (US) Photosensitive Semiconductor Device Market Opportunities
Investment opportunities in the United States (US) Photosensitive Semiconductor Device Market are vast, particularly in companies focusing on the development of cutting-edge imaging technologies. The increasing demand for digital cameras, smartphones, and surveillance systems positions these companies favorably for growth. Moreover, as industries adopt AI-driven applications, the need for high-performance sensors will create lucrative avenues for innovation and market expansion.
Government Initiatives in the United States (US) Photosensitive Semiconductor Device Market
The United States government actively promotes innovation within the Photosensitive Semiconductor Device Market through various initiatives. This includes providing research and development tax credits to stimulate investment in advanced technologies. Public funding is also directed towards initiatives that encourage the development and commercialization of state-of-the-art semiconductor solutions. Regulatory frameworks have been established to ensure the safety, quality, and environmental sustainability of these devices, fostering a favorable environment for market growth.
Future Insights of the United States (US) Photosensitive Semiconductor Device Market
Looking ahead to 2026-2032, the United States (US) Photosensitive Semiconductor Device Market is expected to thrive, propelled by technological advancements and increasing applications across diverse sectors. The push for higher resolution imaging, alongside the integration of artificial intelligence, will transform how photosensitive devices are utilized in industries like healthcare and security. As manufacturers continue to innovate, the market will likely see enhanced performance metrics, such as improved sensitivity and reduced power consumption, driving adoption in an increasingly technology-driven landscape.
United States (US) Photosensitive Semiconductor Device Market Latest Developments (2025 - 2026)
In recent months, the United States (US) Photosensitive Semiconductor Device Market has witnessed a surge in initiatives aimed at advancing sensor technology. Companies are exploring new material options, including organic and perovskite-based devices, to enhance performance and energy efficiency. Additionally, there is a growing emphasis on integrating AI capabilities into imaging devices, paving the way for innovations in facial recognition and machine vision technologies. These developments signal a strong commitment to meeting the evolving needs of various industries.
United States (US) Photosensitive Semiconductor Device Market - Key Attractiveness of the Report
- 10 Years of Market Numbers
- Historical Data Starting from 2022 to 2025
- Base Year: 2025
- Forecast Data until 2032
- Key Performance Indicators Impacting the Market
- Major Upcoming Developments and Projects
Key Highlights of the Report:
- United States (US) Photosensitive Semiconductor Device Market Outlook
- Market Size of United States (US) Photosensitive Semiconductor Device Market, 2025
- Forecast of United States (US) Photosensitive Semiconductor Device Market, 2032
- Historical Data and Forecast of United States (US) Photosensitive Semiconductor Device Revenues & Volume for the Period 2022-2032F
- United States (US) Photosensitive Semiconductor Device Market Trend Evolution
- United States (US) Photosensitive Semiconductor Device Market Drivers and Challenges
- United States (US) Photosensitive Semiconductor Device Price Trends
- United States (US) Photosensitive Semiconductor Device Porter's Five Forces
- United States (US) Photosensitive Semiconductor Device Industry Life Cycle
- Historical Data and Forecast of United States (US) Photosensitive Semiconductor Device Market Revenues & Volume By Device for the Period 2022-2032F
- Historical Data and Forecast of United States (US) Photosensitive Semiconductor Device Market Revenues & Volume By Photocell for the Period 2022-2032F
- Historical Data and Forecast of United States (US) Photosensitive Semiconductor Device Market Revenues & Volume By Photodiode for the Period 2022-2032F
- Historical Data and Forecast of United States (US) Photosensitive Semiconductor Device Market Revenues & Volume By Phototransistor for the Period 2022-2032F
- Historical Data and Forecast of United States (US) Photosensitive Semiconductor Device Market Revenues & Volume By Photoresistor for the Period 2022-2032F
- Historical Data and Forecast of United States (US) Photosensitive Semiconductor Device Market Revenues & Volume By Photo IC for the Period 2022-2032F
- Historical Data and Forecast of United States (US) Photosensitive Semiconductor Device Market Revenues & Volume By End User for the Period 2022-2032F
- Historical Data and Forecast of United States (US) Photosensitive Semiconductor Device Market Revenues & Volume By Automotive and Transportation for the Period 2022-2032F
- Historical Data and Forecast of United States (US) Photosensitive Semiconductor Device Market Revenues & Volume By Consumer Electronics for the Period 2022-2032F
- Historical Data and Forecast of United States (US) Photosensitive Semiconductor Device Market Revenues & Volume By Aerospace and Defence for the Period 2022-2032F
- Historical Data and Forecast of United States (US) Photosensitive Semiconductor Device Market Revenues & Volume By Healthcare for the Period 2022-2032F
- Historical Data and Forecast of United States (US) Photosensitive Semiconductor Device Market Revenues & Volume By Industrial for the Period 2022-2032F
- Historical Data and Forecast of United States (US) Photosensitive Semiconductor Device Market Revenues & Volume By Security and Survelliance for the Period 2022-2032F
- United States (US) Photosensitive Semiconductor Device Import Export Trade Statistics
- Market Opportunity Assessment By Device
- Market Opportunity Assessment By End User
- United States (US) Photosensitive Semiconductor Device Top Companies Market Share
- United States (US) Photosensitive Semiconductor Device Competitive Benchmarking By Technical and Operational Parameters
- United States (US) Photosensitive Semiconductor Device Company Profiles
- United States (US) Photosensitive Semiconductor Device Key Strategic Recommendations
Frequently Asked Questions About the Market Study (FAQs):
The growth is primarily driven by increasing demand for advanced imaging technologies across sectors like automotive and consumer electronics, as well as the rising adoption of applications in autonomous vehicles and healthcare.
The United States (US) Photosensitive Semiconductor Device Market was estimated at USD 268 Million in 2025 and is projected to reach USD 357 Million by 2032, growing at a CAGR of 4.2% from 2026 to 2032.
Emerging technologies such as organic photodetectors and quantum dot sensors are significantly influencing market dynamics, offering improved efficiency and sensitivity compared to traditional devices.
Government initiatives, including tax incentives and funding for R&D, play a vital role in fostering innovation and ensuring compliance with safety and quality standards in the semiconductor device industry.
Key sectors driving demand include automotive, healthcare, consumer electronics, and security, with each sector seeking enhanced imaging technologies for various applications.
6Wresearch actively monitors the United States (US) Photosensitive Semiconductor Device Market and publishes its comprehensive annual report, highlighting emerging trends, growth drivers, revenue analysis, and forecast outlook. Our insights help businesses to make data-backed strategic decisions with ongoing market dynamics. Our analysts track relevent industries related to the United States (US) Photosensitive Semiconductor Device Market, allowing our clients with actionable intelligence and reliable forecasts tailored to emerging regional needs.
Yes, we provide customisation as per your requirements. To learn more, feel free to contact us on sales@6wresearch.com
1 Executive Summary |
2 Introduction |
2.1 Key Highlights of the Report |
2.2 Report Description |
2.3 Market Scope & Segmentation |
2.4 Research Methodology |
2.5 Assumptions |
3 United States (US) Photosensitive Semiconductor Device Market Overview |
3.1 United States (US) Country Macro Economic Indicators |
3.2 United States (US) Photosensitive Semiconductor Device Market Revenues & Volume, 2022 & 2032F |
3.3 United States (US) Photosensitive Semiconductor Device Market - Industry Life Cycle |
3.4 United States (US) Photosensitive Semiconductor Device Market - Porter's Five Forces |
3.5 United States (US) Photosensitive Semiconductor Device Market Revenues & Volume Share, By Device, 2022 & 2032F |
3.6 United States (US) Photosensitive Semiconductor Device Market Revenues & Volume Share, By End User, 2022 & 2032F |
4 United States (US) Photosensitive Semiconductor Device Market Dynamics |
4.1 Impact Analysis |
4.2 Market Drivers |
4.2.1 Technological advancements in photosensitive semiconductor devices |
4.2.2 Increasing demand for digital imaging applications |
4.2.3 Growth in the automotive and consumer electronics sectors |
4.3 Market Restraints |
4.3.1 High manufacturing costs |
4.3.2 Competition from alternative technologies |
4.3.3 Regulatory challenges in the semiconductor industry |
5 United States (US) Photosensitive Semiconductor Device Market Trends |
6 United States (US) Photosensitive Semiconductor Device Market, By Types |
6.1 United States (US) Photosensitive Semiconductor Device Market, By Device |
6.1.1 Overview and Analysis |
6.1.2 United States (US) Photosensitive Semiconductor Device Market Revenues & Volume, By Device, 2022-2032F |
6.1.3 United States (US) Photosensitive Semiconductor Device Market Revenues & Volume, By Photocell, 2022-2032F |
6.1.4 United States (US) Photosensitive Semiconductor Device Market Revenues & Volume, By Photodiode, 2022-2032F |
6.1.5 United States (US) Photosensitive Semiconductor Device Market Revenues & Volume, By Phototransistor, 2022-2032F |
6.1.6 United States (US) Photosensitive Semiconductor Device Market Revenues & Volume, By Photoresistor, 2022-2032F |
6.1.7 United States (US) Photosensitive Semiconductor Device Market Revenues & Volume, By Photo IC, 2022-2032F |
6.2 United States (US) Photosensitive Semiconductor Device Market, By End User |
6.2.1 Overview and Analysis |
6.2.2 United States (US) Photosensitive Semiconductor Device Market Revenues & Volume, By Automotive and Transportation, 2022-2032F |
6.2.3 United States (US) Photosensitive Semiconductor Device Market Revenues & Volume, By Consumer Electronics, 2022-2032F |
6.2.4 United States (US) Photosensitive Semiconductor Device Market Revenues & Volume, By Aerospace and Defence, 2022-2032F |
6.2.5 United States (US) Photosensitive Semiconductor Device Market Revenues & Volume, By Healthcare, 2022-2032F |
6.2.6 United States (US) Photosensitive Semiconductor Device Market Revenues & Volume, By Industrial, 2022-2032F |
6.2.7 United States (US) Photosensitive Semiconductor Device Market Revenues & Volume, By Security and Survelliance, 2022-2032F |
7 United States (US) Photosensitive Semiconductor Device Market Import-Export Trade Statistics |
7.1 United States (US) Photosensitive Semiconductor Device Market Export to Major Countries |
7.2 United States (US) Photosensitive Semiconductor Device Market Imports from Major Countries |
8 United States (US) Photosensitive Semiconductor Device Market Key Performance Indicators |
8.1 Average selling price (ASP) of photosensitive semiconductor devices |
8.2 Adoption rate of photosensitive semiconductor devices in key industries |
8.3 Research and development (RD) investment in photosensitive semiconductor technology |
8.4 Efficiency and performance improvements in photosensitive semiconductor devices |
8.5 Number of patents filed for photosensitive semiconductor device innovations |
9 United States (US) Photosensitive Semiconductor Device Market - Opportunity Assessment |
9.1 United States (US) Photosensitive Semiconductor Device Market Opportunity Assessment, By Device, 2022 & 2032F |
9.2 United States (US) Photosensitive Semiconductor Device Market Opportunity Assessment, By End User, 2022 & 2032F |
10 United States (US) Photosensitive Semiconductor Device Market - Competitive Landscape |
10.1 United States (US) Photosensitive Semiconductor Device Market Revenue Share, By Companies, 2025 |
10.2 United States (US) Photosensitive Semiconductor Device Market Competitive Benchmarking, By Operating and Technical Parameters |
11 Company Profiles |
12 Recommendations |
13 Disclaimer |
Global Go To Market Strategy - 2030
Export potential enables firms to identify high-growth global markets with greater confidence by combining advanced trade intelligence with a structured quantitative methodology. The framework analyzes emerging demand trends and country-level import patterns while integrating macroeconomic and trade datasets such as GDP and population forecasts, bilateral import–export flows, tariff structures, elasticity differentials between developed and developing economies, geographic distance, and import demand projections. Using weighted trade values from 2020–2024 as the base period to project country-to-country export potential for 2030, these inputs are operationalized through calculated drivers such as gravity model parameters, tariff impact factors, and projected GDP per-capita growth. Through an analysis of hidden potentials, demand hotspots, and market conditions that are most favorable to success, this method enables firms to focus on target countries, maximize returns, and global expansion with data, backed by accuracy.
By factoring in the projected importer demand gap that is currently unmet and could be potential opportunity, it identifies the potential for the Exporter (Country) among 190 countries, against the general trade analysis, which identifies the biggest importer or exporter.
To discover high-growth global markets and optimize your business strategy:
Click Here
Pricing
- Single User License$ 1,995
- Department License$ 2,400
- Site License$ 3,120
- Global License$ 3,795

Leadership Perspectives from Industry Events
Search
Thought Leadership and Analyst Meet


Our Clients
6WResearch In News
- India Air Conditioner Market Set for Strong Rebound in 2026 After Weather-Led Correction and GST-Driven Recovery: 6Wresearch
- ADAS in India: How Automatic Emergency Braking, Blind Spot Detection & Driver Monitoring are Transforming Road Safety
- Doha a strategic location for EV manufacturing hub: IPA Qatar
- Demand for luxury TVs surging in the GCC, says Samsung
- Empowering Growth: The Thriving Journey of Bangladesh’s Cable Industry
- Demand for luxury TVs surging in the GCC, says Samsung
Latest Reports
- Nicaragua RPG Gaming Market (2026-2032)
- New Zealand RPG Gaming Market (2026-2032)
- Netherlands RPG Gaming Market (2026-2032)
- Nauru RPG Gaming Market (2026-2032)
- Namibia RPG Gaming Market (2026-2032)
- Mozambique RPG Gaming Market (2026-2032)
- Montenegro RPG Gaming Market (2026-2032)
- Mongolia RPG Gaming Market (2026-2032)
- Monaco RPG Gaming Market (2026-2032)
- Micronesia RPG Gaming Market (2026-2032)
Industry Events and Analyst Meet

EV India Expo 2026

HIMTEX 2026

India Refining Summit 2026

India EV Show 2026

EV tech India Expo 2026
Whitepaper
- Middle East & Africa Commercial Security Market Click here to view more.
- Middle East & Africa Fire Safety Systems & Equipment Market Click here to view more.
- GCC Drone Market Click here to view more.
- Middle East Lighting Fixture Market Click here to view more.
- GCC Physical & Perimeter Security Market Click here to view more.