United States (US) Polyphenols Market (2026-2032) | Forecast, Growth, Size, Outlook, Industry, Analysis, Trends, Revenue, Value, Companies & Share
Market Forecast By Type (Grape Seed, Green Tea, Apple, Peach, Citrus, Olive, Berries, Others), By Applications (Functional Beverages, Functional Foods, Dietary Supplements, Cosmetics & Toiletries, Animal Feed, Dyes, Others) And Competitive Landscape
| Product Code: ETC053741 | Publication Date: Jan 2021 | Updated Date: Jun 2026 | Product Type: Report | |
| Publisher: 6Wresearch | Author: Ravi Bhandari | No. of Pages: 70 | No. of Figures: 35 | No. of Tables: 5 |
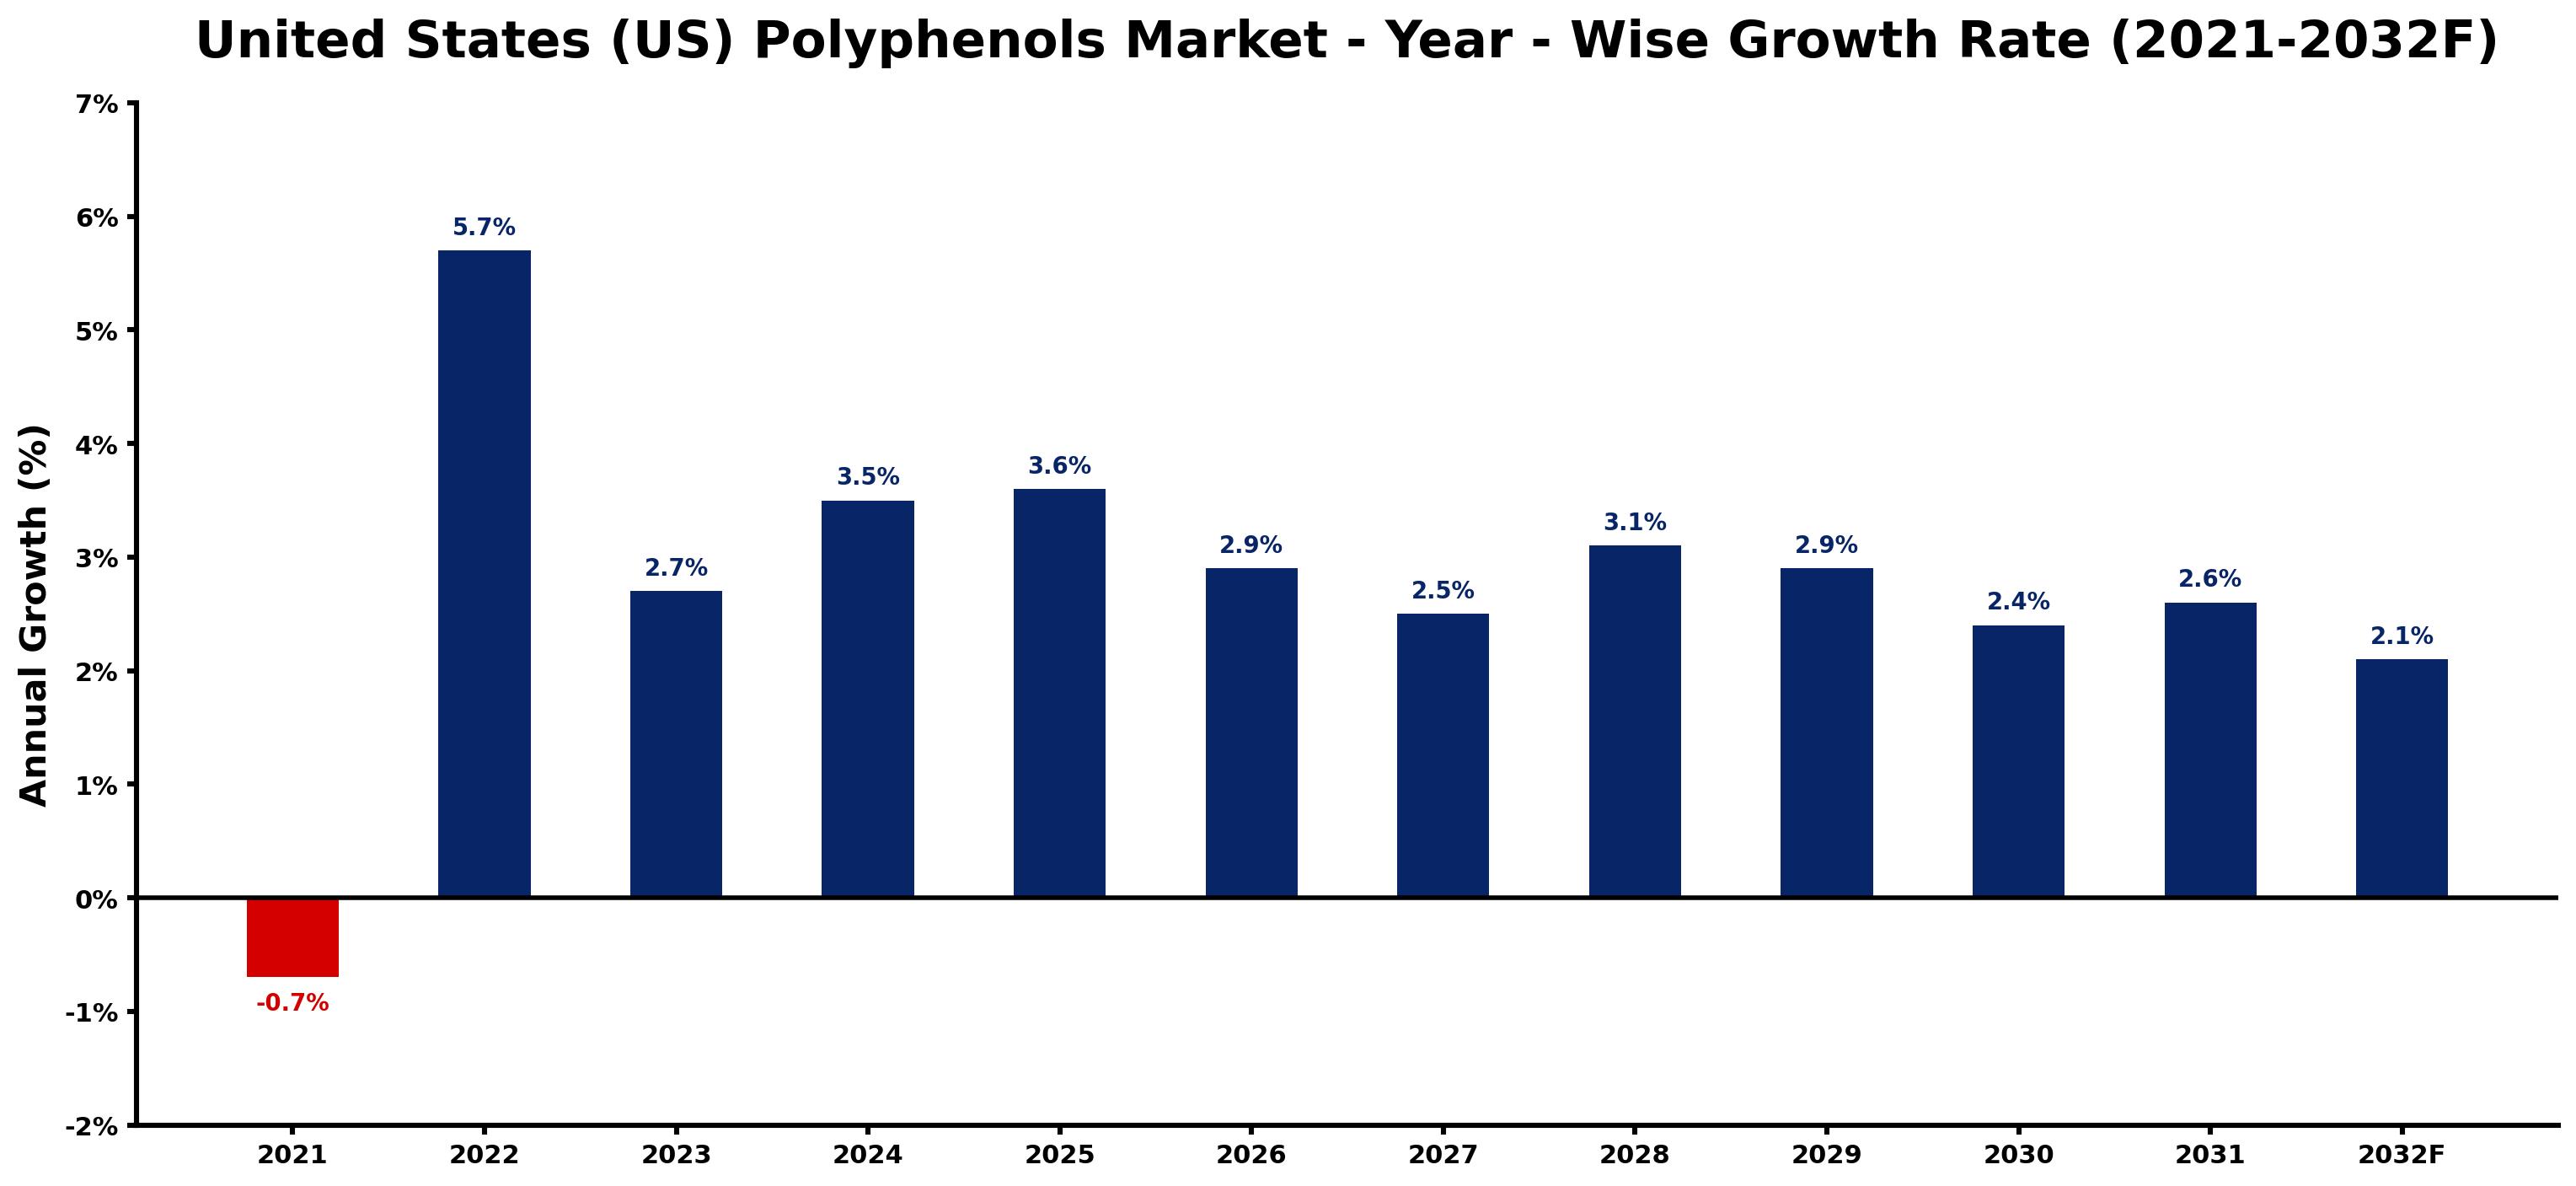
United States (US) Polyphenols Market Growth Rate Analysis (2021-2032)
The United States polyphenols market has exhibited notable fluctuations, reflecting both consumer trends and industrial dynamics. After a slight contraction of 0.7% in 2021, the market rebounded significantly in 2022, growing 5.7% due to heightened consumer awareness surrounding health benefits and increased demand for natural ingredients. However, growth normalized to 2.7% in 2023, suggesting a stabilization phase. Projections indicate a steady increase through 2024 and beyond, with growth rates around 3.5% to 3.6% as investment in sustainable sourcing and technological advancements continues to drive innovation. By 2032, growth is expected to taper to 2.1%, reflecting market maturation and shifting consumer preferences.
United States (US) Polyphenols Market Year-wise Growth Rate and Key Drivers
This graph highlights how the United States (US) Polyphenols Market has steadily grown over the past five years, supported by major growth factors.
The table below presents the year‑wise growth rates along with the key drivers influencing the market
| Year | Growth Rate | Major Drivers |
| 2021 | -0.7% | Expansion of transportation and logistics networks |
| 2022 | 5.7% | Expansion of commercial construction activities |
| 2023 | 2.7% | Rapid growth in telecom and data center sectors |
| 2024 | 3.5% | Rising electricity demand across industries |
| 2025 | 3.6% | Rising electricity demand across industries |
| 2026 | 2.9% | Increasing adoption of advanced technologies |
| 2027 | 2.5% | Increasing industrial infrastructure investments |
| 2028 | 3.1% | Expansion of transportation and logistics networks |
| 2029 | 2.9% | Increasing smart city development projects |
| 2030 | 2.4% | Growing renewable energy integration projects |
| 2031 | 2.6% | Expansion of manufacturing activities |
| 2032 | 2.1% | Growing urbanization and commercial development |
Note - Market size estimations and growth projections presented in this report are based on 6Wresearch’s advanced forecasting approach, validated with industry datasets as of June 2026.
Key Highlights of the Report:
- United States (US) Polyphenols? Market Outlook
- Market Size of United States (US) Polyphenols? Market, 2025
- Forecast of United States (US) Polyphenols? Market, 2032
- Historical Data and Forecast of United States (US) Polyphenols? Revenues & Volume for the Period 2022-2032F
- United States (US) Polyphenols? Market Trend Evolution
- United States (US) Polyphenols? Market Drivers and Challenges
- United States (US) Polyphenols? Price Trends
- United States (US) Polyphenols? Porter's Five Forces
- United States (US) Polyphenols? Industry Life Cycle
- Historical Data and Forecast of United States (US) Polyphenols? Market Revenues & Volume By Type for the Period 2022-2032F
- Historical Data and Forecast of United States (US) Polyphenols? Market Revenues & Volume By Grape Seed for the Period 2022-2032F
- Historical Data and Forecast of United States (US) Polyphenols? Market Revenues & Volume By Green Tea for the Period 2022-2032F
- Historical Data and Forecast of United States (US) Polyphenols? Market Revenues & Volume By Apple for the Period 2022-2032F
- Historical Data and Forecast of United States (US) Polyphenols? Market Revenues & Volume By Peach for the Period 2022-2032F
- Historical Data and Forecast of United States (US) Polyphenols? Market Revenues & Volume By Citrus for the Period 2022-2032F
- Historical Data and Forecast of United States (US) Polyphenols? Market Revenues & Volume By Olive for the Period 2022-2032F
- Historical Data and Forecast of United States (US) Polyphenols? Market Revenues & Volume By Berries for the Period 2022-2032F
- Historical Data and Forecast of United States (US) Grape Seed Polyphenols? Market Revenues & Volume By Others for the Period 2022-2032F
- Historical Data and Forecast of United States (US) Polyphenols? Market Revenues & Volume By Applications for the Period 2022-2032F
- Historical Data and Forecast of United States (US) Polyphenols? Market Revenues & Volume By Functional Beverages for the Period 2022-2032F
- Historical Data and Forecast of United States (US) Polyphenols? Market Revenues & Volume By Functional Foods for the Period 2022-2032F
- Historical Data and Forecast of United States (US) Polyphenols? Market Revenues & Volume By Dietary Supplements for the Period 2022-2032F
- Historical Data and Forecast of United States (US) Polyphenols? Market Revenues & Volume By Cosmetics & Toiletries for the Period 2022-2032F
- Historical Data and Forecast of United States (US) Polyphenols? Market Revenues & Volume By Animal Feed for the Period 2022-2032F
- Historical Data and Forecast of United States (US) Polyphenols? Market Revenues & Volume By Dyes for the Period 2022-2032F
- Historical Data and Forecast of United States (US) Polyphenols? Market Revenues & Volume By Others for the Period 2022-2032F
- United States (US) Polyphenols? Import Export Trade Statistics
- Market Opportunity Assessment By Type
- Market Opportunity Assessment By Applications
- United States (US) Polyphenols? Top Companies Market Share
- United States (US) Polyphenols? Competitive Benchmarking By Technical and Operational Parameters
- United States (US) Polyphenols? Company Profiles
- United States (US) Polyphenols? Key Strategic Recommendations
Frequently Asked Questions About the Market Study (FAQs):
6Wresearch actively monitors the United States (US) Polyphenols Market and publishes its comprehensive annual report, highlighting emerging trends, growth drivers, revenue analysis, and forecast outlook. Our insights help businesses to make data-backed strategic decisions with ongoing market dynamics. Our analysts track relevent industries related to the United States (US) Polyphenols Market, allowing our clients with actionable intelligence and reliable forecasts tailored to emerging regional needs.
Yes, we provide customisation as per your requirements. To learn more, feel free to contact us on sales@6wresearch.com
1 Executive Summary |
2 Introduction |
2.1 Key Highlights of the Report |
2.2 Report Description |
2.3 Market Scope & Segmentation |
2.4 Research Methodology |
2.5 Assumptions |
3 United States (US) Polyphenols Market Overview |
3.1 United States (US) Country Macro Economic Indicators |
3.2 United States (US) Polyphenols Market Revenues & Volume, 2022 & 2032F |
3.3 United States (US) Polyphenols Market - Industry Life Cycle |
3.4 United States (US) Polyphenols Market - Porter's Five Forces |
3.5 United States (US) Polyphenols Market Revenues & Volume Share, By Type, 2022 & 2032F |
3.6 United States (US) Polyphenols Market Revenues & Volume Share, By Applications, 2022 & 2032F |
4 United States (US) Polyphenols Market Dynamics |
4.1 Impact Analysis |
4.2 Market Drivers |
4.2.1 Increasing consumer awareness about the health benefits of polyphenols |
4.2.2 Growing demand for natural and organic products in the US |
4.2.3 Rising prevalence of chronic diseases driving the demand for functional ingredients like polyphenols |
4.3 Market Restraints |
4.3.1 Seasonal variability in the availability of raw materials for polyphenol extraction |
4.3.2 Regulatory challenges and limitations on health claims related to polyphenols |
4.3.3 High production costs impacting the pricing of polyphenol-enriched products |
5 United States (US) Polyphenols Market Trends |
6 United States (US) Polyphenols Market, By Types |
6.1 United States (US) Polyphenols Market, By Type |
6.1.1 Overview and Analysis |
6.1.2 United States (US) Polyphenols Market Revenues & Volume, By Type, 2022-2032F |
6.1.3 United States (US) Polyphenols Market Revenues & Volume, By Grape Seed, 2022-2032F |
6.1.4 United States (US) Polyphenols Market Revenues & Volume, By Green Tea, 2022-2032F |
6.1.5 United States (US) Polyphenols Market Revenues & Volume, By Apple, 2022-2032F |
6.1.6 United States (US) Polyphenols Market Revenues & Volume, By Peach, 2022-2032F |
6.1.7 United States (US) Polyphenols Market Revenues & Volume, By Citrus, 2022-2032F |
6.1.8 United States (US) Polyphenols Market Revenues & Volume, By Olive, 2022-2032F |
6.1.9 United States (US) Polyphenols Market Revenues & Volume, By Others, 2022-2032F |
6.1.10 United States (US) Polyphenols Market Revenues & Volume, By Others, 2022-2032F |
6.2 United States (US) Polyphenols Market, By Applications |
6.2.1 Overview and Analysis |
6.2.2 United States (US) Polyphenols Market Revenues & Volume, By Functional Beverages, 2022-2032F |
6.2.3 United States (US) Polyphenols Market Revenues & Volume, By Functional Foods, 2022-2032F |
6.2.4 United States (US) Polyphenols Market Revenues & Volume, By Dietary Supplements, 2022-2032F |
6.2.5 United States (US) Polyphenols Market Revenues & Volume, By Cosmetics & Toiletries, 2022-2032F |
6.2.6 United States (US) Polyphenols Market Revenues & Volume, By Animal Feed, 2022-2032F |
6.2.7 United States (US) Polyphenols Market Revenues & Volume, By Dyes, 2022-2032F |
7 United States (US) Polyphenols Market Import-Export Trade Statistics |
7.1 United States (US) Polyphenols Market Export to Major Countries |
7.2 United States (US) Polyphenols Market Imports from Major Countries |
8 United States (US) Polyphenols Market Key Performance Indicators |
8.1 Consumer engagement with polyphenol-rich product promotions and educational content |
8.2 Number of new product launches containing polyphenols in the US market |
8.3 Research and development investments in innovative polyphenol extraction techniques and product formulations |
9 United States (US) Polyphenols Market - Opportunity Assessment |
9.1 United States (US) Polyphenols Market Opportunity Assessment, By Type, 2022 & 2032F |
9.2 United States (US) Polyphenols Market Opportunity Assessment, By Applications, 2022 & 2032F |
10 United States (US) Polyphenols Market - Competitive Landscape |
10.1 United States (US) Polyphenols Market Revenue Share, By Companies, 2025 |
10.2 United States (US) Polyphenols Market Competitive Benchmarking, By Operating and Technical Parameters |
11 Company Profiles |
12 Recommendations |
13 Disclaimer |
Global Go To Market Strategy - 2030
Export potential enables firms to identify high-growth global markets with greater confidence by combining advanced trade intelligence with a structured quantitative methodology. The framework analyzes emerging demand trends and country-level import patterns while integrating macroeconomic and trade datasets such as GDP and population forecasts, bilateral import–export flows, tariff structures, elasticity differentials between developed and developing economies, geographic distance, and import demand projections. Using weighted trade values from 2020–2024 as the base period to project country-to-country export potential for 2030, these inputs are operationalized through calculated drivers such as gravity model parameters, tariff impact factors, and projected GDP per-capita growth. Through an analysis of hidden potentials, demand hotspots, and market conditions that are most favorable to success, this method enables firms to focus on target countries, maximize returns, and global expansion with data, backed by accuracy.
By factoring in the projected importer demand gap that is currently unmet and could be potential opportunity, it identifies the potential for the Exporter (Country) among 190 countries, against the general trade analysis, which identifies the biggest importer or exporter.
To discover high-growth global markets and optimize your business strategy:
Click Here
Pricing
- Single User License$ 1,995
- Department License$ 2,400
- Site License$ 3,120
- Global License$ 3,795

Leadership Perspectives from Industry Events
Search
Thought Leadership and Analyst Meet


Our Clients
6WResearch In News
- India Air Conditioner Market Set for Strong Rebound in 2026 After Weather-Led Correction and GST-Driven Recovery: 6Wresearch
- ADAS in India: How Automatic Emergency Braking, Blind Spot Detection & Driver Monitoring are Transforming Road Safety
- Doha a strategic location for EV manufacturing hub: IPA Qatar
- Demand for luxury TVs surging in the GCC, says Samsung
- Empowering Growth: The Thriving Journey of Bangladesh’s Cable Industry
- Demand for luxury TVs surging in the GCC, says Samsung
Latest Reports
- Nicaragua RPG Gaming Market (2026-2032)
- New Zealand RPG Gaming Market (2026-2032)
- Netherlands RPG Gaming Market (2026-2032)
- Nauru RPG Gaming Market (2026-2032)
- Namibia RPG Gaming Market (2026-2032)
- Mozambique RPG Gaming Market (2026-2032)
- Montenegro RPG Gaming Market (2026-2032)
- Mongolia RPG Gaming Market (2026-2032)
- Monaco RPG Gaming Market (2026-2032)
- Micronesia RPG Gaming Market (2026-2032)
Industry Events and Analyst Meet

HIMTEX 2026

India Refining Summit 2026

India EV Show 2026

EV tech India Expo 2026

Auto Tech Asia 2026
Whitepaper
- Middle East & Africa Commercial Security Market Click here to view more.
- Middle East & Africa Fire Safety Systems & Equipment Market Click here to view more.
- GCC Drone Market Click here to view more.
- Middle East Lighting Fixture Market Click here to view more.
- GCC Physical & Perimeter Security Market Click here to view more.