United States (US) Quantum Dot Market (2025-2031) Outlook | Companies, Share, Analysis, Size, Industry, Forecast, Value, Revenue, Growth & Trends
Market Forecast By Material (Cadmium-based, Cadmium-free), By Product (Displays, Other Products), By Vertical (Consumer, Commercial, Healthcare, Defense, Telecommunications, Others) And Competitive Landscape
| Product Code: ETC4445342 | Publication Date: Jul 2023 | Updated Date: Nov 2025 | Product Type: Report | |
| Publisher: 6Wresearch | Author: Sachin Kumar Rai | No. of Pages: 85 | No. of Figures: 45 | No. of Tables: 25 |
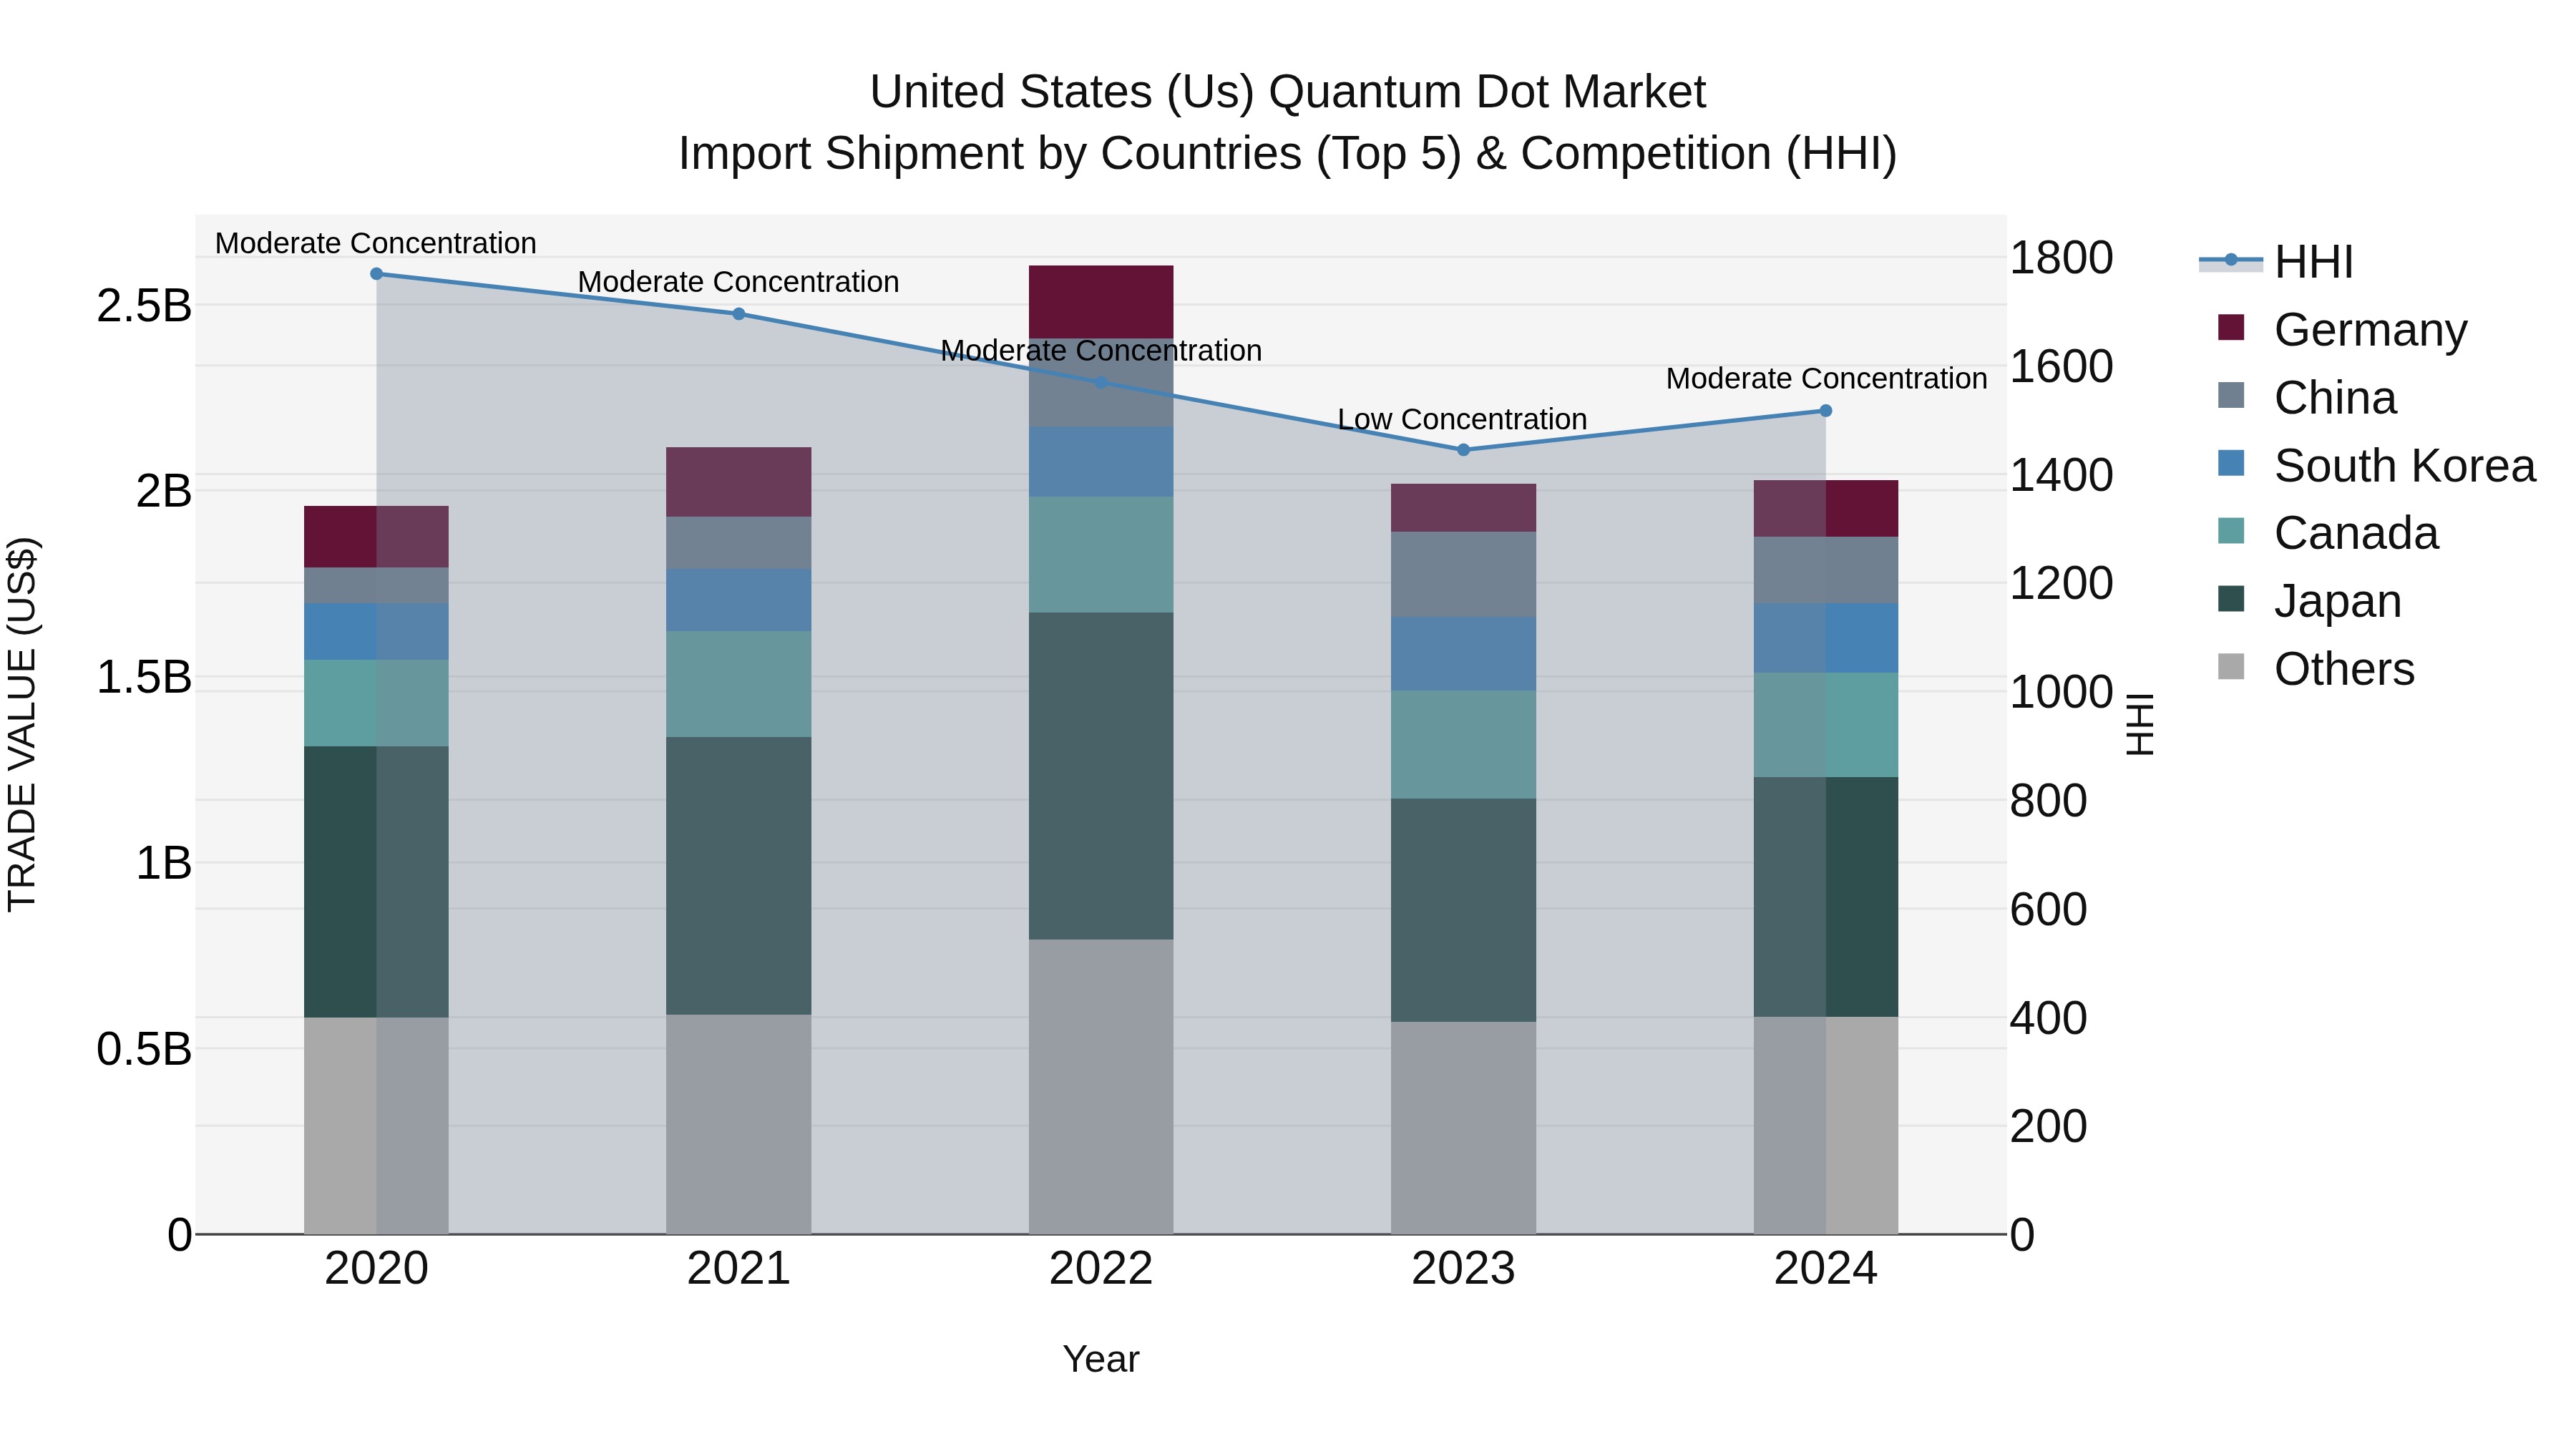
United States (US) Quantum Dot Market Top 5 Importing Countries and Market Competition (HHI) Analysis
The United States saw a steady increase in quantum dot import shipments in 2024, with Japan, Canada, South Korea, China, and Taiwan being the top exporting countries. The market concentration, as measured by the HHI, shifted from low to moderate in 2024, indicating a more balanced distribution among suppliers. The compound annual growth rate (CAGR) from 2020 to 2024 stood at 0.87%, showing a gradual expansion in the market. Additionally, the growth rate from 2023 to 2024 was 0.44%, suggesting a slight acceleration in import volumes during that period.
United States (US) Quantum Dot Market Overview
The United States Quantum Dot Market is witnessing significant growth driven by increasing demand for quantum dot technology across various industries such as consumer electronics, healthcare, and defense. Quantum dots offer advantages such as high brightness, wide color gamut, and energy efficiency, making them ideal for applications in displays, LED lighting, and medical imaging. The market is characterized by the presence of key players like Nanosys Inc., Quantum Materials Corporation, and QD Vision Inc., who are investing in research and development to enhance product offerings and expand their market presence. With ongoing advancements in quantum dot technology and rising adoption in different sectors, the US Quantum Dot Market is expected to experience continued growth in the coming years.
United States (US) Quantum Dot Market Trends and Opportunities
The US Quantum Dot Market is experiencing rapid growth due to the increasing demand for high-quality displays in electronic devices, particularly in the television and smartphone sectors. Quantum dots offer superior color accuracy, brightness, and energy efficiency compared to traditional display technologies, driving their adoption in the market. Additionally, the rising focus on sustainability and environmental concerns is fueling the demand for quantum dot technology as it enables energy savings and reduced carbon footprint. Opportunities in the US Quantum Dot Market lie in expanding applications beyond displays to areas such as healthcare, solar cells, and security tagging. Companies investing in research and development to enhance quantum dot performance and production processes are poised to benefit from this growing market.
United States (US) Quantum Dot Market Challenges
The United States Quantum Dot Market faces several challenges, including regulatory hurdles related to the safe use and disposal of quantum dots due to their potential environmental impact. Additionally, there is a need for increased awareness and education among consumers and businesses about the benefits and applications of quantum dots to drive market adoption. Competition from other advanced display technologies and the high cost of production are also significant challenges that hinder the growth of the market. Furthermore, the lack of standardization in manufacturing processes and quality control measures poses a risk to the consistency and reliability of quantum dot products in the market. Overcoming these challenges will require collaboration between industry stakeholders, government bodies, and research institutions to address regulatory concerns, improve production efficiency, and enhance market understanding.
United States (US) Quantum Dot Market Drivers
The United States Quantum Dot Market is being primarily driven by the increasing demand for high-quality displays in consumer electronics such as smartphones, TVs, and laptops. Quantum dots offer superior color accuracy, brightness, and energy efficiency compared to traditional display technologies, making them a popular choice among manufacturers and consumers. Additionally, the growing adoption of quantum dots in healthcare for applications such as bioimaging and drug delivery is fueling market growth. Advancements in quantum dot technology, such as the development of cadmium-free quantum dots, are also driving market expansion by addressing environmental concerns and regulatory restrictions. Overall, the US Quantum Dot Market is expected to continue growing due to the increasing need for advanced display technologies and the expanding applications of quantum dots across various industries.
United States (US) Quantum Dot Market Government Policies
The US government has shown a commitment to supporting the Quantum Dot Market through various policies and initiatives. These include investments in research and development, funding for technology commercialization, and strategic partnerships with industry stakeholders. Additionally, regulatory efforts have been focused on ensuring the safety and security of Quantum Dot technologies, as well as promoting domestic manufacturing and supply chain resilience. Overall, the government`s policies are aimed at fostering innovation, driving economic growth, and maintaining competitiveness in the global Quantum Dot Market.
United States (US) Quantum Dot Market Future Outlook
The future outlook for the United States Quantum Dot Market appears promising, with significant growth potential projected in the coming years. Factors such as increasing demand for quantum dot technology in applications such as displays, healthcare, and energy efficiency, coupled with ongoing research and development efforts to enhance quantum dot performance, are expected to drive market expansion. The US market is likely to benefit from collaborations between industry players and research institutions to develop innovative quantum dot-based products. Additionally, the growing focus on sustainability and environmental concerns is anticipated to further boost the adoption of quantum dots in various sectors. Overall, the US Quantum Dot Market is forecasted to experience robust growth and technological advancements in the foreseeable future.
Key Highlights of the Report:
- United States (US) Quantum Dot Market Outlook
- Market Size of United States (US) Quantum Dot Market, 2024
- Forecast of United States (US) Quantum Dot Market, 2031
- Historical Data and Forecast of United States (US) Quantum Dot Revenues & Volume for the Period 2021 - 2031
- United States (US) Quantum Dot Market Trend Evolution
- United States (US) Quantum Dot Market Drivers and Challenges
- United States (US) Quantum Dot Price Trends
- United States (US) Quantum Dot Porter's Five Forces
- United States (US) Quantum Dot Industry Life Cycle
- Historical Data and Forecast of United States (US) Quantum Dot Market Revenues & Volume By Material for the Period 2021 - 2031
- Historical Data and Forecast of United States (US) Quantum Dot Market Revenues & Volume By Cadmium-based for the Period 2021 - 2031
- Historical Data and Forecast of United States (US) Quantum Dot Market Revenues & Volume By Cadmium-free for the Period 2021 - 2031
- Historical Data and Forecast of United States (US) Quantum Dot Market Revenues & Volume By Product for the Period 2021 - 2031
- Historical Data and Forecast of United States (US) Quantum Dot Market Revenues & Volume By Displays for the Period 2021 - 2031
- Historical Data and Forecast of United States (US) Quantum Dot Market Revenues & Volume By Other Products for the Period 2021 - 2031
- Historical Data and Forecast of United States (US) Quantum Dot Market Revenues & Volume By Vertical for the Period 2021 - 2031
- Historical Data and Forecast of United States (US) Quantum Dot Market Revenues & Volume By Consumer for the Period 2021 - 2031
- Historical Data and Forecast of United States (US) Quantum Dot Market Revenues & Volume By Commercial for the Period 2021 - 2031
- Historical Data and Forecast of United States (US) Quantum Dot Market Revenues & Volume By Healthcare for the Period 2021 - 2031
- Historical Data and Forecast of United States (US) Quantum Dot Market Revenues & Volume By Defense for the Period 2021 - 2031
- Historical Data and Forecast of United States (US) Quantum Dot Market Revenues & Volume By Telecommunications for the Period 2021 - 2031
- Historical Data and Forecast of United States (US) Quantum Dot Market Revenues & Volume By Others for the Period 2021 - 2031
- United States (US) Quantum Dot Import Export Trade Statistics
- Market Opportunity Assessment By Material
- Market Opportunity Assessment By Product
- Market Opportunity Assessment By Vertical
- United States (US) Quantum Dot Top Companies Market Share
- United States (US) Quantum Dot Competitive Benchmarking By Technical and Operational Parameters
- United States (US) Quantum Dot Company Profiles
- United States (US) Quantum Dot Key Strategic Recommendations
Frequently Asked Questions About the Market Study (FAQs):
6Wresearch actively monitors the United States (US) Quantum Dot Market and publishes its comprehensive annual report, highlighting emerging trends, growth drivers, revenue analysis, and forecast outlook. Our insights help businesses to make data-backed strategic decisions with ongoing market dynamics. Our analysts track relevent industries related to the United States (US) Quantum Dot Market, allowing our clients with actionable intelligence and reliable forecasts tailored to emerging regional needs.
Yes, we provide customisation as per your requirements. To learn more, feel free to contact us on sales@6wresearch.com
1 Executive Summary |
2 Introduction |
2.1 Key Highlights of the Report |
2.2 Report Description |
2.3 Market Scope & Segmentation |
2.4 Research Methodology |
2.5 Assumptions |
3 United States (US) Quantum Dot Market Overview |
3.1 United States (US) Country Macro Economic Indicators |
3.2 United States (US) Quantum Dot Market Revenues & Volume, 2021 & 2031F |
3.3 United States (US) Quantum Dot Market - Industry Life Cycle |
3.4 United States (US) Quantum Dot Market - Porter's Five Forces |
3.5 United States (US) Quantum Dot Market Revenues & Volume Share, By Material , 2021 & 2031F |
3.6 United States (US) Quantum Dot Market Revenues & Volume Share, By Product , 2021 & 2031F |
3.7 United States (US) Quantum Dot Market Revenues & Volume Share, By Vertical , 2021 & 2031F |
4 United States (US) Quantum Dot Market Dynamics |
4.1 Impact Analysis |
4.2 Market Drivers |
4.2.1 Growing demand for quantum dots in electronics and display technologies |
4.2.2 Increasing adoption of quantum dots in healthcare and biotechnology applications |
4.2.3 Rising investment in research and development of quantum dot technology |
4.3 Market Restraints |
4.3.1 High production costs associated with quantum dot manufacturing |
4.3.2 Regulatory challenges related to the use of toxic materials in quantum dots |
4.3.3 Limited awareness and understanding of quantum dots among end-users |
5 United States (US) Quantum Dot Market Trends |
6 United States (US) Quantum Dot Market, By Types |
6.1 United States (US) Quantum Dot Market, By Material |
6.1.1 Overview and Analysis |
6.1.2 United States (US) Quantum Dot Market Revenues & Volume, By Material , 2021 - 2031F |
6.1.3 United States (US) Quantum Dot Market Revenues & Volume, By Cadmium-based, 2021 - 2031F |
6.1.4 United States (US) Quantum Dot Market Revenues & Volume, By Cadmium-free, 2021 - 2031F |
6.2 United States (US) Quantum Dot Market, By Product |
6.2.1 Overview and Analysis |
6.2.2 United States (US) Quantum Dot Market Revenues & Volume, By Displays, 2021 - 2031F |
6.2.3 United States (US) Quantum Dot Market Revenues & Volume, By Other Products, 2021 - 2031F |
6.3 United States (US) Quantum Dot Market, By Vertical |
6.3.1 Overview and Analysis |
6.3.2 United States (US) Quantum Dot Market Revenues & Volume, By Consumer, 2021 - 2031F |
6.3.3 United States (US) Quantum Dot Market Revenues & Volume, By Commercial, 2021 - 2031F |
6.3.4 United States (US) Quantum Dot Market Revenues & Volume, By Healthcare, 2021 - 2031F |
6.3.5 United States (US) Quantum Dot Market Revenues & Volume, By Defense, 2021 - 2031F |
6.3.6 United States (US) Quantum Dot Market Revenues & Volume, By Telecommunications, 2021 - 2031F |
6.3.7 United States (US) Quantum Dot Market Revenues & Volume, By Others, 2021 - 2031F |
7 United States (US) Quantum Dot Market Import-Export Trade Statistics |
7.1 United States (US) Quantum Dot Market Export to Major Countries |
7.2 United States (US) Quantum Dot Market Imports from Major Countries |
8 United States (US) Quantum Dot Market Key Performance Indicators |
8.1 Average selling price (ASP) of quantum dots |
8.2 Number of research publications on quantum dot technology |
8.3 Percentage of companies investing in quantum dot research and development |
8.4 Adoption rate of quantum dots in new applications |
8.5 Number of patents filed for quantum dot innovations |
9 United States (US) Quantum Dot Market - Opportunity Assessment |
9.1 United States (US) Quantum Dot Market Opportunity Assessment, By Material , 2021 & 2031F |
9.2 United States (US) Quantum Dot Market Opportunity Assessment, By Product , 2021 & 2031F |
9.3 United States (US) Quantum Dot Market Opportunity Assessment, By Vertical , 2021 & 2031F |
10 United States (US) Quantum Dot Market - Competitive Landscape |
10.1 United States (US) Quantum Dot Market Revenue Share, By Companies, 2024 |
10.2 United States (US) Quantum Dot Market Competitive Benchmarking, By Operating and Technical Parameters |
11 Company Profiles |
12 Recommendations |
13 Disclaimer |
Export potential assessment - trade Analytics for 2030
Export potential enables firms to identify high-growth global markets with greater confidence by combining advanced trade intelligence with a structured quantitative methodology. The framework analyzes emerging demand trends and country-level import patterns while integrating macroeconomic and trade datasets such as GDP and population forecasts, bilateral import–export flows, tariff structures, elasticity differentials between developed and developing economies, geographic distance, and import demand projections. Using weighted trade values from 2020–2024 as the base period to project country-to-country export potential for 2030, these inputs are operationalized through calculated drivers such as gravity model parameters, tariff impact factors, and projected GDP per-capita growth. Through an analysis of hidden potentials, demand hotspots, and market conditions that are most favorable to success, this method enables firms to focus on target countries, maximize returns, and global expansion with data, backed by accuracy.
By factoring in the projected importer demand gap that is currently unmet and could be potential opportunity, it identifies the potential for the Exporter (Country) among 190 countries, against the general trade analysis, which identifies the biggest importer or exporter.
To discover high-growth global markets and optimize your business strategy:
Click Here
Pricing
- Single User License$ 1,995
- Department License$ 2,400
- Site License$ 3,120
- Global License$ 3,795

Search
Thought Leadership and Analyst Meet


Our Clients
Latest Reports
- Canada Cloud CFD Market (2026-2032) | Size & Revenue, Industry, Growth, Competitive Landscape, Forecast, Segmentation, Value, Outlook, Trends, Share, Analysis, Companies
- Taiwan Food Delivery Platform Market (2026-2032) | Companies, Outlook, Analysis, Trends, Value, Revenue, Segmentation, Share, Forecast, Competitive Landscape, Growth, Size & Forecast
- United Kingdom (UK) Long-term Care Insurance Market (2026-2032) | Growth, Share, Consumer Insights, Drivers, Opportunities, Competition, Pricing Analysis, Segments, Restraints, Companies, Competitive, Value, Outlook, Size, Demand, Analysis, Challenges, Strategic Insights, Investment Trends, Revenue, Trends, Supply, Forecast
- United Kingdom (UK) Long Term Care Market (2026-2032) | Companies, Outlook, Analysis, Trends, Value, Revenue, Segmentation, Share, Forecast, Competitive Landscape, Growth, Size & Forecast
- Iraq Insulation and Waterproofing Market (2026-2032) | Outlook, Drivers, Growth, Size, Share, Industry, Revenue, Trends, Demand, Competitive, Strategic Insights, Opportunities, Segments, Companies, Challenges, Strategy, Consumer Insights, Analysis, Investment Trends, Value, Segmentation, Forecast, Restraints
- India Switchgear Market Outlook (2026-2032) | Size, Share, Trends, Growth, Revenue, Forecast, Analysis, Value, Outlook
- Pakistan Contraceptive Implants Market (2025-2031) | Demand, Growth, Size, Share, Industry, Pricing Analysis, Competitive, Strategic Insights, Strategy, Consumer Insights, Analysis, Investment Trends, Opportunities, Revenue, Segments, Value, Segmentation, Supply, Forecast, Restraints, Outlook, Competition, Drivers, Trends, Companies, Challenges
- Sri Lanka Packaging Market (2026-2032) | Outlook, Competition, Drivers, Trends, Demand, Pricing Analysis, Competitive, Strategic Insights, Companies, Challenges, Strategy, Consumer Insights, Analysis, Investment Trends, Opportunities, Growth, Size, Share, Industry, Revenue, Segments, Value, Segmentation, Supply, Forecast, Restraints
- India Kids Watches Market (2026-2032) | Strategy, Consumer Insights, Analysis, Investment Trends, Opportunities, Growth, Size, Share, Industry, Revenue, Segments, Value, Segmentation, Supply, Forecast, Restraints, Outlook, Competition, Drivers, Trends, Demand, Pricing Analysis, Competitive, Strategic Insights, Companies, Challenges
- Saudi Arabia Core Assurance Service Market (2025-2031) | Strategy, Consumer Insights, Analysis, Investment Trends, Opportunities, Growth, Size, Share, Industry, Revenue, Segments, Value, Segmentation, Supply, Forecast, Restraints, Outlook, Competition, Drivers, Trends, Demand, Pricing Analysis, Competitive, Strategic Insights, Companies, Challenges
Industry Events and Analyst Meet

India EV Show 2026

EV tech India Expo 2026

Auto Tech Asia 2026

Battery Tech India 2026

Smart Production Solutions Guangzhou 2026
Whitepaper
- Middle East & Africa Commercial Security Market Click here to view more.
- Middle East & Africa Fire Safety Systems & Equipment Market Click here to view more.
- GCC Drone Market Click here to view more.
- Middle East Lighting Fixture Market Click here to view more.
- GCC Physical & Perimeter Security Market Click here to view more.
6WResearch In News
- Doha a strategic location for EV manufacturing hub: IPA Qatar
- Demand for luxury TVs surging in the GCC, says Samsung
- Empowering Growth: The Thriving Journey of Bangladesh’s Cable Industry
- Demand for luxury TVs surging in the GCC, says Samsung
- Video call with a traditional healer? Once unthinkable, it’s now common in South Africa
- Intelligent Buildings To Smooth GCC’s Path To Net Zero