United States (US) Service Delivery Automation Market Size & Growth Rate (2026-2032)
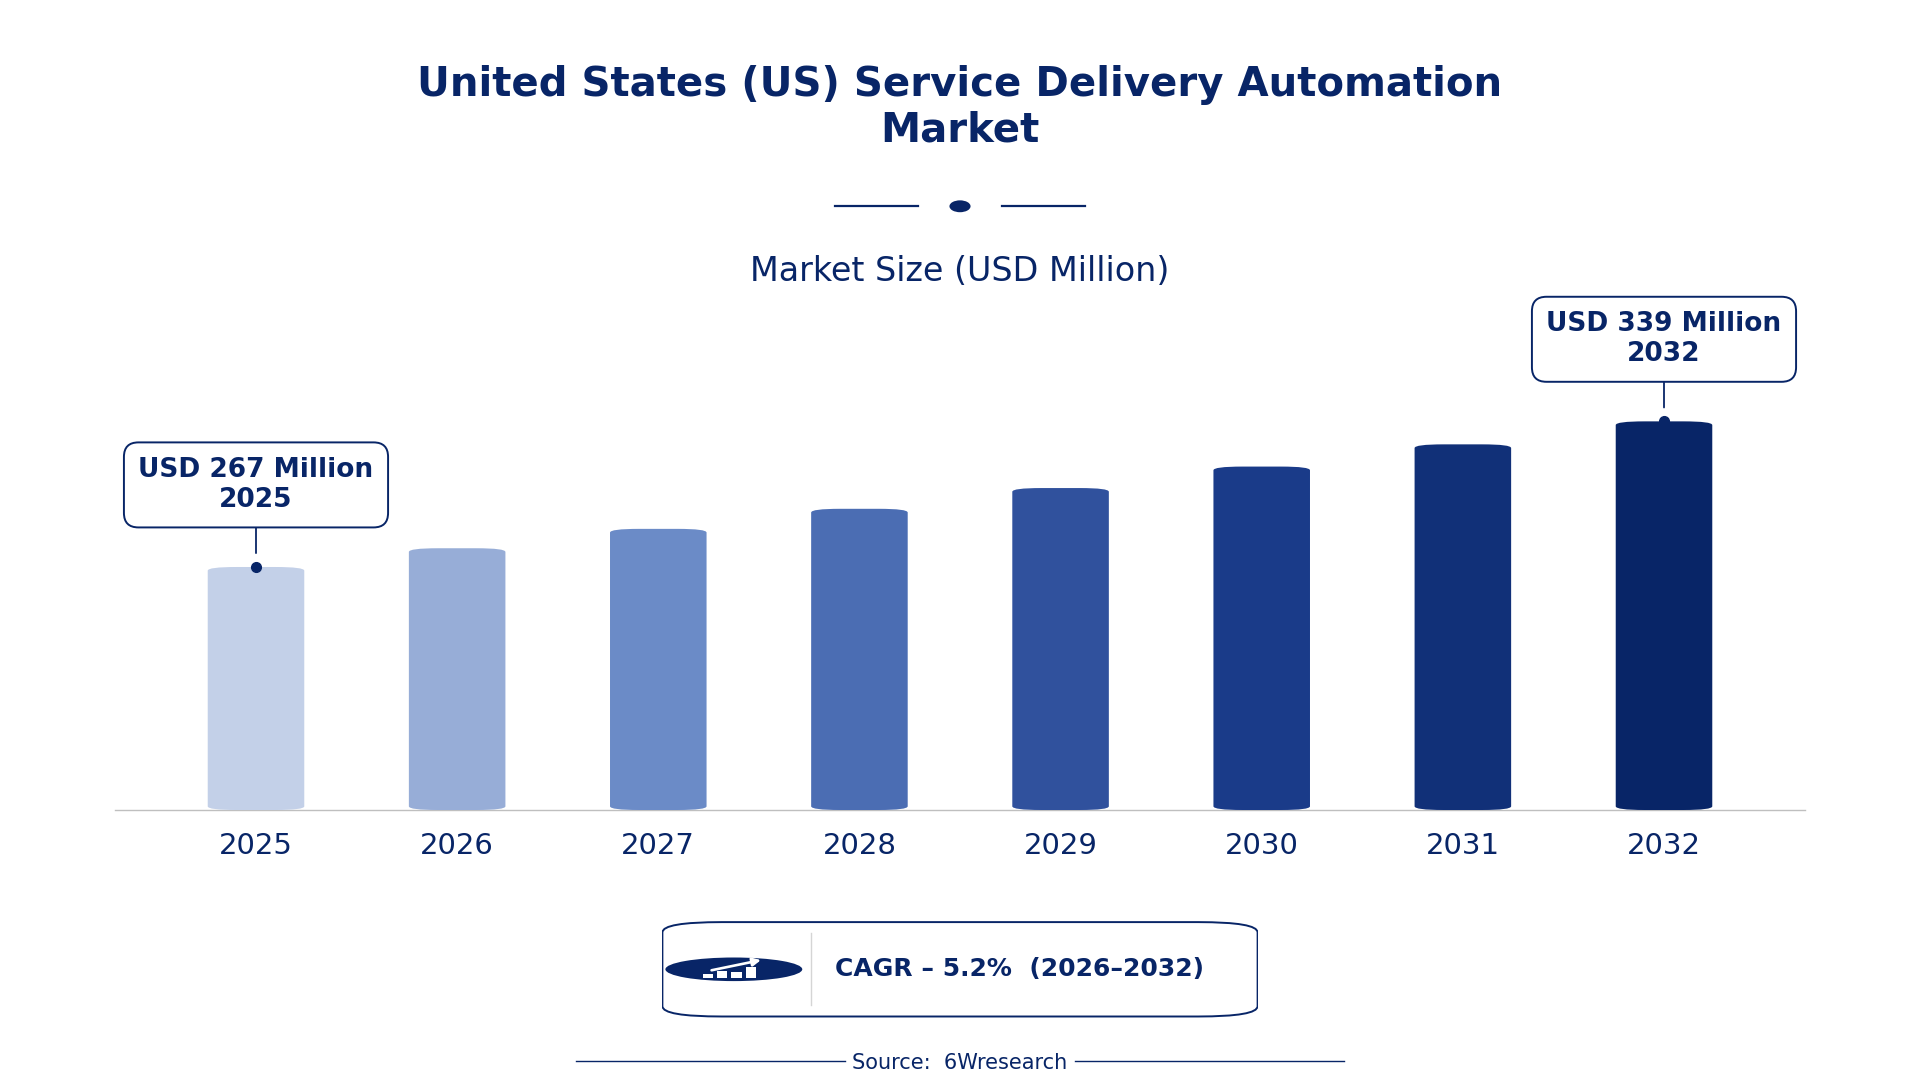
The United States (US) Service Delivery Automation Market was estimated at USD 267 Million in 2025 and is projected to reach USD 339 Million by 2032, growing at a CAGR of 5.2% from 2026 to 2032.
United States (US) Service Delivery Automation Market Synopsis
The US Service Delivery Automation Market has gained substantial traction in recent years, primarily fueled by the growing need for efficiency in business operations. As organizations recognize the benefits of automation technologies, there is a significant push towards integrating these solutions across various sectors.
Looking ahead, the market is set to evolve as businesses adapt to new challenges and opportunities presented by automation. The rise of advanced technologies, such as AI and machine learning, will further reshape service delivery, pushing companies to rethink their operational strategies and customer engagement approaches.
United States (US) Service Delivery Automation Market Year-wise Growth Rate and Key Drivers
This graph illustrates the annual growth rates of the United States (US) Service Delivery Automation Market from 2021 to 2032, highlighting a steady upward trajectory and projected expansion over the forecast period.
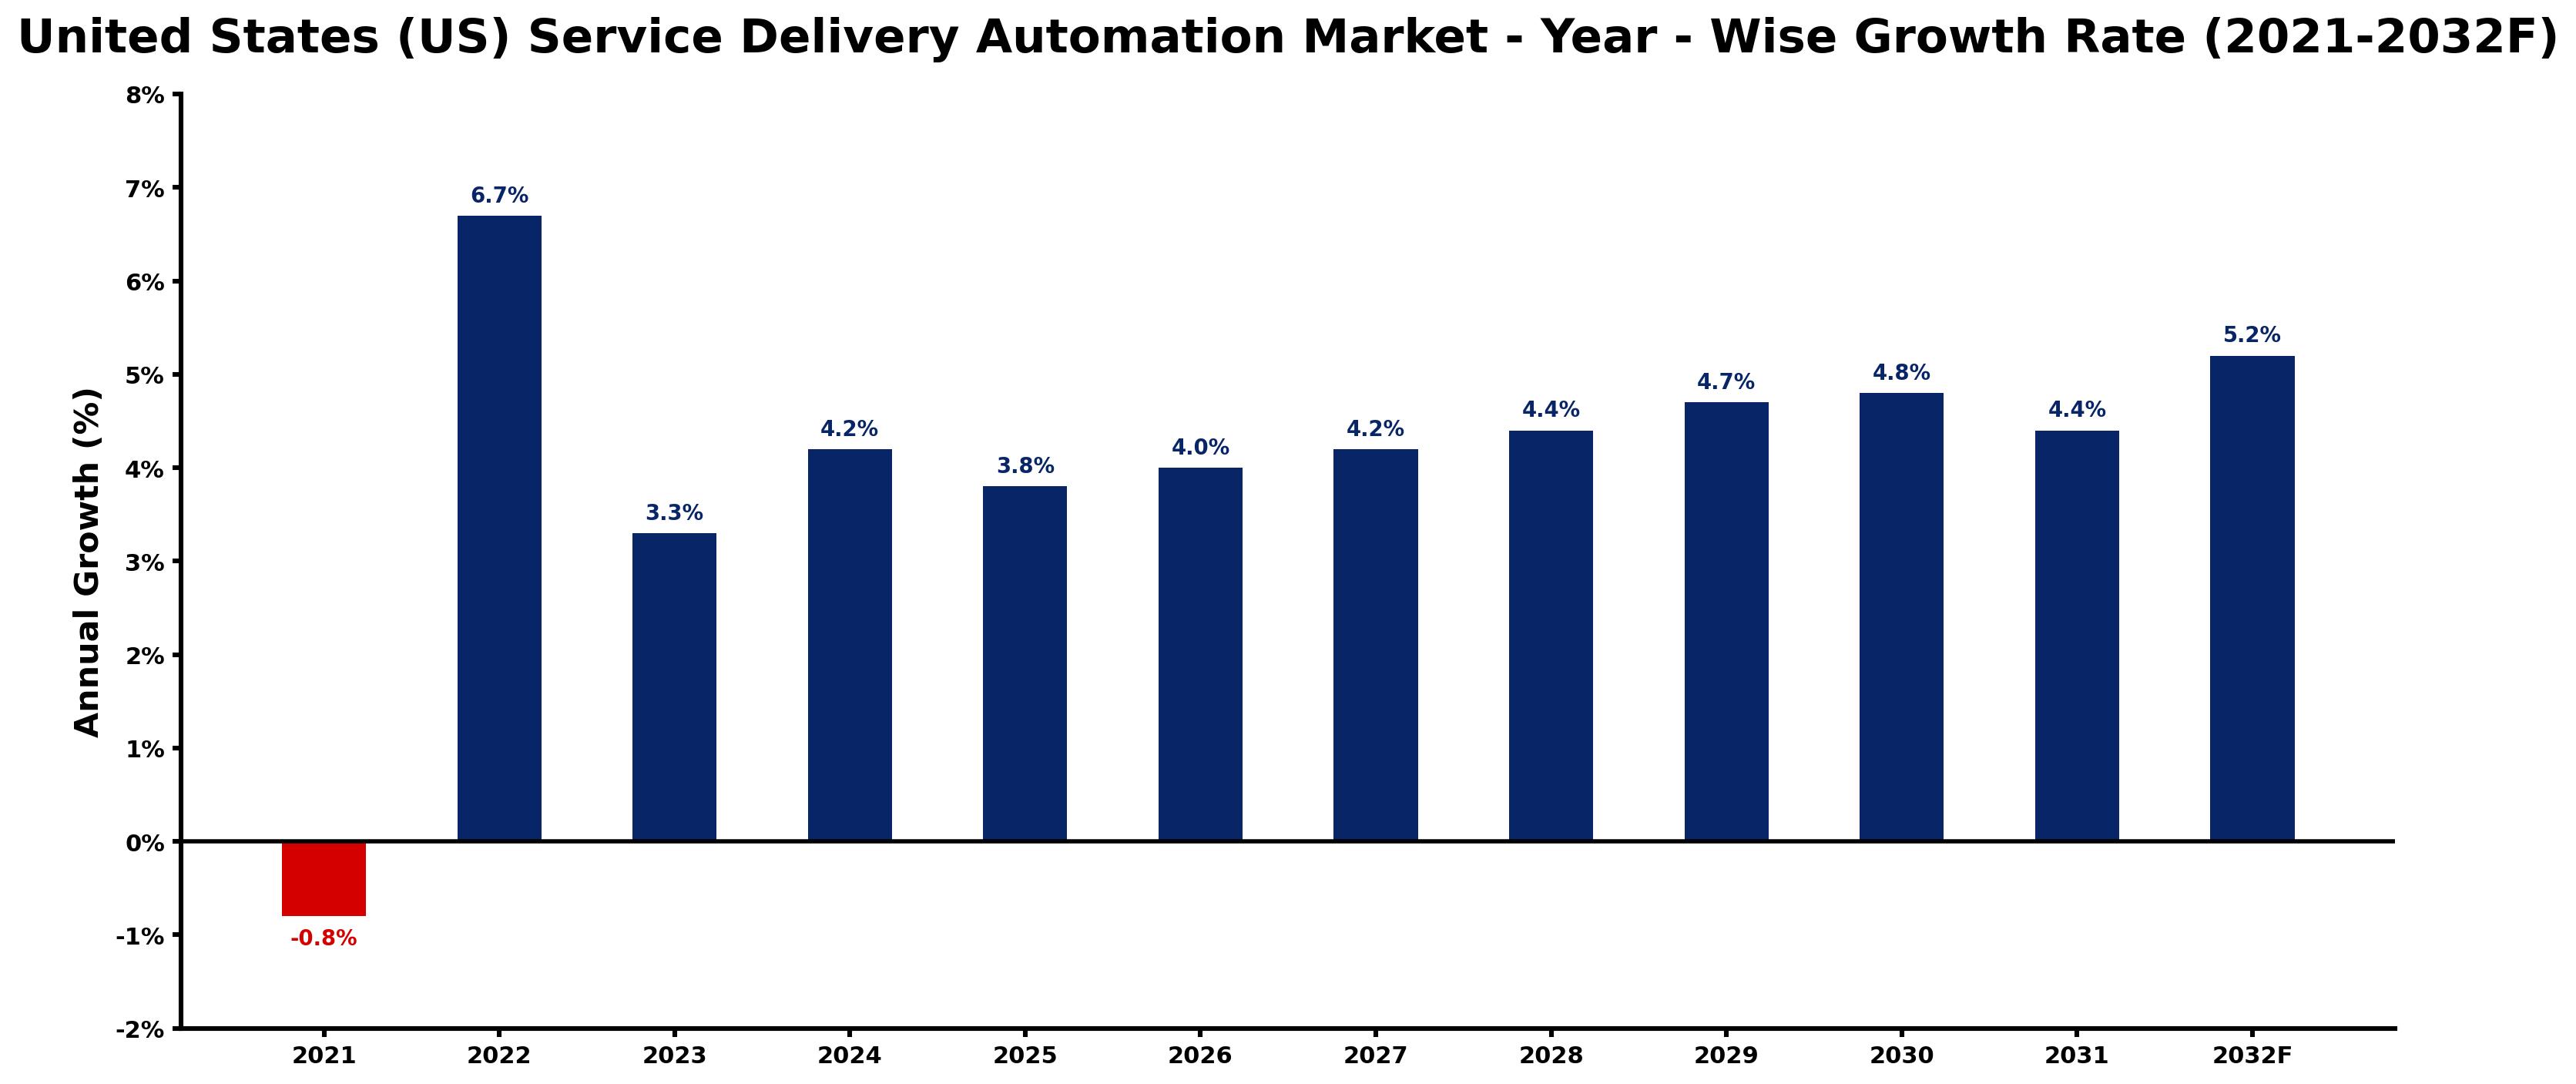
The table below presents the year‑wise growth rates along with the key drivers influencing the market
| Year | Growth Rate | Major Drivers |
| 2021 | -0.8% | Stricter FTC regulations on data privacy impacting automation |
| 2022 | 6.7% | Increased adoption of RPA by healthcare providers. |
| 2023 | 3.3% | Government push for automated public service efficiency. |
| 2024 | 4.2% | Surge in demand for contactless customer service solutions. |
| 2025 | 3.8% | Growth in AI-powered chatbots in retail sector. |
| 2026 | 4.0% | Rising labor shortages driving automation investments. |
| 2027 | 4.2% | Financial services adopting automation for regulatory compliance. |
| 2028 | 4.4% | Enhanced cybersecurity regulations promoting automated solutions. |
| 2029 | 4.7% | SMBs leveraging automation for competitive advantage. |
| 2030 | 4.8% | E-commerce sector prioritizing automation for order fulfillment. |
| 2031 | 4.4% | Telecommunications increasing automation for customer experience enhancements. |
| 2032 | 5.2% | Healthcare industry expanding automation for patient management. |
Note: Market size estimations and growth projections presented in this report are based on 6Wresearch's proprietary forecasting methodology, utilizing the latest available industry data, government publications, and primary research inputs.
United States (US) Service Delivery Automation Market Key Takeaways
Below are some of the specific key takeaways from the market, including:
- The market is characterized by diverse automation solutions such as RPA, chatbots, and cognitive tools.
- Integration challenges and data security concerns are significant barriers for companies adopting automation technologies.
- Healthcare and finance sectors are leading adopters of service delivery automation solutions.
- The COVID-19 pandemic accelerated the shift towards automation to maintain business continuity.
- Investment opportunities are emerging in sectors focusing on efficiency and customer experience enhancements.
Evaluation of Restraints in United States (US) Service Delivery Automation Market
Despite the positive outlook, several restraints hinder the growth of the US Service Delivery Automation Market. A primary concern is the integration of automation technologies with existing systems, which often leads to interoperability issues. Many organizations grapple with legacy systems that are not easily compatible with new automation solutions.
Additionally, data security and compliance with regulatory standards pose substantial challenges. As businesses prioritize automation, ensuring that sensitive data remains protected becomes increasingly complex. The potential impact on workforce dynamics, with automation replacing certain roles, further complicates the transition to automated service delivery.
United States (US) Service Delivery Automation Market Trends
The current trends in the US Service Delivery Automation Market reflect a strong emphasis on enhancing operational efficiency through technology. The adoption of RPA is particularly prominent, as companies automate repetitive tasks to allocate human resources towards more strategic activities.
Cloud-based automation solutions are gaining momentum due to their scalability and flexibility, making them attractive options for organizations of all sizes. The integration of AI and machine learning is driving innovations in customer service, allowing for more personalized interactions and efficient response times.
United States (US) Service Delivery Automation Market Opportunities
The market presents numerous investment opportunities, particularly in sectors that are under pressure to improve efficiency and reduce operational costs. Companies that specialize in RPA and AI-driven solutions are positioned to benefit significantly as demand for automation grows.
on top of that, as organizations continue to invest in digital transformation, there is an increasing need for automation tools that enhance customer experiences. Areas such as healthcare, finance, and customer service stand out as prime targets for investment, as they seek to streamline processes and improve service delivery.
Government Initiatives in the United States (US) Service Delivery Automation Market
Government policies are actively shaping the growth of the US Service Delivery Automation Market by promoting innovation and efficiency in various sectors. The emphasis on adopting automation technologies is evident in initiatives aimed at enhancing productivity and service quality, particularly in public services and healthcare.
- A recently completed initiative aimed at upgrading public health systems through automation tools to streamline patient care and data management.
- A current program focused on integrating automation in financial services to enhance transaction efficiency and reduce processing times.
- Planned legislation that will provide tax incentives for companies investing in automation technologies to foster job creation in tech sectors.
- A public-private partnership initiative underway to improve infrastructure for digital services, enhancing access to automation technologies.
Future Insights of the United States (US) Service Delivery Automation Market
The future of the US Service Delivery Automation Market looks promising, driven by the escalating demand for efficiency and cost reduction across industries. As organizations increasingly adopt advanced technologies, the market is likely to witness a surge in investment in automation solutions.
With continuous advancements in AI and machine learning, companies will find innovative ways to enhance service delivery and customer engagement. As digital transformation initiatives gain momentum, the market is set for sustained growth, presenting exciting opportunities for providers of automation solutions.
United States (US) Service Delivery Automation Market Latest Developments
In the past year, the US Service Delivery Automation Market has seen several noteworthy developments. Companies are increasingly launching innovative automation solutions designed to meet the evolving needs of businesses, reflecting a robust commitment to enhancing service efficiency.
- A major technology vendor introduced a new AI-driven chatbot system aimed at improving customer interactions, with the launch occurring in early 2025 and ongoing updates planned.
- An initiative that began in late 2025 focuses on integrating RPA solutions within financial institutions to streamline back-office operations, currently underway.
- A leading regional operator is planning to roll out a comprehensive automation framework across its customer service divisions, expected to begin in Q3 2026.
- A recent partnership formed between two tech companies aims to develop next-generation automation tools tailored for the healthcare sector, launched in early 2025.
United States (US) Service Delivery Automation Market - Key Attractiveness of the Report
- 10 Years of Market Numbers
- Historical Data Starting from 2022 to 2025
- Base Year: 2025
- Forecast Data until 2032
- Key Performance Indicators Impacting the Market
- Major Upcoming Developments and Projects
Key Highlights of the Report:
- United States (US) Service Delivery Automation Market Outlook
- Market Size of United States (US) Service Delivery Automation Market, 2025
- Forecast of United States (US) Service Delivery Automation Market, 2032
- Historical Data and Forecast of United States (US) Service Delivery Automation Revenues & Volume for the Period 2022-2032F
- United States (US) Service Delivery Automation Market Trend Evolution
- United States (US) Service Delivery Automation Market Drivers and Challenges
- United States (US) Service Delivery Automation Price Trends
- United States (US) Service Delivery Automation Porter's Five Forces
- United States (US) Service Delivery Automation Industry Life Cycle
- Historical Data and Forecast of United States (US) Service Delivery Automation Market Revenues & Volume By Type for the Period 2022-2032F
- Historical Data and Forecast of United States (US) Service Delivery Automation Market Revenues & Volume By IT Process Automation for the Period 2022-2032F
- Historical Data and Forecast of United States (US) Service Delivery Automation Market Revenues & Volume By Business Process Automation for the Period 2022-2032F
- Historical Data and Forecast of United States (US) Service Delivery Automation Market Revenues & Volume By Vertical for the Period 2022-2032F
- Historical Data and Forecast of United States (US) Service Delivery Automation Market Revenues & Volume By BFSI for the Period 2022-2032F
- Historical Data and Forecast of United States (US) Service Delivery Automation Market Revenues & Volume By IT, Telecommunication & Media for the Period 2022-2032F
- Historical Data and Forecast of United States (US) Service Delivery Automation Market Revenues & Volume By Travel, Hospitality & Transportation for the Period 2022-2032F
- Historical Data and Forecast of United States (US) Service Delivery Automation Market Revenues & Volume By Retail & Consumer Goods for the Period 2022-2032F
- Historical Data and Forecast of United States (US) Service Delivery Automation Market Revenues & Volume By Healthcare & Pharmaceuticals for the Period 2022-2032F
- Historical Data and Forecast of United States (US) Service Delivery Automation Market Revenues & Volume By Manufacturing & Logistics for the Period 2022-2032F
- Historical Data and Forecast of United States (US) Service Delivery Automation Market Revenues & Volume By Others for the Period 2022-2032F
- Historical Data and Forecast of United States (US) Service Delivery Automation Market Revenues & Volume By Organization Size for the Period 2022-2032F
- Historical Data and Forecast of United States (US) Service Delivery Automation Market Revenues & Volume By Large Enterprises for the Period 2022-2032F
- Historical Data and Forecast of United States (US) Service Delivery Automation Market Revenues & Volume By SME??s for the Period 2022-2032F
- United States (US) Service Delivery Automation Import Export Trade Statistics
- Market Opportunity Assessment By Type
- Market Opportunity Assessment By Vertical
- Market Opportunity Assessment By Organization Size
- United States (US) Service Delivery Automation Top Companies Market Share
- United States (US) Service Delivery Automation Competitive Benchmarking By Technical and Operational Parameters
- United States (US) Service Delivery Automation Company Profiles
- United States (US) Service Delivery Automation Key Strategic Recommendations






































