United States (US) Table Sauces Market (2025-2031) | Industry, Trends, Competitive Landscape, Growth, Size & Revenue, Analysis, Forecast, Value, Outlook, Share, Segmentation, Companies
Market Forecast By Type (Table Sauces, Dips, Cooking Sauces, Paste and Purees, Pickled Products, Others), By Application (Specialist Retailers, Supermarkets/Hypermarkets, Convenience Stores, Others) And Competitive Landscape
| Product Code: ETC9977758 | Publication Date: Sep 2024 | Updated Date: Nov 2025 | Product Type: Market Research Report | |
| Publisher: 6Wresearch | Author: Shubham Padhi | No. of Pages: 75 | No. of Figures: 35 | No. of Tables: 20 |
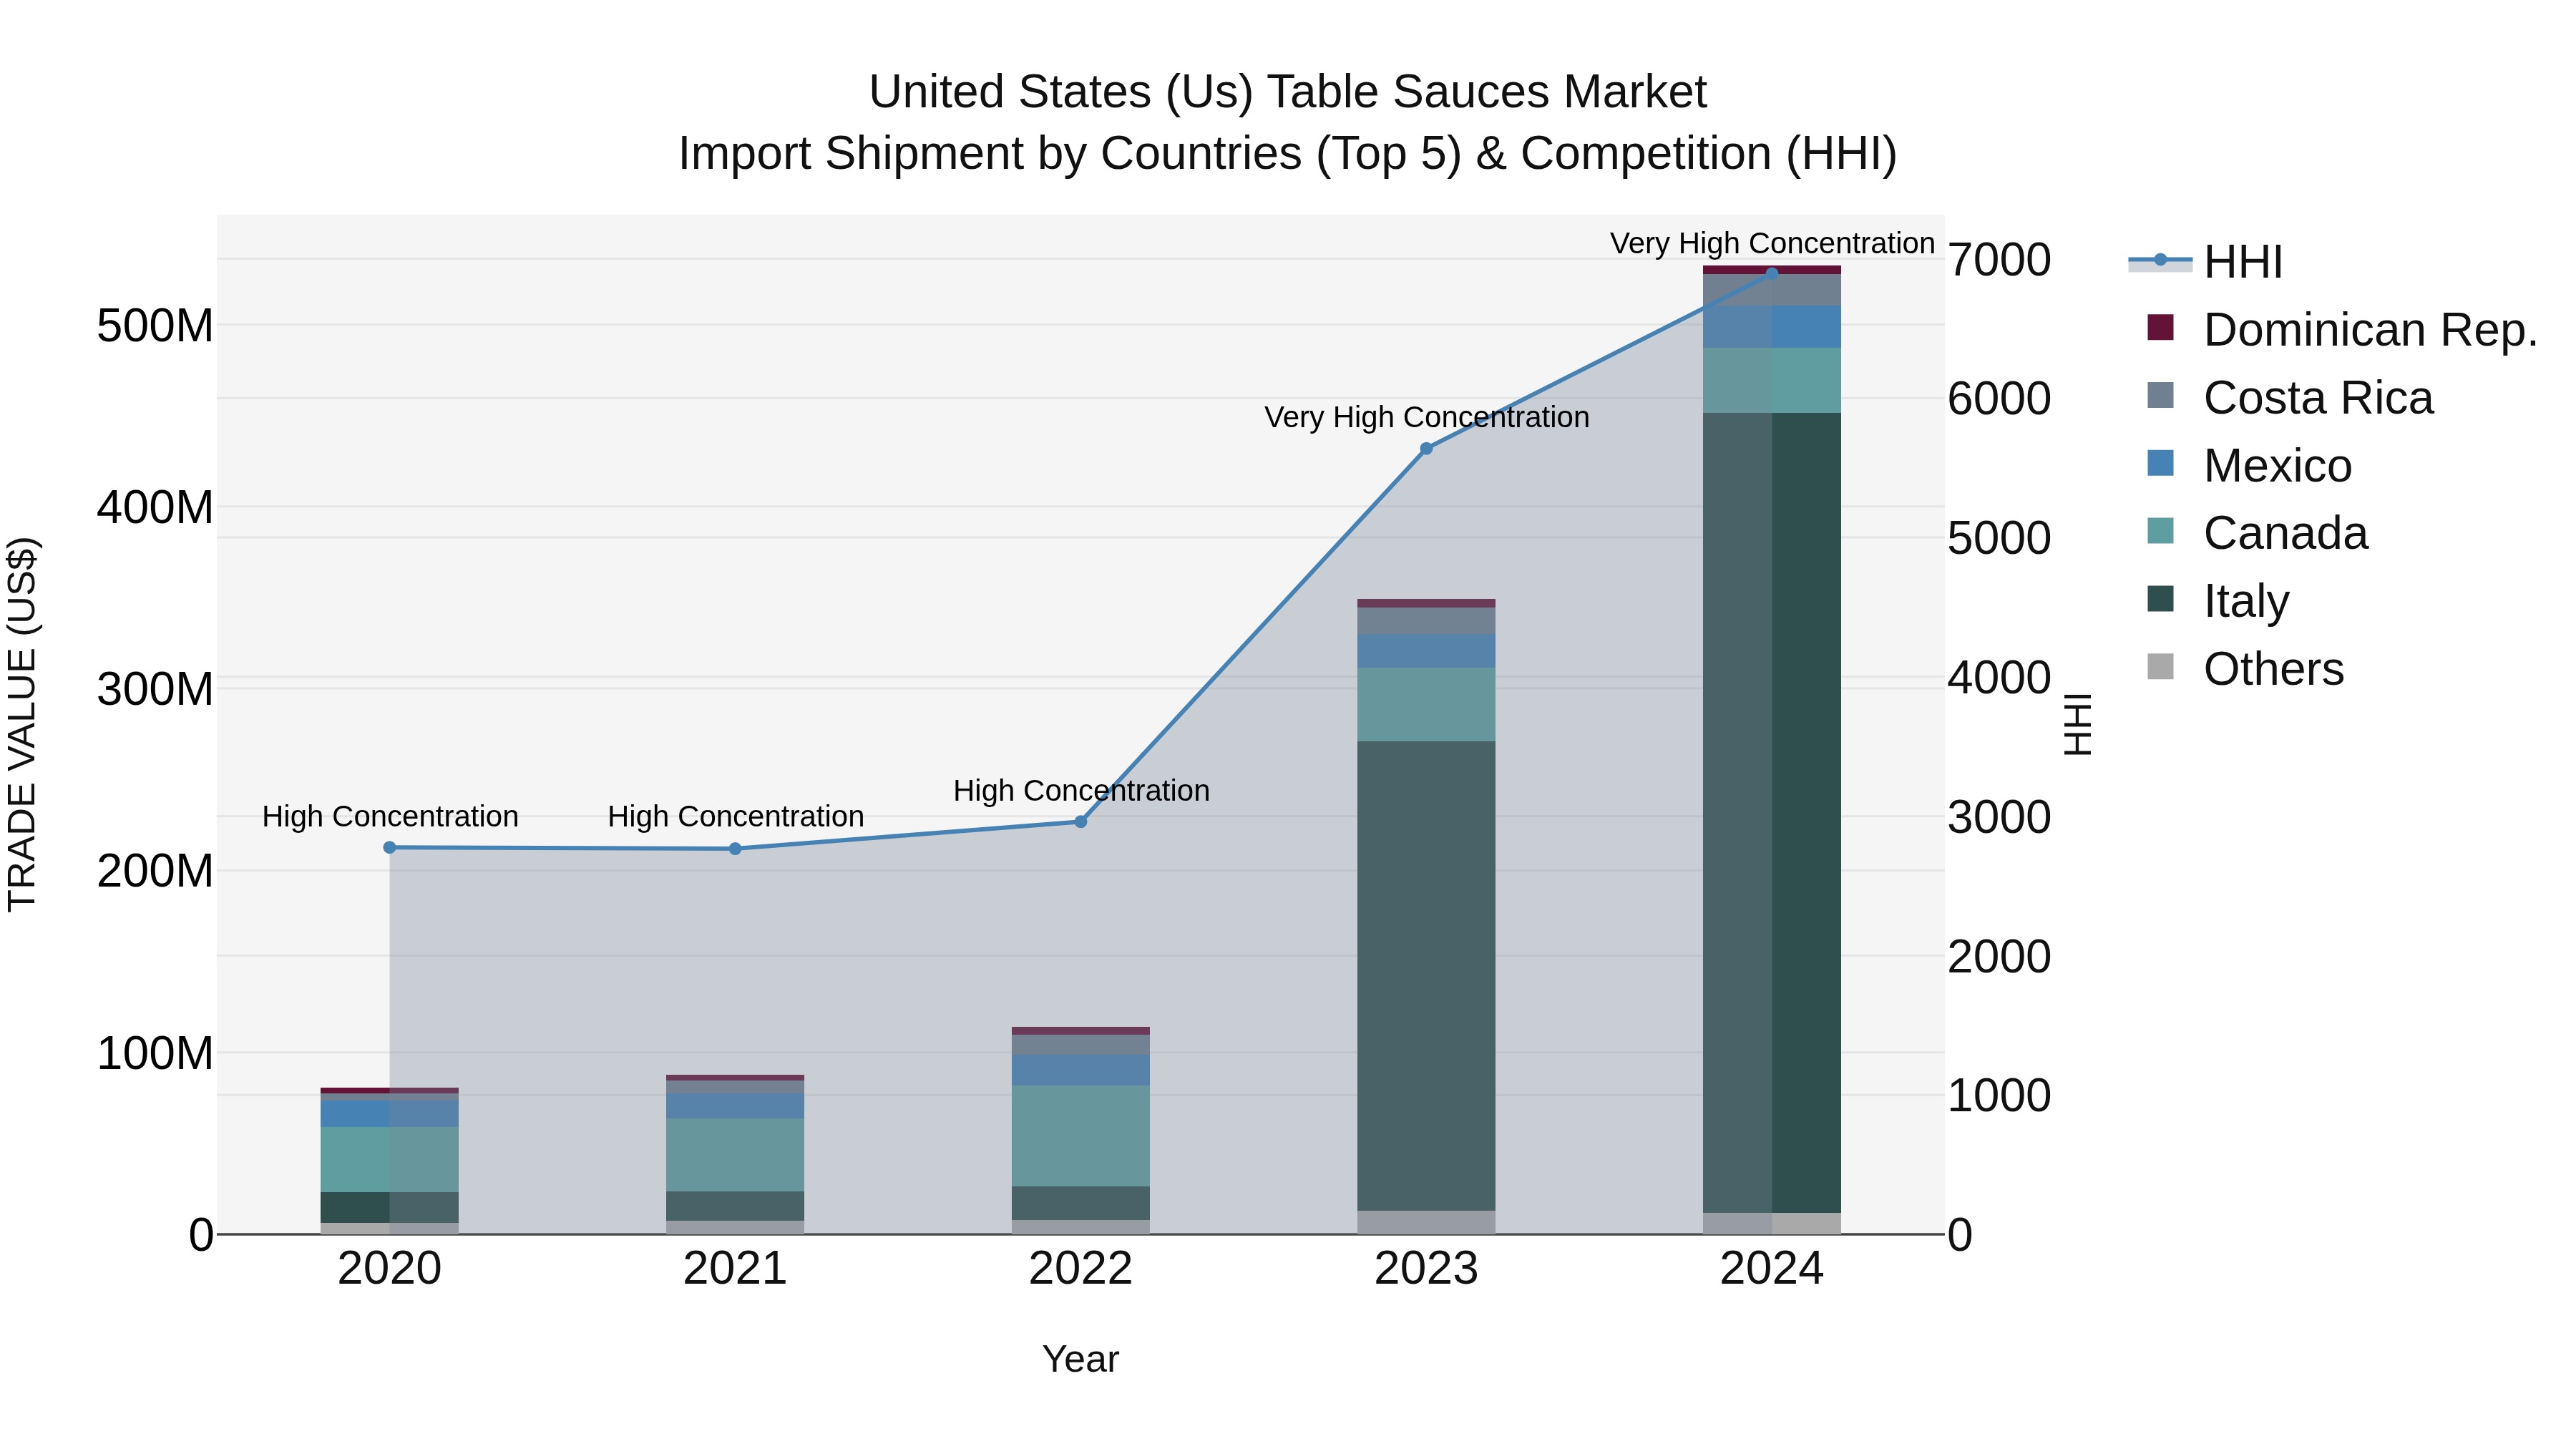
United States (US) Table Sauces Market Top 5 Importing Countries and Market Competition (HHI) Analysis
The United States saw a significant increase in table sauces import shipments in 2024, with top exporters including Italy, Canada, Mexico, Costa Rica, and the Dominican Republic. The high Herfindahl-Hirschman Index (HHI) indicates a concentrated market. The impressive compound annual growth rate (CAGR) of 60.28% from 2020 to 2024 highlights the growing demand for table sauces in the US market. Additionally, the growth rate of 52.49% from 2023 to 2024 suggests a continued upward trajectory in import shipments, making it a promising industry for both domestic and international players.
United States (US) Table Sauces Market Synopsis
The United States Table Sauces Market is a mature and highly competitive industry characterized by a wide variety of products such as ketchup, mustard, mayonnaise, BBQ sauce, and hot sauce. Consumer demand for convenience, flavor experimentation, and ethnic cuisines drives market growth. Major players like Kraft Heinz, McCormick & Company, and Unilever dominate the market with strong brand presence and extensive distribution networks. Health and wellness trends have led to increased demand for natural and organic table sauces, prompting manufacturers to offer cleaner ingredient labels. E-commerce channels, changing consumer preferences, and the rise of private label brands are shaping the market landscape. Continuous product innovation, strategic partnerships, and marketing campaigns are key strategies employed by companies to maintain market share and drive growth in this competitive segment.
United States (US) Table Sauces Market Trends
The US Table Sauces Market is experiencing a shift towards healthier and more natural products, with consumers increasingly seeking options with clean labels, organic ingredients, and reduced sugar and salt content. Plant-based alternatives and ethnic flavors are also gaining popularity, catering to the growing demand for diverse and unique taste experiences. Opportunities lie in the premiumization of table sauces, as consumers are willing to pay more for high-quality, gourmet products. Additionally, the rise of online shopping and meal kit delivery services presents a chance for table sauce brands to reach a wider audience and diversify their distribution channels. Innovation in packaging, such as sustainable and convenient formats, can also differentiate brands in a competitive market landscape.
United States (US) Table Sauces Market Challenges
In the US Table Sauces Market, one significant challenge is the increasing consumer demand for healthier and more natural products. This has led to a shift in preferences towards sauces with clean labels, fewer artificial ingredients, and lower sugar and sodium content. Manufacturers are facing pressure to reformulate their products to meet these changing consumer expectations while still maintaining the taste and quality that consumers desire. Additionally, competition in the market is intense, with numerous brands vying for shelf space and consumer attention. Differentiating products and standing out in a crowded market requires innovative marketing strategies and product development. Furthermore, the impact of external factors such as fluctuating raw material prices, supply chain disruptions, and regulatory changes adds complexity to the operating environment for players in the US Table Sauces Market.
United States (US) Table Sauces Market Investment Opportunities
The United States Table Sauces Market is primarily driven by changing consumer preferences towards convenience and ready-to-eat meals, leading to a higher demand for flavor-enhancing condiments such as ketchup, mustard, mayonnaise, and barbecue sauce. Rising awareness about international cuisines and flavors, coupled with a growing trend of home cooking and meal preparation, is also fueling the market growth. Additionally, the increasing popularity of condiments as a versatile ingredient for enhancing the taste of a wide variety of dishes is contributing to the expansion of the market. Furthermore, the focus on product innovation, such as the introduction of organic and clean label sauces, as well as the availability of a wide range of flavors and packaging options, are further driving the growth of the US Table Sauces Market.
United States (US) Table Sauces Market Government Polices
The US Table Sauces Market is subject to various government policies and regulations, particularly in terms of food safety and labeling requirements. The Food and Drug Administration (FDA) oversees the safety and labeling of table sauces to ensure that they meet certain standards for ingredients, nutrition, and allergen information. Additionally, the US Department of Agriculture (USDA) may also play a role in regulating certain aspects of table sauces, especially those containing meat or poultry products. Import and export regulations, including tariffs and trade agreements, can also impact the US Table Sauces Market. Overall, companies operating in this market must comply with a range of government policies to ensure the quality, safety, and transparency of their products for consumers.
United States (US) Table Sauces Market Future Outlook
The United States table sauces market is expected to witness steady growth in the coming years, driven by factors such as changing consumer preferences towards diverse and ethnic flavors, the increasing popularity of home cooking and dining, and the growing trend of health-conscious eating habits. Manufacturers are likely to focus on product innovation, clean label ingredients, and sustainable packaging to meet the evolving consumer demands. The market is also anticipated to see a rise in online sales channels and direct-to-consumer models, offering convenience and accessibility to a wider range of consumers. Overall, the US table sauces market is poised for expansion with a focus on flavor variety, health attributes, and convenience driving growth in the foreseeable future.
Key Highlights of the Report:
- United States (US) Table Sauces Market Outlook
- Market Size of United States (US) Table Sauces Market, 2024
- Forecast of United States (US) Table Sauces Market, 2031
- Historical Data and Forecast of United States (US) Table Sauces Revenues & Volume for the Period 2021- 2031
- United States (US) Table Sauces Market Trend Evolution
- United States (US) Table Sauces Market Drivers and Challenges
- United States (US) Table Sauces Price Trends
- United States (US) Table Sauces Porter's Five Forces
- United States (US) Table Sauces Industry Life Cycle
- Historical Data and Forecast of United States (US) Table Sauces Market Revenues & Volume By Type for the Period 2021- 2031
- Historical Data and Forecast of United States (US) Table Sauces Market Revenues & Volume By Table Sauces for the Period 2021- 2031
- Historical Data and Forecast of United States (US) Table Sauces Market Revenues & Volume By Dips for the Period 2021- 2031
- Historical Data and Forecast of United States (US) Table Sauces Market Revenues & Volume By Cooking Sauces for the Period 2021- 2031
- Historical Data and Forecast of United States (US) Table Sauces Market Revenues & Volume By Paste and Purees for the Period 2021- 2031
- Historical Data and Forecast of United States (US) Table Sauces Market Revenues & Volume By Pickled Products for the Period 2021- 2031
- Historical Data and Forecast of United States (US) Table Sauces Market Revenues & Volume By Others for the Period 2021- 2031
- Historical Data and Forecast of United States (US) Table Sauces Market Revenues & Volume By Application for the Period 2021- 2031
- Historical Data and Forecast of United States (US) Table Sauces Market Revenues & Volume By Specialist Retailers for the Period 2021- 2031
- Historical Data and Forecast of United States (US) Table Sauces Market Revenues & Volume By Supermarkets/Hypermarkets for the Period 2021- 2031
- Historical Data and Forecast of United States (US) Table Sauces Market Revenues & Volume By Convenience Stores for the Period 2021- 2031
- Historical Data and Forecast of United States (US) Table Sauces Market Revenues & Volume By Others for the Period 2021- 2031
- United States (US) Table Sauces Import Export Trade Statistics
- Market Opportunity Assessment By Type
- Market Opportunity Assessment By Application
- United States (US) Table Sauces Top Companies Market Share
- United States (US) Table Sauces Competitive Benchmarking By Technical and Operational Parameters
- United States (US) Table Sauces Company Profiles
- United States (US) Table Sauces Key Strategic Recommendations
Frequently Asked Questions About the Market Study (FAQs):
6Wresearch actively monitors the United States (US) Table Sauces Market and publishes its comprehensive annual report, highlighting emerging trends, growth drivers, revenue analysis, and forecast outlook. Our insights help businesses to make data-backed strategic decisions with ongoing market dynamics. Our analysts track relevent industries related to the United States (US) Table Sauces Market, allowing our clients with actionable intelligence and reliable forecasts tailored to emerging regional needs.
Yes, we provide customisation as per your requirements. To learn more, feel free to contact us on sales@6wresearch.com
1 Executive Summary |
2 Introduction |
2.1 Key Highlights of the Report |
2.2 Report Description |
2.3 Market Scope & Segmentation |
2.4 Research Methodology |
2.5 Assumptions |
3 United States (US) Table Sauces Market Overview |
3.1 United States (US) Country Macro Economic Indicators |
3.2 United States (US) Table Sauces Market Revenues & Volume, 2021 & 2031F |
3.3 United States (US) Table Sauces Market - Industry Life Cycle |
3.4 United States (US) Table Sauces Market - Porter's Five Forces |
3.5 United States (US) Table Sauces Market Revenues & Volume Share, By Type, 2021 & 2031F |
3.6 United States (US) Table Sauces Market Revenues & Volume Share, By Application, 2021 & 2031F |
4 United States (US) Table Sauces Market Dynamics |
4.1 Impact Analysis |
4.2 Market Drivers |
4.2.1 Increasing consumer demand for convenient meal solutions |
4.2.2 Growing trend of home cooking and experimentation with different cuisines |
4.2.3 Rising popularity of ethnic foods and flavors in the US market |
4.3 Market Restraints |
4.3.1 Health concerns related to high sugar, salt, and preservative content in table sauces |
4.3.2 Competition from private labels and store brands offering lower-priced alternatives |
4.3.3 Fluctuating costs of key ingredients such as tomatoes, spices, and packaging materials |
5 United States (US) Table Sauces Market Trends |
6 United States (US) Table Sauces Market, By Types |
6.1 United States (US) Table Sauces Market, By Type |
6.1.1 Overview and Analysis |
6.1.2 United States (US) Table Sauces Market Revenues & Volume, By Type, 2021- 2031F |
6.1.3 United States (US) Table Sauces Market Revenues & Volume, By Table Sauces, 2021- 2031F |
6.1.4 United States (US) Table Sauces Market Revenues & Volume, By Dips, 2021- 2031F |
6.1.5 United States (US) Table Sauces Market Revenues & Volume, By Cooking Sauces, 2021- 2031F |
6.1.6 United States (US) Table Sauces Market Revenues & Volume, By Paste and Purees, 2021- 2031F |
6.1.7 United States (US) Table Sauces Market Revenues & Volume, By Pickled Products, 2021- 2031F |
6.1.8 United States (US) Table Sauces Market Revenues & Volume, By Others, 2021- 2031F |
6.2 United States (US) Table Sauces Market, By Application |
6.2.1 Overview and Analysis |
6.2.2 United States (US) Table Sauces Market Revenues & Volume, By Specialist Retailers, 2021- 2031F |
6.2.3 United States (US) Table Sauces Market Revenues & Volume, By Supermarkets/Hypermarkets, 2021- 2031F |
6.2.4 United States (US) Table Sauces Market Revenues & Volume, By Convenience Stores, 2021- 2031F |
6.2.5 United States (US) Table Sauces Market Revenues & Volume, By Others, 2021- 2031F |
7 United States (US) Table Sauces Market Import-Export Trade Statistics |
7.1 United States (US) Table Sauces Market Export to Major Countries |
7.2 United States (US) Table Sauces Market Imports from Major Countries |
8 United States (US) Table Sauces Market Key Performance Indicators |
8.1 Consumer engagement metrics such as social media interactions, recipe downloads, and user-generated content related to table sauces |
8.2 Rate of product innovation and launch of new flavors or variants in the table sauces segment |
8.3 Customer loyalty and repeat purchase rates for leading table sauce brands |
9 United States (US) Table Sauces Market - Opportunity Assessment |
9.1 United States (US) Table Sauces Market Opportunity Assessment, By Type, 2021 & 2031F |
9.2 United States (US) Table Sauces Market Opportunity Assessment, By Application, 2021 & 2031F |
10 United States (US) Table Sauces Market - Competitive Landscape |
10.1 United States (US) Table Sauces Market Revenue Share, By Companies, 2024 |
10.2 United States (US) Table Sauces Market Competitive Benchmarking, By Operating and Technical Parameters |
11 Company Profiles |
12 Recommendations |
13 Disclaimer |
Global Go To Market Strategy - 2030
Export potential enables firms to identify high-growth global markets with greater confidence by combining advanced trade intelligence with a structured quantitative methodology. The framework analyzes emerging demand trends and country-level import patterns while integrating macroeconomic and trade datasets such as GDP and population forecasts, bilateral import–export flows, tariff structures, elasticity differentials between developed and developing economies, geographic distance, and import demand projections. Using weighted trade values from 2020–2024 as the base period to project country-to-country export potential for 2030, these inputs are operationalized through calculated drivers such as gravity model parameters, tariff impact factors, and projected GDP per-capita growth. Through an analysis of hidden potentials, demand hotspots, and market conditions that are most favorable to success, this method enables firms to focus on target countries, maximize returns, and global expansion with data, backed by accuracy.
By factoring in the projected importer demand gap that is currently unmet and could be potential opportunity, it identifies the potential for the Exporter (Country) among 190 countries, against the general trade analysis, which identifies the biggest importer or exporter.
To discover high-growth global markets and optimize your business strategy:
Click Here
Pricing
- Single User License$ 1,995
- Department License$ 2,400
- Site License$ 3,120
- Global License$ 3,795

Leadership Perspectives from Industry Events
Search
Thought Leadership and Analyst Meet


Our Clients
6WResearch In News
- India Export Attractiveness Tracker 2026
- India Air Conditioner Market Set for Strong Rebound in 2026 After Weather-Led Correction and GST-Driven Recovery: 6Wresearch
- ADAS in India: How Automatic Emergency Braking, Blind Spot Detection & Driver Monitoring are Transforming Road Safety
- Doha a strategic location for EV manufacturing hub: IPA Qatar
- Demand for luxury TVs surging in the GCC, says Samsung
- Empowering Growth: The Thriving Journey of Bangladesh’s Cable Industry
Latest Reports
- Nicaragua RPG Gaming Market (2026-2032)
- New Zealand RPG Gaming Market (2026-2032)
- Netherlands RPG Gaming Market (2026-2032)
- Nauru RPG Gaming Market (2026-2032)
- Namibia RPG Gaming Market (2026-2032)
- Mozambique RPG Gaming Market (2026-2032)
- Montenegro RPG Gaming Market (2026-2032)
- Mongolia RPG Gaming Market (2026-2032)
- Monaco RPG Gaming Market (2026-2032)
- Micronesia RPG Gaming Market (2026-2032)
Industry Events and Analyst Meet

EV India Expo 2026

HIMTEX 2026

India Refining Summit 2026

India EV Show 2026

EV tech India Expo 2026
Whitepaper
- Middle East & Africa Commercial Security Market Click here to view more.
- Middle East & Africa Fire Safety Systems & Equipment Market Click here to view more.
- GCC Drone Market Click here to view more.
- Middle East Lighting Fixture Market Click here to view more.
- GCC Physical & Perimeter Security Market Click here to view more.