United States (US) Tables Market (2026-2032) | Trends, Analysis, Revenue, Value, Size, Forecast, Outlook, Industry, Companies, Share & Growth
Market Forecast By Types (Fabric, Leather, Metal, Wooden, Others), By Applications (Family, Office, Others) And Competitive Landscape
| Product Code: ETC034641 | Publication Date: Oct 2020 | Updated Date: Jun 2026 | Product Type: Report | |
| Publisher: 6Wresearch | Author: Sachin Kumar Rai | No. of Pages: 70 | No. of Figures: 35 | No. of Tables: 5 |
United States (US) Tables Market Summary
The united states (us) tables market was estimated at USD 198 Million in 2025 and is projected to reach USD 233 Million by 2032, growing at a CAGR of 2.7% from 2026 to 2032.
United States (US) Tables Market Year-wise Growth Rate and Key Drivers
This graph highlights how the United States (US) Tables Market has steadily grown over the past five years, supported by major growth factors.
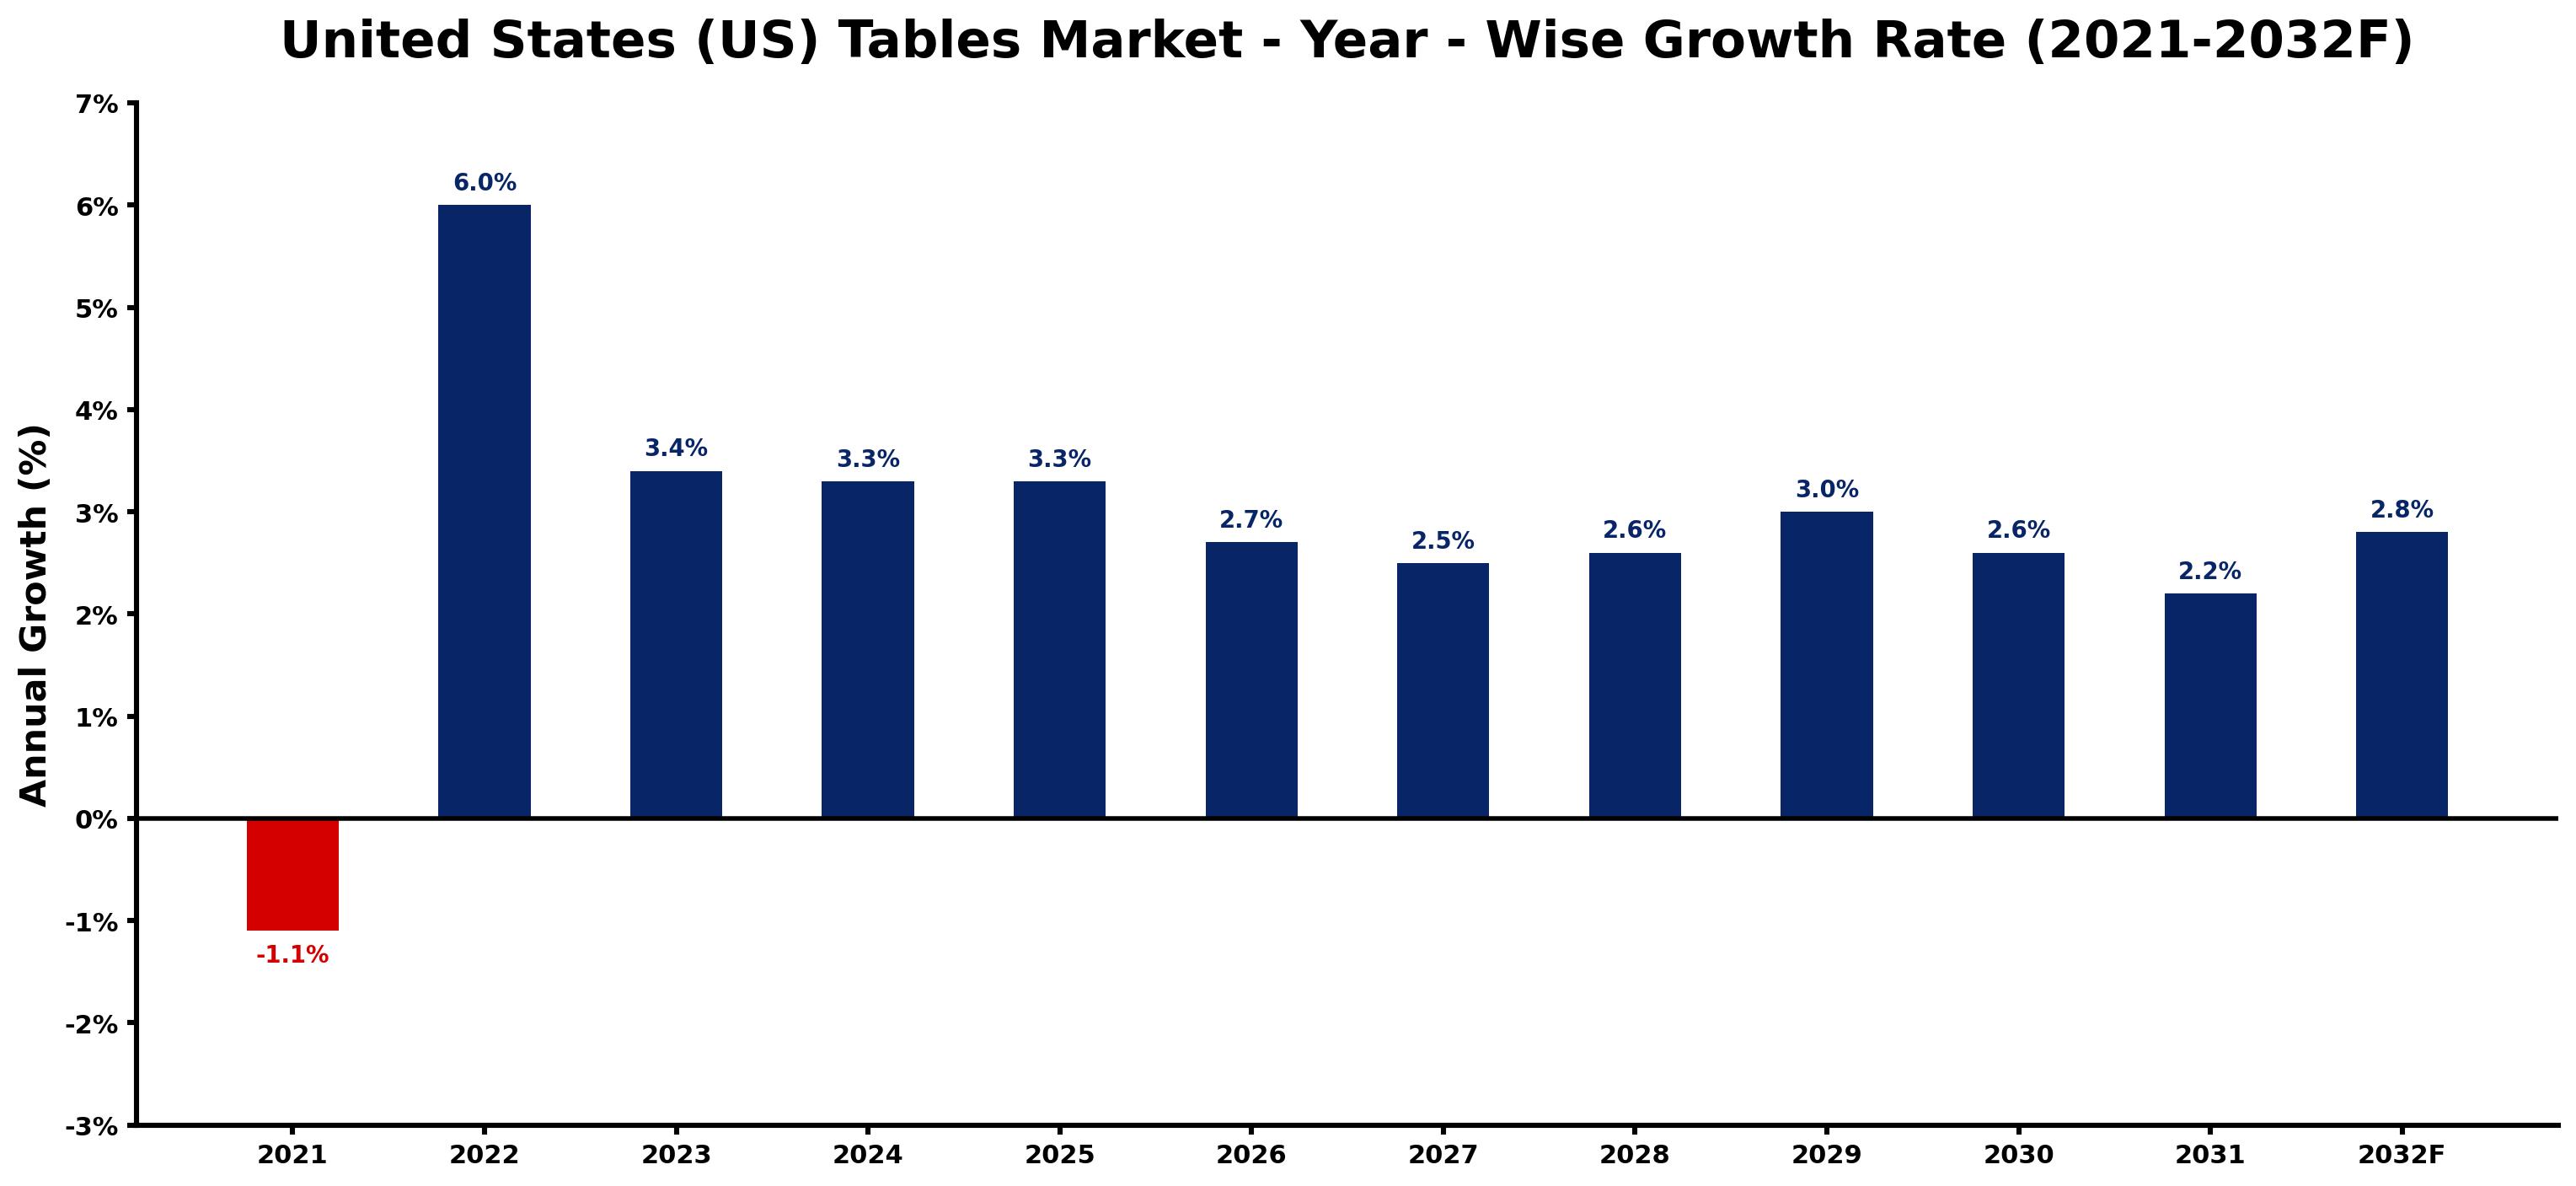
The table below presents the year wise growth rates along with the key drivers influencing the market
| Year | Growth Rate | Major Drivers |
| 2021 | -1.1% | Increased preference for multifunctional furniture diminished demand for traditional table styles among consumers. |
| 2022 | 6.0% | Sustainability trends prompted manufacturers to explore eco-friendly materials for table production. |
| 2023 | 3.4% | E-commerce platforms expanded their reach, enhancing visibility for diverse table offerings. |
| 2024 | 3.3% | Interior design trends favor multifunctional tables, appealing to urban dwellers' space needs. |
| 2025 | 3.3% | Technological integration in home furnishings creates smart table innovations for consumers. |
| 2026 | 2.7% | Millennial consumer preferences shape designs, emphasizing aesthetic alongside practical functionality. |
| 2027 | 2.5% | Increase in remote work fuels demand for stylish, ergonomic home office tables. |
| 2028 | 2.6% | Collaboration spaces in offices revive demand for versatile, communal table designs. |
| 2029 | 3.0% | Emerging artisans and local craftsmanship gain traction, influencing unique table styles. |
| 2030 | 2.6% | Health-conscious consumers seek antimicrobial surfaces, prompting product innovation in tables. |
| 2031 | 2.2% | Home improvement projects surge, leading to increased table purchases for interior upgrades. |
| 2032 | 2.8% | Global supply chain recovery stabilizes, improving availability of high-quality materials for tables. |
Note - Market size estimations and growth projections presented in this report are based on 6Wresearch's advanced forecasting approach, validated with industry datasets as of June 2026.
United States (US) Tables Market Synopsis
The United States (US) Tables Market is projected to reach 2.7% and witness significant growth during the forecast period (2026-2032). This dynamic industry encompasses a variety of table types, including dining tables, coffee tables, side tables, console tables, and outdoor tables, catering to the diverse preferences of consumers. As lifestyles evolve, the demand for functional and aesthetically pleasing furniture options continues to rise, driven by trends in home renovation and interior design.
United States (US) Tables Market Growth Drivers
Several factors are propelling the growth of the United States (US) Tables Market. The increasing emphasis on multifunctional and space-efficient furniture reflects the needs of urban dwellers who often contend with limited living spaces. Moreover, the trend towards home improvement has surged, with many consumers investing in stylish and functional tables that enhance their living environments.
- Urbanization is a significant driver, as more individuals seek solutions that cater to smaller homes and apartments.
- The rise in disposable incomes allows consumers to invest in high-quality, design-oriented tables.
- Growing interest in sustainable materials leads to demand for eco-friendly table options, appealing to environmentally conscious buyers.
- Technological advancements in design and manufacturing processes facilitate the creation of innovative table features.
- E-commerce platforms are expanding access, allowing consumers to explore a wider array of products conveniently.
United States (US) Tables Market Trends and Opportunities
The United States (US) Tables Market is currently witnessing notable trends that present opportunities for growth. The consumer shift towards multifunctional furniture is evident, particularly in urban areas where space is at a premium. Tables that can serve multiple purposes—such as dining, working, and storage—are increasingly sought after.
- Customization is gaining traction, as consumers desire furniture that aligns with their unique tastes and home aesthetics.
- Interest in sustainable practices is fostering demand for tables made from reclaimed or responsibly sourced materials.
- Online shopping trends continue to rise, creating opportunities for direct-to-consumer sales models.
- The influence of social media and design platforms drives consumer aspirations for stylish and trendy table designs.
- Increased attention to quality craftsmanship and durability is prompting manufacturers to prioritize high-quality materials.
United States (US) Tables Market Challenges and Restraints
While the United States (US) Tables Market displays robust potential, it faces several challenges. Competition from imported tables is intensifying, particularly due to lower production costs in other countries, impacting the pricing strategies of domestic manufacturers.
- Fluctuations in raw material prices can significantly affect production costs and retail pricing, challenging profit margins.
- Consumer preferences are shifting faster than manufacturers can adapt, necessitating continuous innovation in designs and functionalities.
- Regulatory compliance regarding safety standards and environmental regulations may increase operational costs for manufacturers.
- The rising popularity of minimalist design may limit demand for more ornate or traditional table styles.
- Market saturation in certain segments can make it difficult for new entrants to establish a foothold.
United States (US) Tables Market Investment Opportunities
The evolving landscape of the United States (US) Tables Market provides a plethora of investment opportunities across diverse segments. As home renovation trends continue to rise, the demand for stylish and functional tables is expected to grow, offering lucrative prospects for manufacturers.
- Investment in innovative design and manufacturing techniques that prioritize sustainability can attract environmentally conscious consumers.
- Developing customizable table options can cater to the increasing consumer desire for personalization in home décor.
- Companies that effectively utilize e-commerce channels stand to benefit from the growing trend of online furniture shopping.
- The rise of outdoor living spaces presents opportunities for producing weather-resistant and durable tables designed for outdoor use.
- Investments in smart furniture solutions that integrate technology with traditional table functions may capture a niche market segment.
United States (US) Tables Market Government Investment and Initiatives
Government policies and initiatives significantly influence the United States (US) Tables Market. The focus on consumer safety and environmental sustainability is evident in various regulations that manufacturers must adhere to. Safety standards ensure that tables are produced with quality materials that meet established guidelines, thus protecting consumers.
Additionally, initiatives promoting sustainable manufacturing practices are gaining traction, incentivizing the use of eco-friendly materials and processes. Government support for local industries often translates into public funding for research and development in innovative production techniques. Furthermore, trade policies impact the cost competitiveness of imported goods, which can shape market dynamics by influencing local production strategies.
United States (US) Tables Market Latest Developments (May 2025 - June 2026)
Between May 2025 and June 2026, the United States (US) Tables Market has seen several significant developments. Manufacturers are increasingly focusing on integrating sustainable practices into their production processes, responding to rising consumer awareness of environmental issues. The trend of multifunctional furniture has gained momentum, with companies expanding their product lines to include versatile table options that cater to diverse needs.
Additionally, e-commerce platforms are enhancing their offerings, providing consumers with more access to a wider range of table styles and functionalities. Innovations in design, driven by advances in technology, are leading to the emergence of smart furniture solutions that blend aesthetics with practicality. Overall, the industry is adapting to meet the evolving preferences of consumers, with a clear emphasis on sustainability and functionality.
United States (US) Tables Market - Key Attractiveness of the Report
- 10 Years of Market Numbers
- Historical Data Starting from 2022 to 2025
- Base Year: 2025
- Forecast Data until 2032
- Key Performance Indicators Impacting the Market
- Major Upcoming Developments and Projects
Key Highlights of the Report:
- United States (US) Tables Market Outlook
- Market Size of United States (US) Tables Market, 2025
- Forecast of United States (US) Tables Market, 2032F
- Historical Data and Forecast of United States (US) Tables Revenues & Volume for the Period 2022-2032F
- United States (US) Tables Market Trend Evolution
- United States (US) Tables Market Drivers and Challenges
- United States (US) Tables Price Trends
- United States (US) Tables Porter's Five Forces
- United States (US) Tables Industry Life Cycle
- Historical Data and Forecast of United States (US) Tables Market Revenues & Volume By Types for the Period 2022-2032F
- Historical Data and Forecast of United States (US) Tables Market Revenues & Volume By Fabric for the Period 2022-2032F
- Historical Data and Forecast of United States (US) Tables Market Revenues & Volume By Leather for the Period 2022-2032F
- Historical Data and Forecast of United States (US) Tables Market Revenues & Volume By Metal for the Period 2022-2032F
- Historical Data and Forecast of United States (US) Tables Market Revenues & Volume By Wooden for the Period 2022-2032F
- Historical Data and Forecast of United States (US) Tables Market Revenues & Volume By Others for the Period 2022-2032F
- Historical Data and Forecast of United States (US) Tables Market Revenues & Volume By Applications for the Period 2022-2032F
- Historical Data and Forecast of United States (US) Tables Market Revenues & Volume By Family for the Period 2022-2032F
- Historical Data and Forecast of United States (US) Tables Market Revenues & Volume By Office for the Period 2022-2032F
- Historical Data and Forecast of United States (US) Tables Market Revenues & Volume By Others for the Period 2022-2032F
- United States (US) Tables Import Export Trade Statistics
- Market Opportunity Assessment By Types
- Market Opportunity Assessment By Applications
- United States (US) Tables Top Companies Market Share
- United States (US) Tables Competitive Benchmarking By Technical and Operational Parameters
- United States (US) Tables Company Profiles
- United States (US) Tables Key Strategic Recommendations
Frequently Asked Questions About the Market Study (FAQs):
The growth is driven by factors such as urbanization, increasing disposable income, demand for multifunctional furniture, and the rise of e-commerce.
Challenges include competition from imports, fluctuating raw material prices, and the need to keep pace with changing consumer preferences.
Sustainability is becoming a key consideration, with demand for eco-friendly materials and sustainable production practices increasing among consumers.
Investors can capitalize on trends such as customization, smart furniture, and the burgeoning outdoor living market.
6Wresearch actively monitors the United States (US) Tables Market and publishes its comprehensive annual report, highlighting emerging trends, growth drivers, revenue analysis, and forecast outlook. Our insights help businesses to make data-backed strategic decisions with ongoing market dynamics. Our analysts track relevent industries related to the United States (US) Tables Market, allowing our clients with actionable intelligence and reliable forecasts tailored to emerging regional needs.
Yes, we provide customisation as per your requirements. To learn more, feel free to contact us on sales@6wresearch.com
1 Executive Summary |
2 Introduction |
2.1 Key Highlights of the Report |
2.2 Report Description |
2.3 Market Scope & Segmentation |
2.4 Research Methodology |
2.5 Assumptions |
3 United States (US) Tables Market Overview |
3.1 United States (US) Country Macro Economic Indicators |
3.2 United States (US) Tables Market Revenues & Volume, 2022 & 2032F |
3.3 United States (US) Tables Market - Industry Life Cycle |
3.4 United States (US) Tables Market - Porter's Five Forces |
3.5 United States (US) Tables Market Revenues & Volume Share, By Types, 2022 & 2032F |
3.6 United States (US) Tables Market Revenues & Volume Share, By Applications, 2022 & 2032F |
4 United States (US) Tables Market Dynamics |
4.1 Impact Analysis |
4.2 Market Drivers |
4.2.1 Growing demand for multifunctional and space-saving furniture in urban areas. |
4.2.2 Increasing trend of remote work and online education, leading to higher demand for home office and study tables. |
4.2.3 Rising disposable income and consumer spending on home furnishing products. |
4.3 Market Restraints |
4.3.1 Volatility in raw material prices affecting the production costs of tables. |
4.3.2 Intense competition among furniture manufacturers and retailers. |
4.3.3 Economic downturns impacting consumer purchasing power and willingness to invest in new tables. |
5 United States (US) Tables Market Trends |
6 United States (US) Tables Market, By Types |
6.1 United States (US) Tables Market, By Types |
6.1.1 Overview and Analysis |
6.1.2 United States (US) Tables Market Revenues & Volume, By Types, 2022-2032F |
6.1.3 United States (US) Tables Market Revenues & Volume, By Fabric, 2022-2032F |
6.1.4 United States (US) Tables Market Revenues & Volume, By Leather, 2022-2032F |
6.1.5 United States (US) Tables Market Revenues & Volume, By Metal, 2022-2032F |
6.1.6 United States (US) Tables Market Revenues & Volume, By Wooden, 2022-2032F |
6.1.7 United States (US) Tables Market Revenues & Volume, By Others, 2022-2032F |
6.2 United States (US) Tables Market, By Applications |
6.2.1 Overview and Analysis |
6.2.2 United States (US) Tables Market Revenues & Volume, By Family, 2022-2032F |
6.2.3 United States (US) Tables Market Revenues & Volume, By Office, 2022-2032F |
6.2.4 United States (US) Tables Market Revenues & Volume, By Others, 2022-2032F |
7 United States (US) Tables Market Import-Export Trade Statistics |
7.1 United States (US) Tables Market Export to Major Countries |
7.2 United States (US) Tables Market Imports from Major Countries |
8 United States (US) Tables Market Key Performance Indicators |
8.1 Average selling price (ASP) of tables. |
8.2 Number of new product launches in the tables segment. |
8.3 Customer satisfaction and retention rates for table manufacturers. |
8.4 Adoption rate of eco-friendly materials in table production. |
8.5 Online engagement metrics such as website traffic and social media interactions for table brands. |
9 United States (US) Tables Market - Opportunity Assessment |
9.1 United States (US) Tables Market Opportunity Assessment, By Types, 2022 & 2032F |
9.2 United States (US) Tables Market Opportunity Assessment, By Applications, 2022 & 2032F |
10 United States (US) Tables Market - Competitive Landscape |
10.1 United States (US) Tables Market Revenue Share, By Companies, 2025 |
10.2 United States (US) Tables Market Competitive Benchmarking, By Operating and Technical Parameters |
11 Company Profiles |
12 Recommendations |
13 Disclaimer |
Global Go To Market Strategy - 2030
Export potential enables firms to identify high-growth global markets with greater confidence by combining advanced trade intelligence with a structured quantitative methodology. The framework analyzes emerging demand trends and country-level import patterns while integrating macroeconomic and trade datasets such as GDP and population forecasts, bilateral import–export flows, tariff structures, elasticity differentials between developed and developing economies, geographic distance, and import demand projections. Using weighted trade values from 2020–2024 as the base period to project country-to-country export potential for 2030, these inputs are operationalized through calculated drivers such as gravity model parameters, tariff impact factors, and projected GDP per-capita growth. Through an analysis of hidden potentials, demand hotspots, and market conditions that are most favorable to success, this method enables firms to focus on target countries, maximize returns, and global expansion with data, backed by accuracy.
By factoring in the projected importer demand gap that is currently unmet and could be potential opportunity, it identifies the potential for the Exporter (Country) among 190 countries, against the general trade analysis, which identifies the biggest importer or exporter.
To discover high-growth global markets and optimize your business strategy:
Click Here
Pricing
- Single User License$ 1,995
- Department License$ 2,400
- Site License$ 3,120
- Global License$ 3,795

Leadership Perspectives from Industry Events
Search
Thought Leadership and Analyst Meet


Our Clients
6WResearch In News
- India Air Conditioner Market Set for Strong Rebound in 2026 After Weather-Led Correction and GST-Driven Recovery: 6Wresearch
- ADAS in India: How Automatic Emergency Braking, Blind Spot Detection & Driver Monitoring are Transforming Road Safety
- Doha a strategic location for EV manufacturing hub: IPA Qatar
- Demand for luxury TVs surging in the GCC, says Samsung
- Empowering Growth: The Thriving Journey of Bangladesh’s Cable Industry
- Demand for luxury TVs surging in the GCC, says Samsung
Latest Reports
- Nicaragua RPG Gaming Market (2026-2032)
- New Zealand RPG Gaming Market (2026-2032)
- Netherlands RPG Gaming Market (2026-2032)
- Nauru RPG Gaming Market (2026-2032)
- Namibia RPG Gaming Market (2026-2032)
- Mozambique RPG Gaming Market (2026-2032)
- Montenegro RPG Gaming Market (2026-2032)
- Mongolia RPG Gaming Market (2026-2032)
- Monaco RPG Gaming Market (2026-2032)
- Micronesia RPG Gaming Market (2026-2032)
Industry Events and Analyst Meet

EV India Expo 2026

HIMTEX 2026

India Refining Summit 2026

India EV Show 2026

EV tech India Expo 2026
Whitepaper
- Middle East & Africa Commercial Security Market Click here to view more.
- Middle East & Africa Fire Safety Systems & Equipment Market Click here to view more.
- GCC Drone Market Click here to view more.
- Middle East Lighting Fixture Market Click here to view more.
- GCC Physical & Perimeter Security Market Click here to view more.