United States (US) Thallium Market (2026-2032) Outlook | Share, Value, Companies, Growth, Size, Revenue, Analysis, Industry, Trends & Forecast
Market Forecast By Type (Granular, Rod, Others), By Application (Optics, Electronics, High-temperature superconductivity, Others) And Competitive Landscape
| Product Code: ETC195613 | Publication Date: May 2022 | Updated Date: Jun 2026 | Product Type: Market Research Report | |
| Publisher: 6Wresearch | Author: Sumit Sagar | No. of Pages: 60 | No. of Figures: 40 | No. of Tables: 7 |
United States (US) Thallium Market Size, Share & Growth Rate
The United States (US) Thallium Market was estimated at USD 109 Million in 2025 and is projected to reach USD 128 Million by 2032, growing at a CAGR of 2.3% from 2026 to 2032. This upward trajectory is largely driven by the increasing demand for thallium in the electronics sector, particularly for semiconductor and optical applications. Additionally, the healthcare industry's reliance on thallium-based compounds for imaging and cancer therapies further supports market growth.
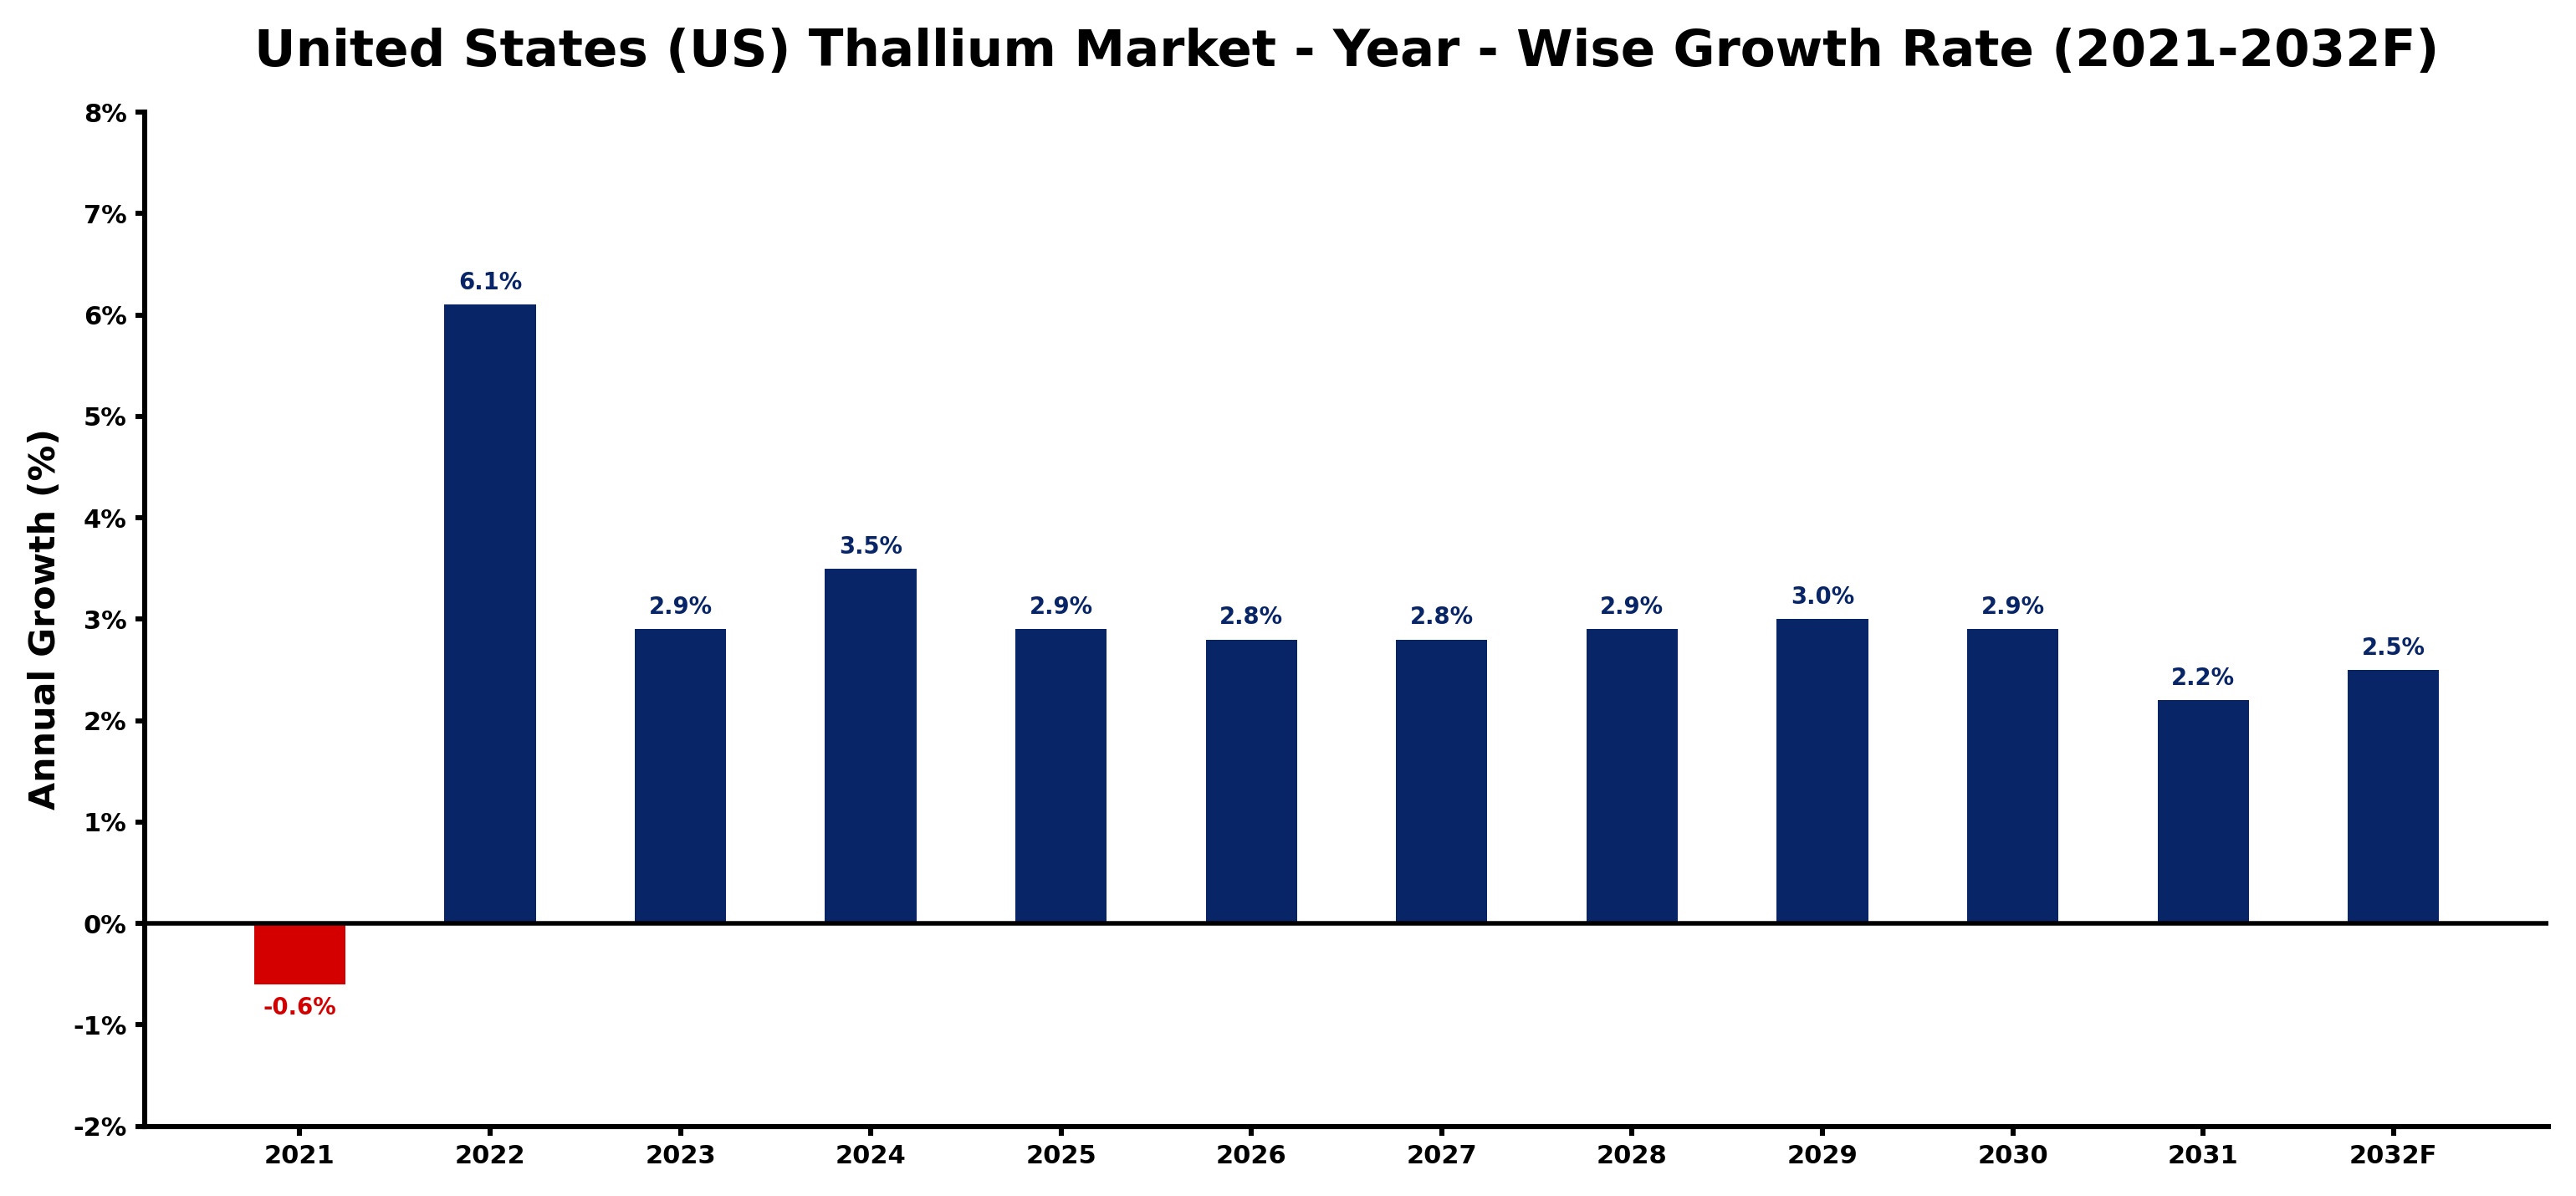
United States (US) Thallium Market Growth Rate Analysis (2021-2032)
The thallium market in the United States has experienced notable fluctuations in recent years, beginning with a decline of 0.6% in 2021, largely attributed to economic instability and reduced industrial demand. However, the situation improved markedly in 2022, as the market rebounded with a robust growth rate of 6.1%, driven by increased investments in technology and infrastructure development. This upward momentum continued, with growth rates of 2.9% in 2023 and projected increases of 3.5% in 2024, fueled by rising consumer demand for electronics and the energy transition towards more sustainable solutions. Although growth is expected to stabilize around 2.2% to 2.9% in the following years, the outlook remains positive as industries adapt and innovate.
United States (US) Thallium Market Year-wise Growth Rate and Key Drivers
This graph highlights how the United States (US) Thallium Market has steadily grown over the past five years, supported by major growth factors.
The table below presents the year‑wise growth rates along with the key drivers influencing the market
| Year | Growth Rate | Major Drivers |
| 2021 | -0.6% | Environmental regulations limited production |
| 2022 | 6.1% | Technological advancements enhanced efficiency |
| 2023 | 2.9% | Rising demand for electronics components |
| 2024 | 3.5% | Increased investment in research initiatives |
| 2025 | 2.9% | Growing applications in pharmaceuticals sector |
| 2026 | 2.8% | Expansion of renewable energy projects |
| 2027 | 2.8% | Automotive industry demand surged forward |
| 2028 | 2.9% | Emerging markets increased consumption rates |
| 2029 | 3.0% | Strategic partnerships enhanced market reach |
| 2030 | 2.9% | Sustainability trends drove product innovation |
| 2031 | 2.2% | Consumer awareness of thallium benefits |
| 2032 | 2.5% | Regulatory support for industry growth |
Note - Market size estimations and growth projections presented in this report are based on 6Wresearch’s advanced forecasting approach, validated with industry datasets as of June 2026.
United States (US) Thallium Market Synopsis
A significant force shaping the US Thallium Market is the rapid advancement of technology in the electronics and healthcare industries. As thallium compounds continue to be integral in the manufacturing of semiconductors and medical imaging tools, the market is poised for continuous evolution and expansion.
Moreover, the ongoing research and development initiatives aimed at discovering new applications for thallium are generating renewed interest. While regulatory challenges surrounding its toxicity present hurdles, the diverse applications across sectors sustain a positive outlook for market participants.
United States (US) Thallium Market Key Takeaways
- The market is anticipated to grow from USD 109 Million in 2025 to USD 128 Million by 2032.
- Technological advancements in electronics and healthcare sectors are primary growth drivers.
- Environmental and health regulations impose strict controls on thallium production and use.
- Increased R&D efforts are expected to lead to new applications for thallium.
- Investment opportunities are growing in thallium mining and technology sectors.
Evaluation of Restraints in United States (US) Thallium Market
Despite the promising growth prospects, the US Thallium Market faces notable restraints. A primary concern is the heavy reliance on imports to meet domestic demand, which can lead to supply chain vulnerabilities and price instability. Furthermore, the classification of thallium as a toxic substance results in stringent regulatory measures that complicate production and market entry for new players. These regulations not only require compliance investments but also limit the expansion capabilities of existing market participants. The niche applications of thallium mean that demand can fluctuate, adding another layer of complexity to the market dynamics.
United States (US) Thallium Market Trends
Current trends in the US Thallium Market are centered on the increasing demand for thallium-based technologies in electronic devices, particularly in semiconductors and optical lenses. The healthcare sector is also experiencing a heightened interest in thallium for its role in diagnostic imaging and therapeutic applications. Additionally, sustainable practices are gaining traction, as industries explore ways to mitigate the environmental impact of thallium usage.
United States (US) Thallium Market Opportunities
Investment opportunities within the US Thallium Market are abundant, especially in the electronics and healthcare sectors. The ongoing demand for thallium in semiconductor manufacturing and cancer treatment diagnostics suggests a ripe environment for new technologies and processes. Investors can also look into thallium mining operations, as domestic production capacity needs enhancement to reduce import dependencies. Furthermore, the energy sector offers potential as thallium finds applications in solar panel production and catalytic processes.
Government Initiatives in the United States (US) Thallium Market
While there are no specific government policies tailored exclusively to the thallium market, various health and environmental regulations shape its operational landscape. Notably, the Toxic Substances Control Act and the Clean Air Act impose strict guidelines on the handling and disposal of thallium. Agencies like the Environmental Protection Agency play a critical role in regulating the import and export of thallium, aiming to safeguard public health and the environment from its toxic effects.
Future Insights of the United States (US) Thallium Market
Looking ahead to 2026-2032, the future of the US Thallium Market appears optimistic, buoyed by the continual integration of thallium into innovative applications across diverse industries. The increasing adoption of thallium in semiconductor technology and medical imaging indicates a sustained demand. However, companies must navigate regulatory landscapes and environmental concerns as they seek to exploit new opportunities. With persistent research and development efforts, the market is likely to witness the emergence of novel applications that could redefine its trajectory.
United States (US) Thallium Market Latest Developments (May 2025 - June 2026)
Recent developments in the US Thallium Market indicate a growing focus on enhancing the safety and efficiency of thallium usage in production processes. Industry players are increasingly investing in research aimed at identifying alternative methods for thallium extraction and processing that align with environmental standards. Additionally, collaborative efforts between regulatory bodies and industry stakeholders are working towards establishing comprehensive guidelines that facilitate safer handling and application of thallium across sectors.
United States (US) Thallium Market - Key Attractiveness of the Report
- 10 Years of Market Numbers
- Historical Data Starting from 2022 to 2025
- Base Year: 2025
- Forecast Data until 2032
- Key Performance Indicators Impacting the Market
- Major Upcoming Developments and Projects
Key Highlights of the Report:
- United States (US) Thallium Market Outlook
- Market Size of United States (US) Thallium Market, 2025
- Forecast of United States (US) Thallium Market, 2032
- Historical Data and Forecast of United States (US) Thallium Revenues & Volume for the Period 2022-2032F
- United States (US) Thallium Market Trend Evolution
- United States (US) Thallium Market Drivers and Challenges
- United States (US) Thallium Price Trends
- United States (US) Thallium Porter's Five Forces
- United States (US) Thallium Industry Life Cycle
- Historical Data and Forecast of United States (US) Thallium Market Revenues & Volume By Type for the Period 2022-2032F
- Historical Data and Forecast of United States (US) Thallium Market Revenues & Volume By Granular for the Period 2022-2032F
- Historical Data and Forecast of United States (US) Thallium Market Revenues & Volume By Rod for the Period 2022-2032F
- Historical Data and Forecast of United States (US) Thallium Market Revenues & Volume By Others for the Period 2022-2032F
- Historical Data and Forecast of United States (US) Thallium Market Revenues & Volume By Application for the Period 2022-2032F
- Historical Data and Forecast of United States (US) Thallium Market Revenues & Volume By Optics for the Period 2022-2032F
- Historical Data and Forecast of United States (US) Thallium Market Revenues & Volume By Electronics for the Period 2022-2032F
- Historical Data and Forecast of United States (US) Thallium Market Revenues & Volume By High-temperature superconductivity for the Period 2022-2032F
- Historical Data and Forecast of United States (US) Thallium Market Revenues & Volume By Others for the Period 2022-2032F
- United States (US) Thallium Import Export Trade Statistics
- Market Opportunity Assessment By Type
- Market Opportunity Assessment By Application
- United States (US) Thallium Top Companies Market Share
- United States (US) Thallium Competitive Benchmarking By Technical and Operational Parameters
- United States (US) Thallium Company Profiles
- United States (US) Thallium Key Strategic Recommendations
United States (US) Thallium Market - Frequently Asked Questions
The market is estimated to be valued at USD 109 Million in 2025, with projections to reach USD 128 Million by 2032, growing at a CAGR of 2.3% from 2026 to 2032.
The electronics and healthcare sectors are the primary drivers of demand for thallium, with applications ranging from semiconductors to diagnostic imaging.
The US Thallium Market faces strict regulations due to its toxic nature, governed by the Toxic Substances Control Act and other environmental laws that dictate safe handling and usage.
Yes, there are significant investment opportunities in sectors such as electronics, healthcare, and thallium mining, given the increasing demand and ongoing research into new applications.
Ongoing research and development are crucial as they explore innovative applications for thallium, potentially leading to market expansion and new technological advancements.
6Wresearch actively monitors the United States (US) Thallium Market and publishes its comprehensive annual report, highlighting emerging trends, growth drivers, revenue analysis, and forecast outlook. Our insights help businesses to make data-backed strategic decisions with ongoing market dynamics. Our analysts track relevent industries related to the United States (US) Thallium Market, allowing our clients with actionable intelligence and reliable forecasts tailored to emerging regional needs.
Yes, we provide customisation as per your requirements. To learn more, feel free to contact us on sales@6wresearch.com
1 Executive Summary |
2 Introduction |
2.1 Key Highlights of the Report |
2.2 Report Description |
2.3 Market Scope & Segmentation |
2.4 Research Methodology |
2.5 Assumptions |
3 United States (US) Thallium Market Overview |
3.1 United States (US) Country Macro Economic Indicators |
3.2 United States (US) Thallium Market Revenues & Volume, 2022 & 2032F |
3.3 United States (US) Thallium Market - Industry Life Cycle |
3.4 United States (US) Thallium Market - Porter's Five Forces |
3.5 United States (US) Thallium Market Revenues & Volume Share, By Type, 2022 & 2032F |
3.6 United States (US) Thallium Market Revenues & Volume Share, By Application, 2022 & 2032F |
4 United States (US) Thallium Market Dynamics |
4.1 Impact Analysis |
4.2 Market Drivers |
4.2.1 Growing demand for thallium-based technologies in medical imaging and nuclear medicine applications |
4.2.2 Increasing use of thallium in electronics and semiconductor manufacturing |
4.2.3 Rising investments in research and development of new thallium-based products |
4.3 Market Restraints |
4.3.1 Limited availability of thallium resources and production capacity |
4.3.2 Stringent regulatory requirements and environmental concerns related to thallium mining and processing |
4.3.3 Volatility in thallium prices due to fluctuations in supply and demand |
5 United States (US) Thallium Market Trends |
6 United States (US) Thallium Market, By Types |
6.1 United States (US) Thallium Market, By Type |
6.1.1 Overview and Analysis |
6.1.2 United States (US) Thallium Market Revenues & Volume, By Type, 2022-2032F |
6.1.3 United States (US) Thallium Market Revenues & Volume, By Granular, 2022-2032F |
6.1.4 United States (US) Thallium Market Revenues & Volume, By Rod, 2022-2032F |
6.1.5 United States (US) Thallium Market Revenues & Volume, By Others, 2022-2032F |
6.2 United States (US) Thallium Market, By Application |
6.2.1 Overview and Analysis |
6.2.2 United States (US) Thallium Market Revenues & Volume, By Optics, 2022-2032F |
6.2.3 United States (US) Thallium Market Revenues & Volume, By Electronics, 2022-2032F |
6.2.4 United States (US) Thallium Market Revenues & Volume, By High-temperature superconductivity, 2022-2032F |
6.2.5 United States (US) Thallium Market Revenues & Volume, By Others, 2022-2032F |
7 United States (US) Thallium Market Import-Export Trade Statistics |
7.1 United States (US) Thallium Market Export to Major Countries |
7.2 United States (US) Thallium Market Imports from Major Countries |
8 United States (US) Thallium Market Key Performance Indicators |
8.1 Research and development investment in thallium-based technologies |
8.2 Number of patents filed for thallium-related innovations |
8.3 Adoption rate of thallium in new applications |
8.4 Efficiency of thallium extraction and processing technologies |
8.5 Environmental impact assessments and compliance measures in thallium production and usage |
9 United States (US) Thallium Market - Opportunity Assessment |
9.1 United States (US) Thallium Market Opportunity Assessment, By Type, 2022 & 2032F |
9.2 United States (US) Thallium Market Opportunity Assessment, By Application, 2022 & 2032F |
10 United States (US) Thallium Market - Competitive Landscape |
10.1 United States (US) Thallium Market Revenue Share, By Companies, 2025 |
10.2 United States (US) Thallium Market Competitive Benchmarking, By Operating and Technical Parameters |
11 Company Profiles |
12 Recommendations |
13 Disclaimer |
Global Go To Market Strategy - 2030
Export potential enables firms to identify high-growth global markets with greater confidence by combining advanced trade intelligence with a structured quantitative methodology. The framework analyzes emerging demand trends and country-level import patterns while integrating macroeconomic and trade datasets such as GDP and population forecasts, bilateral import–export flows, tariff structures, elasticity differentials between developed and developing economies, geographic distance, and import demand projections. Using weighted trade values from 2020–2024 as the base period to project country-to-country export potential for 2030, these inputs are operationalized through calculated drivers such as gravity model parameters, tariff impact factors, and projected GDP per-capita growth. Through an analysis of hidden potentials, demand hotspots, and market conditions that are most favorable to success, this method enables firms to focus on target countries, maximize returns, and global expansion with data, backed by accuracy.
By factoring in the projected importer demand gap that is currently unmet and could be potential opportunity, it identifies the potential for the Exporter (Country) among 190 countries, against the general trade analysis, which identifies the biggest importer or exporter.
To discover high-growth global markets and optimize your business strategy:
Click Here
Pricing
- Single User License$ 1,995
- Department License$ 2,400
- Site License$ 3,120
- Global License$ 3,795

Leadership Perspectives from Industry Events
Search
Thought Leadership and Analyst Meet


Our Clients
6WResearch In News
- India Air Conditioner Market Set for Strong Rebound in 2026 After Weather-Led Correction and GST-Driven Recovery: 6Wresearch
- ADAS in India: How Automatic Emergency Braking, Blind Spot Detection & Driver Monitoring are Transforming Road Safety
- Doha a strategic location for EV manufacturing hub: IPA Qatar
- Demand for luxury TVs surging in the GCC, says Samsung
- Empowering Growth: The Thriving Journey of Bangladesh’s Cable Industry
- Demand for luxury TVs surging in the GCC, says Samsung
Latest Reports
- Nicaragua RPG Gaming Market (2026-2032)
- New Zealand RPG Gaming Market (2026-2032)
- Netherlands RPG Gaming Market (2026-2032)
- Nauru RPG Gaming Market (2026-2032)
- Namibia RPG Gaming Market (2026-2032)
- Mozambique RPG Gaming Market (2026-2032)
- Montenegro RPG Gaming Market (2026-2032)
- Mongolia RPG Gaming Market (2026-2032)
- Monaco RPG Gaming Market (2026-2032)
- Micronesia RPG Gaming Market (2026-2032)
Industry Events and Analyst Meet

HIMTEX 2026

India Refining Summit 2026

India EV Show 2026

EV tech India Expo 2026

Auto Tech Asia 2026
Whitepaper
- Middle East & Africa Commercial Security Market Click here to view more.
- Middle East & Africa Fire Safety Systems & Equipment Market Click here to view more.
- GCC Drone Market Click here to view more.
- Middle East Lighting Fixture Market Click here to view more.
- GCC Physical & Perimeter Security Market Click here to view more.