United States (US) Underground Utility Mapping Market Size & Growth Rate (2026-2032)
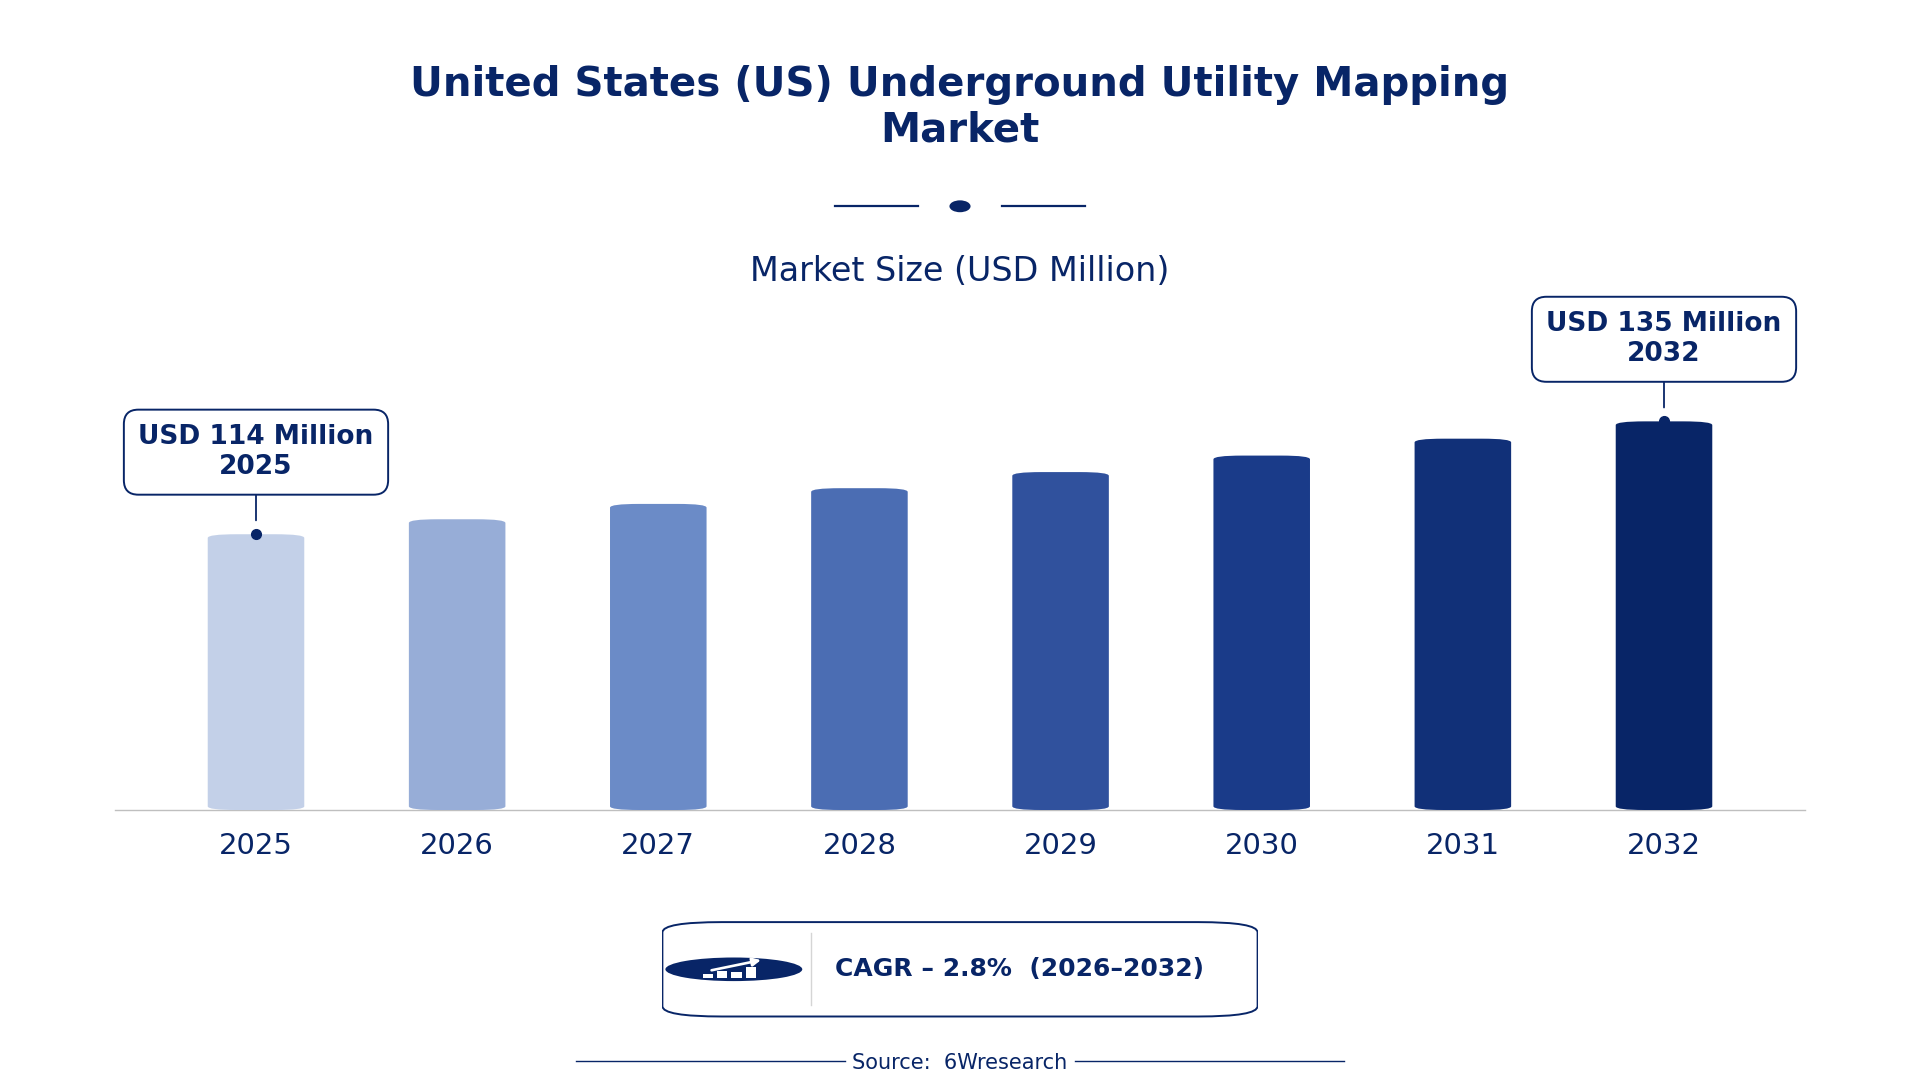
The United States (US) Underground Utility Mapping Market was estimated at USD 114 Million in 2025 and is projected to reach USD 135 Million by 2032, growing at a CAGR of 2.8% from 2026 to 2032.
United States (US) Underground Utility Mapping Market Synopsis
The escalating emphasis on infrastructure development is the primary force shaping the United States Underground Utility Mapping Market. As urban areas expand and construction activities rise, accurate utility mapping becomes indispensable for preventing costly disruptions and ensuring project efficiency.
Technological innovations are further driving this sector. Advanced geospatial tools, Ground Penetrating Radar (GPR), and Geographic Information Systems (GIS) are enhancing the precision of underground mapping, making it increasingly vital for utility management across various industries.
United States (US) Underground Utility Mapping Market Year-wise Growth Rate and Key Drivers
This graph illustrates the annual growth rates of the United States (US) Underground Utility Mapping Market from 2021 to 2032, highlighting a steady upward trajectory and projected expansion over the forecast period.
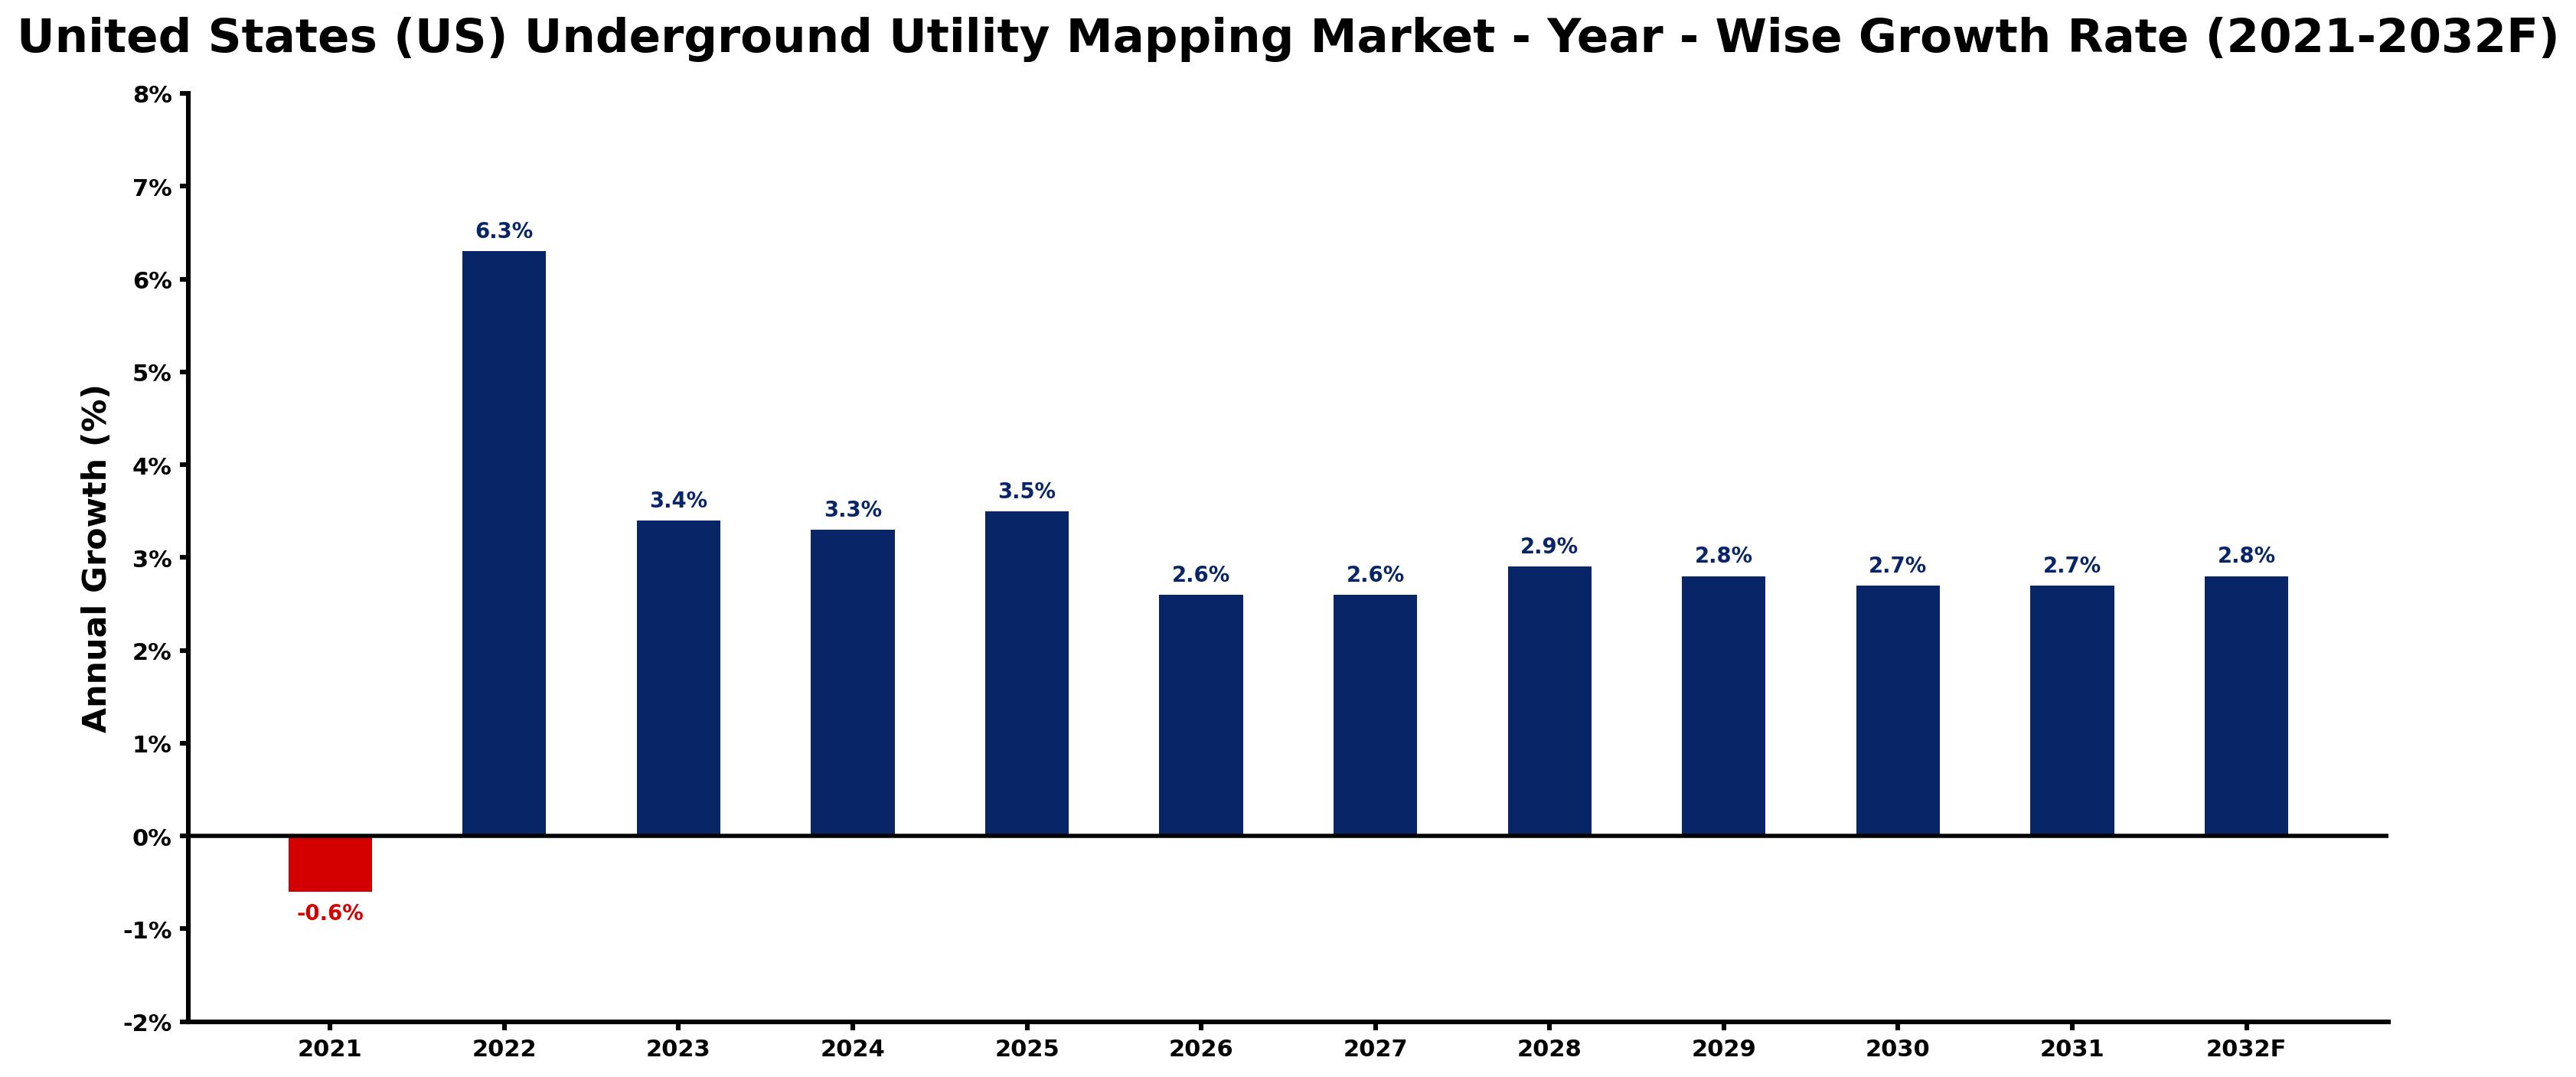
The table below presents the year‑wise growth rates along with the key drivers influencing the market
| Year | Growth Rate | Major Drivers |
| 2021 | -0.6% | Withdrawal of federal infrastructure funding impacts mapping investments. |
| 2022 | 6.3% | Increased state regulations for underground utility safety. |
| 2023 | 3.4% | Federal funding for urban infrastructure projects boosts mapping. |
| 2024 | 3.3% | Rising adoption of GIS technology in construction projects. |
| 2025 | 3.5% | Local government initiatives for smarter city planning. |
| 2026 | 2.6% | Growing awareness of utility damage prevention programs. |
| 2027 | 2.6% | Expansion in broadband infrastructure requiring detailed mapping. |
| 2028 | 2.9% | Utility companies enhancing asset management with detailed mapping. |
| 2029 | 2.8% | Increased construction permits demand precise underground mapping. |
| 2030 | 2.7% | Enhanced liability laws driving mapping service necessities. |
| 2031 | 2.7% | Growing public awareness of infrastructure investment importance. |
| 2032 | 2.8% | Emergence of 5G technologies increasing need for utility mapping. |
Note: Market size estimations and growth projections presented in this report are based on 6Wresearch's proprietary forecasting methodology, utilizing the latest available industry data, government publications, and primary research inputs.
United States (US) Underground Utility Mapping Market Key Takeaways
Below are some of the specific key takeaways from the market, including:
- Infrastructure investment is accelerating the demand for underground utility mapping services.
- Technological advancements such as GPR and GIS are becoming standard tools in the industry.
- Regulatory frameworks are promoting standardized practices for utility mapping across the country.
- Collaboration among stakeholders is essential to overcome existing challenges in the mapping process.
- Adoption of UAVs for aerial mapping is gaining traction, particularly in urban areas.
Evaluation of Restraints in United States (US) Underground Utility Mapping Market
A lack of accurate, up-to-date data on underground infrastructure is a major restraint in this market. Different regions have inconsistent mapping standards, complicating efforts for effective utility management. The costs associated with underground surveys can also deter investment, especially for smaller firms. on top of that, the complexity of urban environments, with overlapping utility networks, adds another layer of difficulty. Raising awareness among construction companies about the significance of precise mapping is crucial for market growth.
United States (US) Underground Utility Mapping Market Trends
The push for accurate mapping is leading to the increasing adoption of advanced technologies. Ground Penetrating Radar (GPR) and LiDAR are being integrated into regular mapping practices for enhanced data collection. The use of Geographic Information Systems (GIS) is becoming commonplace, providing better visualization and analysis of underground utilities.
There’s a noticeable shift towards using unmanned aerial vehicles (UAVs) for aerial mapping in urban settings, streamlining data acquisition and improving accuracy. These trends indicate a broader move towards more efficient and cost-effective solutions in underground utility mapping.
United States (US) Underground Utility Mapping Market Opportunities
The landscape is ripe for investment, particularly in technology providers that specialize in mapping and utility detection. As infrastructure projects proliferate, the demand for integrated solutions grows. Companies offering innovative approaches, such as Building Information Modeling (BIM), are well-positioned for expansion. on top of that, government regulations advocating for accurate mapping to prevent excavation damages add another layer of opportunity for market participants.
Government Initiatives in the United States (US) Underground Utility Mapping Market
Government policy plays a crucial role in shaping the United States Underground Utility Mapping Market. Regulations are focused on enhancing safety and efficiency in the management of underground utilities. This regulatory environment encourages adherence to established standards and promotes the use of advanced mapping technologies.
- A recently completed initiative is the expansion of the 811 "Call Before You Dig" program, aimed at increasing public awareness about safe excavation practices.
- A current initiative is the National Utility Mapping Infrastructure Act (NUMIA), which is actively promoting the establishment of comprehensive mapping systems across states.
- Planned is a nationwide digital infrastructure upgrade programme set to commence in 2026, aimed at modernizing utility mapping practices.
- The Federal Communications Commission (FCC) is currently reviewing regulations to enhance communication infrastructure mapping standards.
- Upcoming legislation is expected to introduce stricter compliance measures for utility mapping in high-density urban areas.
Future Insights of the United States (US) Underground Utility Mapping Market
Looking ahead to 2026-2032, the United States Underground Utility Mapping Market is expected to witness robust growth. The increasing urgency for infrastructure modernization, coupled with advancements in mapping technologies, will drive demand. Enhanced governmental support and regulatory frameworks will likely further facilitate industry expansion. Investments in innovative mapping solutions, such as augmented reality for real-time visualization, are set to transform how utilities are managed and maintained.
United States (US) Underground Utility Mapping Market Latest Developments
In the past 12-14 months, there has been a notable surge in activities within the United States Underground Utility Mapping Market. Companies are increasingly focusing on innovative technologies to improve mapping accuracy and efficiency. This trend is likely to continue as stakeholders recognize the value of precise utility mapping in preventing project delays and accidents.
- A major technology vendor launched a new ground-penetrating radar system in Q3 2025, enhancing data accuracy for underground utility mapping.
- In early 2025, a leading regional operator entered into a partnership with a software developer to create a GIS-based solution for utility management.
- An ongoing initiative began in mid-2025 to integrate drone technology into utility mapping practices, improving both speed and accuracy.
- A planned rollout for a user-friendly mobile application designed for real-time utility mapping is expected to begin in late 2026.
- By early 2026, a public-private partnership is set to initiate a comprehensive underground utility mapping project aimed at urban areas.
United States (US) Underground Utility Mapping Market - Key Attractiveness of the Report
- 10 Years of Market Numbers
- Historical Data Starting from 2022 to 2025
- Base Year: 2025
- Forecast Data until 2032
- Key Performance Indicators Impacting the Market
- Major Upcoming Developments and Projects
Key Highlights of the Report:
- United States (US) Underground Utility Mapping Market Outlook
- Market Size of United States (US) Underground Utility Mapping Market, 2025
- Forecast of United States (US) Underground Utility Mapping Market, 2032
- Historical Data and Forecast of United States (US) Underground Utility Mapping Revenues & Volume for the Period 2022-2032F
- United States (US) Underground Utility Mapping Market Trend Evolution
- United States (US) Underground Utility Mapping Market Drivers and Challenges
- United States (US) Underground Utility Mapping Price Trends
- United States (US) Underground Utility Mapping Porter's Five Forces
- United States (US) Underground Utility Mapping Industry Life Cycle
- Historical Data and Forecast of United States (US) Underground Utility Mapping Market Revenues & Volume By Component for the Period 2022-2032F
- Historical Data and Forecast of United States (US) Underground Utility Mapping Market Revenues & Volume By Technological Solutions for the Period 2022-2032F
- Historical Data and Forecast of United States (US) Underground Utility Mapping Market Revenues & Volume By Services for the Period 2022-2032F
- Historical Data and Forecast of United States (US) Underground Utility Mapping Market Revenues & Volume By Vertical for the Period 2022-2032F
- Historical Data and Forecast of United States (US) Underground Utility Mapping Market Revenues & Volume By Oil & Gas for the Period 2022-2032F
- Historical Data and Forecast of United States (US) Underground Utility Mapping Market Revenues & Volume By Electricity for the Period 2022-2032F
- Historical Data and Forecast of United States (US) Underground Utility Mapping Market Revenues & Volume By Government & Public Safety for the Period 2022-2032F
- Historical Data and Forecast of United States (US) Underground Utility Mapping Market Revenues & Volume By Construction for the Period 2022-2032F
- Historical Data and Forecast of United States (US) Underground Utility Mapping Market Revenues & Volume By Telecommunication for the Period 2022-2032F
- Historical Data and Forecast of United States (US) Underground Utility Mapping Market Revenues & Volume By Others for the Period 2022-2032F
- United States (US) Underground Utility Mapping Import Export Trade Statistics
- Market Opportunity Assessment By Component
- Market Opportunity Assessment By Vertical
- United States (US) Underground Utility Mapping Top Companies Market Share
- United States (US) Underground Utility Mapping Competitive Benchmarking By Technical and Operational Parameters
- United States (US) Underground Utility Mapping Company Profiles
- United States (US) Underground Utility Mapping Key Strategic Recommendations