United States (US) Vanadium Pentoxide Market (2026-2032) Outlook | Companies, Trends, Value, Revenue, Size, Share, Forecast, Growth, Industry & Analysis
Market Forecast By Type (Dry Vanadium Pentoxide, Wet Vanadium Pentoxide, Others), By Application (Sulfuric Acid Preparation, Vanadium Metal Alloys, Others), By Vertical (Chemical & Petrochemical, Oil & Gas, Energy & Power, Automotive, Food & Beverages, Steel, Healthcare, Others) And Competitive Landscape
| Product Code: ETC194113 | Publication Date: May 2022 | Updated Date: Jun 2026 | Product Type: Market Research Report | |
| Publisher: 6Wresearch | Author: Summon Dutta | No. of Pages: 60 | No. of Figures: 40 | No. of Tables: 7 |
United States (US) Vanadium Pentoxide Market Size, Share & Growth Rate
The United States (US) Vanadium Pentoxide Market was estimated at USD 91 Million in 2025 and is projected to reach USD 107 Million by 2032, growing at a CAGR of 2.3% from 2026 to 2032. This steady growth trajectory is primarily fueled by the increasing demand from the steel and aerospace sectors, where vanadium pentoxide plays a critical role in producing high-strength steel and lightweight components. Additionally, the government's emphasis on infrastructure development and renewable energy storage solutions is set to further enhance market dynamics.
United States (US) Vanadium Pentoxide Market Growth Rate Analysis (2021-2032)
The Vanadium Pentoxide market in the United States has shown a notable recovery after a slight contraction of 0.4% in 2021, with growth rebounding to 5.9% in 2022. This surge can be attributed to increasing demand for energy storage solutions and technological advancements in battery manufacturing. As the market stabilized, growth decelerated to 2.8% in 2023, projected to fluctuate between 2.5% and 3.3% through 2032. Factors such as infrastructure investments and a shift toward renewable energy sources are driving this upward trend. The continued emphasis on energy transition strategies is expected to further bolster demand for Vanadium Pentoxide, rendering it a vital component in modern industrial applications.
United States (US) Vanadium Pentoxide Market Year-wise Growth Rate and Key Drivers
This graph highlights how the United States (US) Vanadium Pentoxide Market has steadily grown over the past five years, supported by major growth factors.
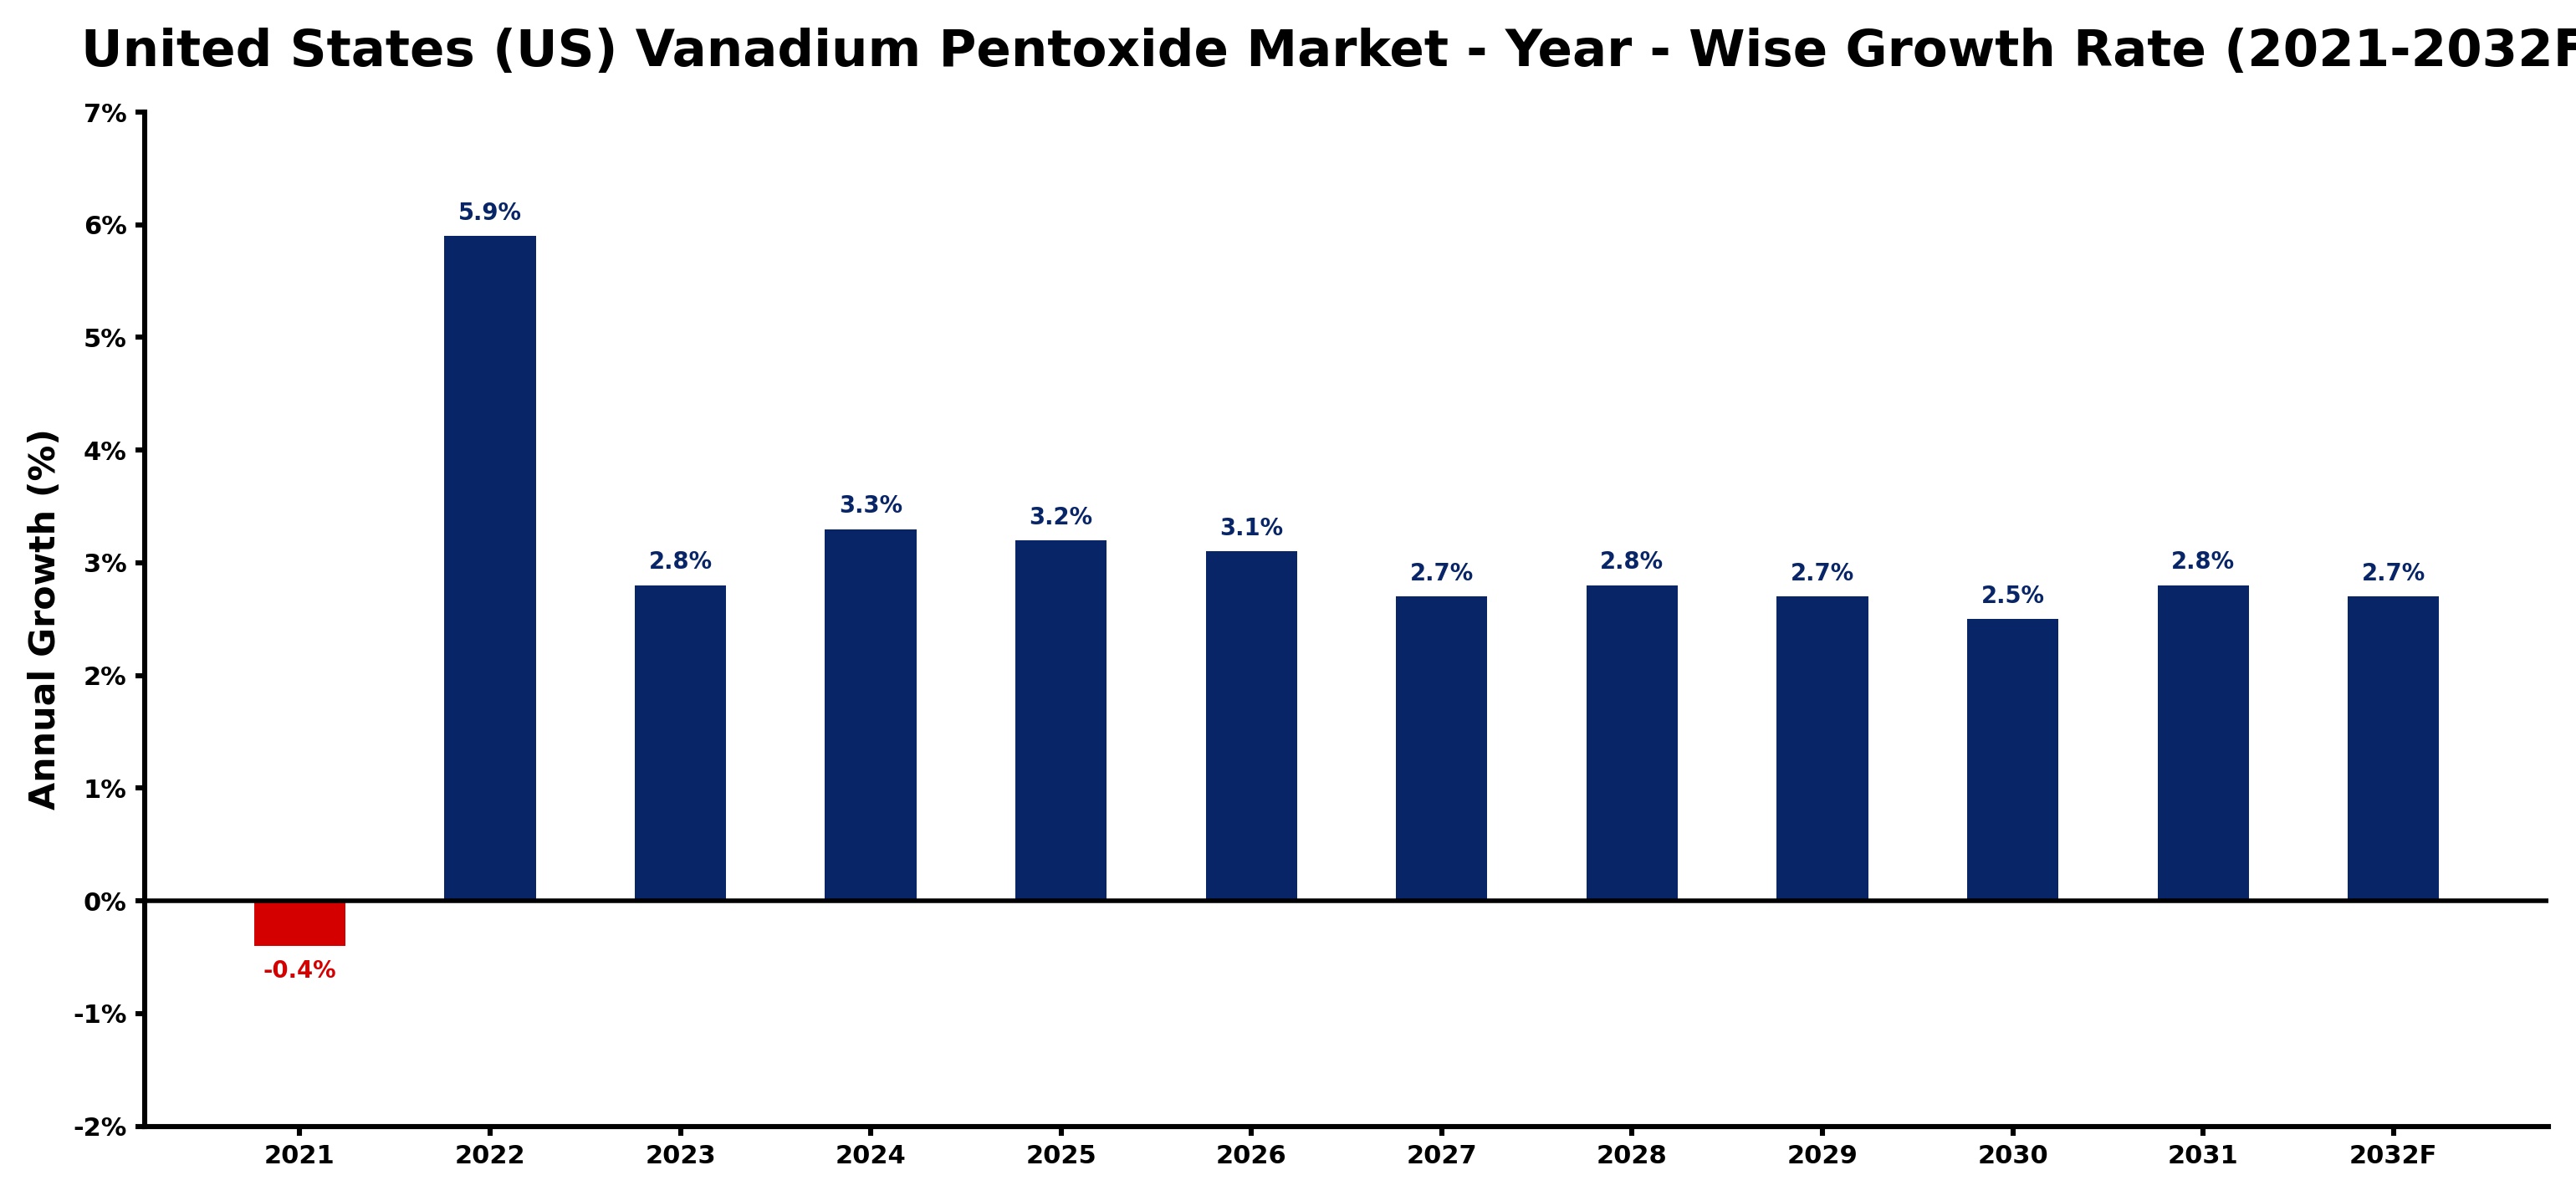
The table below presents the year‑wise growth rates along with the key drivers influencing the market
| Year | Growth Rate | Major Drivers |
| 2021 | -0.4% | Supply chain disruptions impacted production |
| 2022 | 5.9% | Renewable energy demand spurred growth |
| 2023 | 2.8% | Battery technology advancements increased usage |
| 2024 | 3.3% | Electric vehicle market expansion accelerated |
| 2025 | 3.2% | Industrial applications drove higher demand |
| 2026 | 3.1% | Technological innovations enhanced efficiency |
| 2027 | 2.7% | Strategic partnerships improved market reach |
| 2028 | 2.8% | Sustainability initiatives promoted adoption |
| 2029 | 2.7% | Research investments boosted product development |
| 2030 | 2.5% | Government incentives supported industry growth |
| 2031 | 2.8% | Global market trends influenced expansion |
| 2032 | 2.7% | Consumer awareness enhanced market potential |
Note - Market size estimations and growth projections presented in this report are based on 6Wresearch’s advanced forecasting approach, validated with industry datasets as of June 2026.
United States (US) Vanadium Pentoxide Market Synopsis
The US Vanadium Pentoxide market has recently seen a surge in activity, driven by growing industrial needs and heightened governmental focus on energy storage technologies. However, as this momentum continues, the market faces challenges such as price volatility and competition from alternative materials.
Looking ahead, the market is on a promising path, supported by innovations in energy storage applications and ongoing investments in research and development. The advent of vanadium redox flow batteries as a reliable energy storage solution is particularly noteworthy, positioning vanadium pentoxide as a crucial material in the transition to sustainable energy.
United States (US) Vanadium Pentoxide Market Key Takeaways
- The US Vanadium Pentoxide market is growing due to increasing demand from the steel and aerospace industries.
- Government infrastructure spending and a focus on renewable energy storage bolster market prospects.
- Research and development efforts are expanding to enhance product applications and quality.
- Investors can explore opportunities in mining and energy storage sectors as demand rises.
- Price fluctuations and competition from alternative technologies are key market concerns.
Evaluation of Restraints in United States (US) Vanadium Pentoxide Market
Despite its growth potential, the United States Vanadium Pentoxide market is challenged by several restraints. Fluctuating global vanadium prices can create uncertainty for manufacturers and investors, as they directly influence production costs and profit margins. Additionally, evolving regulatory frameworks and the rapid advancement of competing energy storage technologies, particularly lithium-ion batteries, could divert investment and attention away from vanadium-based solutions. These factors necessitate a strategic approach from market participants to mitigate risks and maintain competitiveness.
United States (US) Vanadium Pentoxide Market Trends
Current trends in the US Vanadium Pentoxide market indicate a significant shift toward sustainable energy solutions, particularly the growing interest in vanadium redox flow batteries (VRFBs). These systems are increasingly viewed as a reliable option for grid energy storage, particularly for renewable sources. Furthermore, industries are becoming more aware of vanadium's strength-enhancing properties, leading to its expanded application in construction and automotive sectors. This dual focus on sustainability and performance enhancement is driving innovation and demand.
United States (US) Vanadium Pentoxide Market Opportunities
The US Vanadium Pentoxide market presents multiple avenues for growth and investment. With increasing demand for vanadium-based products across various sectors, particularly in energy storage and steel production, investors have the opportunity to explore ventures in mining operations and battery manufacturing. Moreover, the growing recognition of vanadium's role in developing robust energy solutions positions the market as a focal point for research and technological advancements, creating a fertile landscape for strategic investments.
Government Initiatives in the United States (US) Vanadium Pentoxide Market
While there are no specific policies exclusively targeting the Vanadium Pentoxide market, the US government's initiatives related to energy storage technologies significantly impact this sector. The Department of Energy's support for research into vanadium redox flow batteries illustrates a commitment to exploring sustainable energy solutions. Furthermore, tariffs imposed on vanadium imports aim to protect domestic producers, indirectly fostering market growth and encouraging investment in local vanadium processing capabilities.
Future Insights of the United States (US) Vanadium Pentoxide Market
The future of the United States Vanadium Pentoxide market appears robust, buoyed by escalating demand in the energy storage arena, particularly in the context of grid-scale applications and electric vehicles. As advancements in vanadium-based technologies continue, the material's performance and longevity in battery applications will enhance its appeal. Additionally, the US government's strategic focus on minimizing reliance on foreign critical minerals is likely to create a more favorable environment for domestic vanadium production, further stimulating market growth through 2032.
United States (US) Vanadium Pentoxide Market Latest Developments (May 2025 - June 2026)
In the period from May 2025 to June 2026, the United States Vanadium Pentoxide market has seen notable developments, with increased investment in research aimed at enhancing the efficiency of vanadium redox flow batteries. Furthermore, the sector has witnessed growing collaborations between research institutions and industry players focusing on innovative applications of vanadium pentoxide. The expanding infrastructure initiatives and heightened awareness of sustainable practices are also paving the way for expanded adoption of vanadium-based products.
United States (US) Vanadium Pentoxide Market - Key Attractiveness of the Report
- 10 Years of Market Numbers
- Historical Data Starting from 2022 to 2025
- Base Year: 2025
- Forecast Data until 2032
- Key Performance Indicators Impacting the Market
- Major Upcoming Developments and Projects
Key Highlights of the Report:
- United States (US) Vanadium Pentoxide Market Outlook
- Market Size of United States (US) Vanadium Pentoxide Market, 2025
- Forecast of United States (US) Vanadium Pentoxide Market, 2032
- Historical Data and Forecast of United States (US) Vanadium Pentoxide Revenues & Volume for the Period 2022-2032F
- United States (US) Vanadium Pentoxide Market Trend Evolution
- United States (US) Vanadium Pentoxide Market Drivers and Challenges
- United States (US) Vanadium Pentoxide Price Trends
- United States (US) Vanadium Pentoxide Porter's Five Forces
- United States (US) Vanadium Pentoxide Industry Life Cycle
- Historical Data and Forecast of United States (US) Vanadium Pentoxide Market Revenues & Volume By Type for the Period 2022-2032F
- Historical Data and Forecast of United States (US) Vanadium Pentoxide Market Revenues & Volume By Dry Vanadium Pentoxide for the Period 2022-2032F
- Historical Data and Forecast of United States (US) Vanadium Pentoxide Market Revenues & Volume By Wet Vanadium Pentoxide for the Period 2022-2032F
- Historical Data and Forecast of United States (US) Vanadium Pentoxide Market Revenues & Volume By Others for the Period 2022-2032F
- Historical Data and Forecast of United States (US) Vanadium Pentoxide Market Revenues & Volume By Application for the Period 2022-2032F
- Historical Data and Forecast of United States (US) Vanadium Pentoxide Market Revenues & Volume By Sulfuric Acid Preparation for the Period 2022-2032F
- Historical Data and Forecast of United States (US) Vanadium Pentoxide Market Revenues & Volume By Vanadium Metal Alloys for the Period 2022-2032F
- Historical Data and Forecast of United States (US) Vanadium Pentoxide Market Revenues & Volume By Others for the Period 2022-2032F
- Historical Data and Forecast of United States (US) Vanadium Pentoxide Market Revenues & Volume By Vertical for the Period 2022-2032F
- Historical Data and Forecast of United States (US) Vanadium Pentoxide Market Revenues & Volume By Chemical & Petrochemical for the Period 2022-2032F
- Historical Data and Forecast of United States (US) Vanadium Pentoxide Market Revenues & Volume By Oil & Gas for the Period 2022-2032F
- Historical Data and Forecast of United States (US) Vanadium Pentoxide Market Revenues & Volume By Energy & Power for the Period 2022-2032F
- Historical Data and Forecast of United States (US) Vanadium Pentoxide Market Revenues & Volume By Automotive for the Period 2022-2032F
- Historical Data and Forecast of United States (US) Vanadium Pentoxide Market Revenues & Volume By Food & Beverages for the Period 2022-2032F
- Historical Data and Forecast of United States (US) Vanadium Pentoxide Market Revenues & Volume By Steel for the Period 2022-2032F
- Historical Data and Forecast of United States (US) Vanadium Pentoxide Market Revenues & Volume By Healthcare for the Period 2022-2032F
- Historical Data and Forecast of United States (US) Vanadium Pentoxide Market Revenues & Volume By Others for the Period 2022-2032F
- United States (US) Vanadium Pentoxide Import Export Trade Statistics
- Market Opportunity Assessment By Type
- Market Opportunity Assessment By Application
- Market Opportunity Assessment By Vertical
- United States (US) Vanadium Pentoxide Top Companies Market Share
- United States (US) Vanadium Pentoxide Competitive Benchmarking By Technical and Operational Parameters
- United States (US) Vanadium Pentoxide Company Profiles
- United States (US) Vanadium Pentoxide Key Strategic Recommendations
United States (US) Vanadium Pentoxide Market - Frequently Asked Questions
The market is estimated to be USD 91 Million in 2025, with projections reaching USD 107 Million by 2032, reflecting a CAGR of 2.3% from 2026 to 2032.
The increasing adoption of renewable energy sources, particularly in energy storage systems like vanadium redox flow batteries, is significantly driving the demand for vanadium pentoxide, as it is crucial for enhancing battery efficiency.
The primary consumers of vanadium pentoxide include the steel and aerospace industries, where it is valued for its ability to strengthen materials while reducing weight, alongside emerging sectors like renewable energy storage.
The US Department of Energy supports research into vanadium applications, particularly in energy storage, and has implemented tariffs on vanadium imports to protect domestic producers, indirectly benefiting the market.
Fluctuations in global vanadium prices can impact production costs and profit margins for manufacturers, influencing investment decisions and overall market stability.
Recent developments focus on improving the efficiency and longevity of vanadium redox flow batteries, with collaborative efforts between industry and research institutions playing a key role in advancing vanadium technologies.
6Wresearch actively monitors the United States (US) Vanadium Pentoxide Market and publishes its comprehensive annual report, highlighting emerging trends, growth drivers, revenue analysis, and forecast outlook. Our insights help businesses to make data-backed strategic decisions with ongoing market dynamics. Our analysts track relevent industries related to the United States (US) Vanadium Pentoxide Market, allowing our clients with actionable intelligence and reliable forecasts tailored to emerging regional needs.
Yes, we provide customisation as per your requirements. To learn more, feel free to contact us on sales@6wresearch.com
1 Executive Summary |
2 Introduction |
2.1 Key Highlights of the Report |
2.2 Report Description |
2.3 Market Scope & Segmentation |
2.4 Research Methodology |
2.5 Assumptions |
3 United States (US) Vanadium Pentoxide Market Overview |
3.1 United States (US) Country Macro Economic Indicators |
3.2 United States (US) Vanadium Pentoxide Market Revenues & Volume, 2022 & 2032F |
3.3 United States (US) Vanadium Pentoxide Market - Industry Life Cycle |
3.4 United States (US) Vanadium Pentoxide Market - Porter's Five Forces |
3.5 United States (US) Vanadium Pentoxide Market Revenues & Volume Share, By Type, 2022 & 2032F |
3.6 United States (US) Vanadium Pentoxide Market Revenues & Volume Share, By Application, 2022 & 2032F |
3.7 United States (US) Vanadium Pentoxide Market Revenues & Volume Share, By Vertical, 2022 & 2032F |
4 United States (US) Vanadium Pentoxide Market Dynamics |
4.1 Impact Analysis |
4.2 Market Drivers |
4.2.1 Growing demand for vanadium pentoxide in energy storage applications due to its use in vanadium redox flow batteries. |
4.2.2 Increasing investments in infrastructure projects in the United States, where vanadium pentoxide is used in steel production for strengthening purposes. |
4.2.3 Rising focus on renewable energy sources, leading to the adoption of vanadium pentoxide in solar power systems for its energy storage capabilities. |
4.3 Market Restraints |
4.3.1 Fluctuating prices of vanadium pentoxide due to supply-demand imbalances in the global market. |
4.3.2 Regulatory challenges impacting the import and export of vanadium pentoxide, affecting the market dynamics in the United States. |
4.3.3 Competition from alternative materials and technologies that could potentially replace vanadium pentoxide in certain applications. |
5 United States (US) Vanadium Pentoxide Market Trends |
6 United States (US) Vanadium Pentoxide Market, By Types |
6.1 United States (US) Vanadium Pentoxide Market, By Type |
6.1.1 Overview and Analysis |
6.1.2 United States (US) Vanadium Pentoxide Market Revenues & Volume, By Type, 2022-2032F |
6.1.3 United States (US) Vanadium Pentoxide Market Revenues & Volume, By Dry Vanadium Pentoxide, 2022-2032F |
6.1.4 United States (US) Vanadium Pentoxide Market Revenues & Volume, By Wet Vanadium Pentoxide, 2022-2032F |
6.1.5 United States (US) Vanadium Pentoxide Market Revenues & Volume, By Others, 2022-2032F |
6.2 United States (US) Vanadium Pentoxide Market, By Application |
6.2.1 Overview and Analysis |
6.2.2 United States (US) Vanadium Pentoxide Market Revenues & Volume, By Sulfuric Acid Preparation, 2022-2032F |
6.2.3 United States (US) Vanadium Pentoxide Market Revenues & Volume, By Vanadium Metal Alloys, 2022-2032F |
6.2.4 United States (US) Vanadium Pentoxide Market Revenues & Volume, By Others, 2022-2032F |
6.3 United States (US) Vanadium Pentoxide Market, By Vertical |
6.3.1 Overview and Analysis |
6.3.2 United States (US) Vanadium Pentoxide Market Revenues & Volume, By Chemical & Petrochemical, 2022-2032F |
6.3.3 United States (US) Vanadium Pentoxide Market Revenues & Volume, By Oil & Gas, 2022-2032F |
6.3.4 United States (US) Vanadium Pentoxide Market Revenues & Volume, By Energy & Power, 2022-2032F |
6.3.5 United States (US) Vanadium Pentoxide Market Revenues & Volume, By Automotive, 2022-2032F |
6.3.6 United States (US) Vanadium Pentoxide Market Revenues & Volume, By Food & Beverages, 2022-2032F |
6.3.7 United States (US) Vanadium Pentoxide Market Revenues & Volume, By Steel, 2022-2032F |
6.3.8 United States (US) Vanadium Pentoxide Market Revenues & Volume, By Others, 2022-2032F |
6.3.9 United States (US) Vanadium Pentoxide Market Revenues & Volume, By Others, 2022-2032F |
7 United States (US) Vanadium Pentoxide Market Import-Export Trade Statistics |
7.1 United States (US) Vanadium Pentoxide Market Export to Major Countries |
7.2 United States (US) Vanadium Pentoxide Market Imports from Major Countries |
8 United States (US) Vanadium Pentoxide Market Key Performance Indicators |
8.1 Price trend analysis of vanadium pentoxide in the United States market. |
8.2 Growth in the number of energy storage projects utilizing vanadium pentoxide. |
8.3 Adoption rate of vanadium pentoxide in infrastructure and renewable energy projects in the United States. |
8.4 Research and development investments in vanadium pentoxide technologies within the United States. |
8.5 Environmental sustainability initiatives driving the demand for vanadium pentoxide in the market. |
9 United States (US) Vanadium Pentoxide Market - Opportunity Assessment |
9.1 United States (US) Vanadium Pentoxide Market Opportunity Assessment, By Type, 2022 & 2032F |
9.2 United States (US) Vanadium Pentoxide Market Opportunity Assessment, By Application, 2022 & 2032F |
9.3 United States (US) Vanadium Pentoxide Market Opportunity Assessment, By Vertical, 2022 & 2032F |
10 United States (US) Vanadium Pentoxide Market - Competitive Landscape |
10.1 United States (US) Vanadium Pentoxide Market Revenue Share, By Companies, 2025 |
10.2 United States (US) Vanadium Pentoxide Market Competitive Benchmarking, By Operating and Technical Parameters |
11 Company Profiles |
12 Recommendations |
13 Disclaimer |
Global Go To Market Strategy - 2030
Export potential enables firms to identify high-growth global markets with greater confidence by combining advanced trade intelligence with a structured quantitative methodology. The framework analyzes emerging demand trends and country-level import patterns while integrating macroeconomic and trade datasets such as GDP and population forecasts, bilateral import–export flows, tariff structures, elasticity differentials between developed and developing economies, geographic distance, and import demand projections. Using weighted trade values from 2020–2024 as the base period to project country-to-country export potential for 2030, these inputs are operationalized through calculated drivers such as gravity model parameters, tariff impact factors, and projected GDP per-capita growth. Through an analysis of hidden potentials, demand hotspots, and market conditions that are most favorable to success, this method enables firms to focus on target countries, maximize returns, and global expansion with data, backed by accuracy.
By factoring in the projected importer demand gap that is currently unmet and could be potential opportunity, it identifies the potential for the Exporter (Country) among 190 countries, against the general trade analysis, which identifies the biggest importer or exporter.
To discover high-growth global markets and optimize your business strategy:
Click Here
Pricing
- Single User License$ 1,995
- Department License$ 2,400
- Site License$ 3,120
- Global License$ 3,795

Leadership Perspectives from Industry Events
Search
Thought Leadership and Analyst Meet


Our Clients
6WResearch In News
- India Air Conditioner Market Set for Strong Rebound in 2026 After Weather-Led Correction and GST-Driven Recovery: 6Wresearch
- ADAS in India: How Automatic Emergency Braking, Blind Spot Detection & Driver Monitoring are Transforming Road Safety
- Doha a strategic location for EV manufacturing hub: IPA Qatar
- Demand for luxury TVs surging in the GCC, says Samsung
- Empowering Growth: The Thriving Journey of Bangladesh’s Cable Industry
- Demand for luxury TVs surging in the GCC, says Samsung
Latest Reports
- Nicaragua RPG Gaming Market (2026-2032)
- New Zealand RPG Gaming Market (2026-2032)
- Netherlands RPG Gaming Market (2026-2032)
- Nauru RPG Gaming Market (2026-2032)
- Namibia RPG Gaming Market (2026-2032)
- Mozambique RPG Gaming Market (2026-2032)
- Montenegro RPG Gaming Market (2026-2032)
- Mongolia RPG Gaming Market (2026-2032)
- Monaco RPG Gaming Market (2026-2032)
- Micronesia RPG Gaming Market (2026-2032)
Industry Events and Analyst Meet

HIMTEX 2026

India Refining Summit 2026

India EV Show 2026

EV tech India Expo 2026

Auto Tech Asia 2026
Whitepaper
- Middle East & Africa Commercial Security Market Click here to view more.
- Middle East & Africa Fire Safety Systems & Equipment Market Click here to view more.
- GCC Drone Market Click here to view more.
- Middle East Lighting Fixture Market Click here to view more.
- GCC Physical & Perimeter Security Market Click here to view more.