United States (US) Veterinary Imaging Market Outlook | Size, Forecast, Trends, COVID-19 IMPACT, Growth, Analysis, Share, Companies, Revenue, Value & Industry
Market Forecast By Product Type (Veterinary Imaging Instruments, Veterinary Software, Veterinary Imaging Reagents), By Animal Type (Small Companion Animals, Large Animals, Other Animals), By Application (Orthopedics and Traumatology, Oncology, Cardiology, Neurology, Others), By End-use (Hospitals, Clinics, Others) And Competitive Landscape
| Product Code: ETC406797 | Publication Date: Oct 2022 | Updated Date: Aug 2025 | Product Type: Market Research Report | |
| Publisher: 6Wresearch | Author: Dhaval Chaurasia | No. of Pages: 75 | No. of Figures: 35 | No. of Tables: 20 |
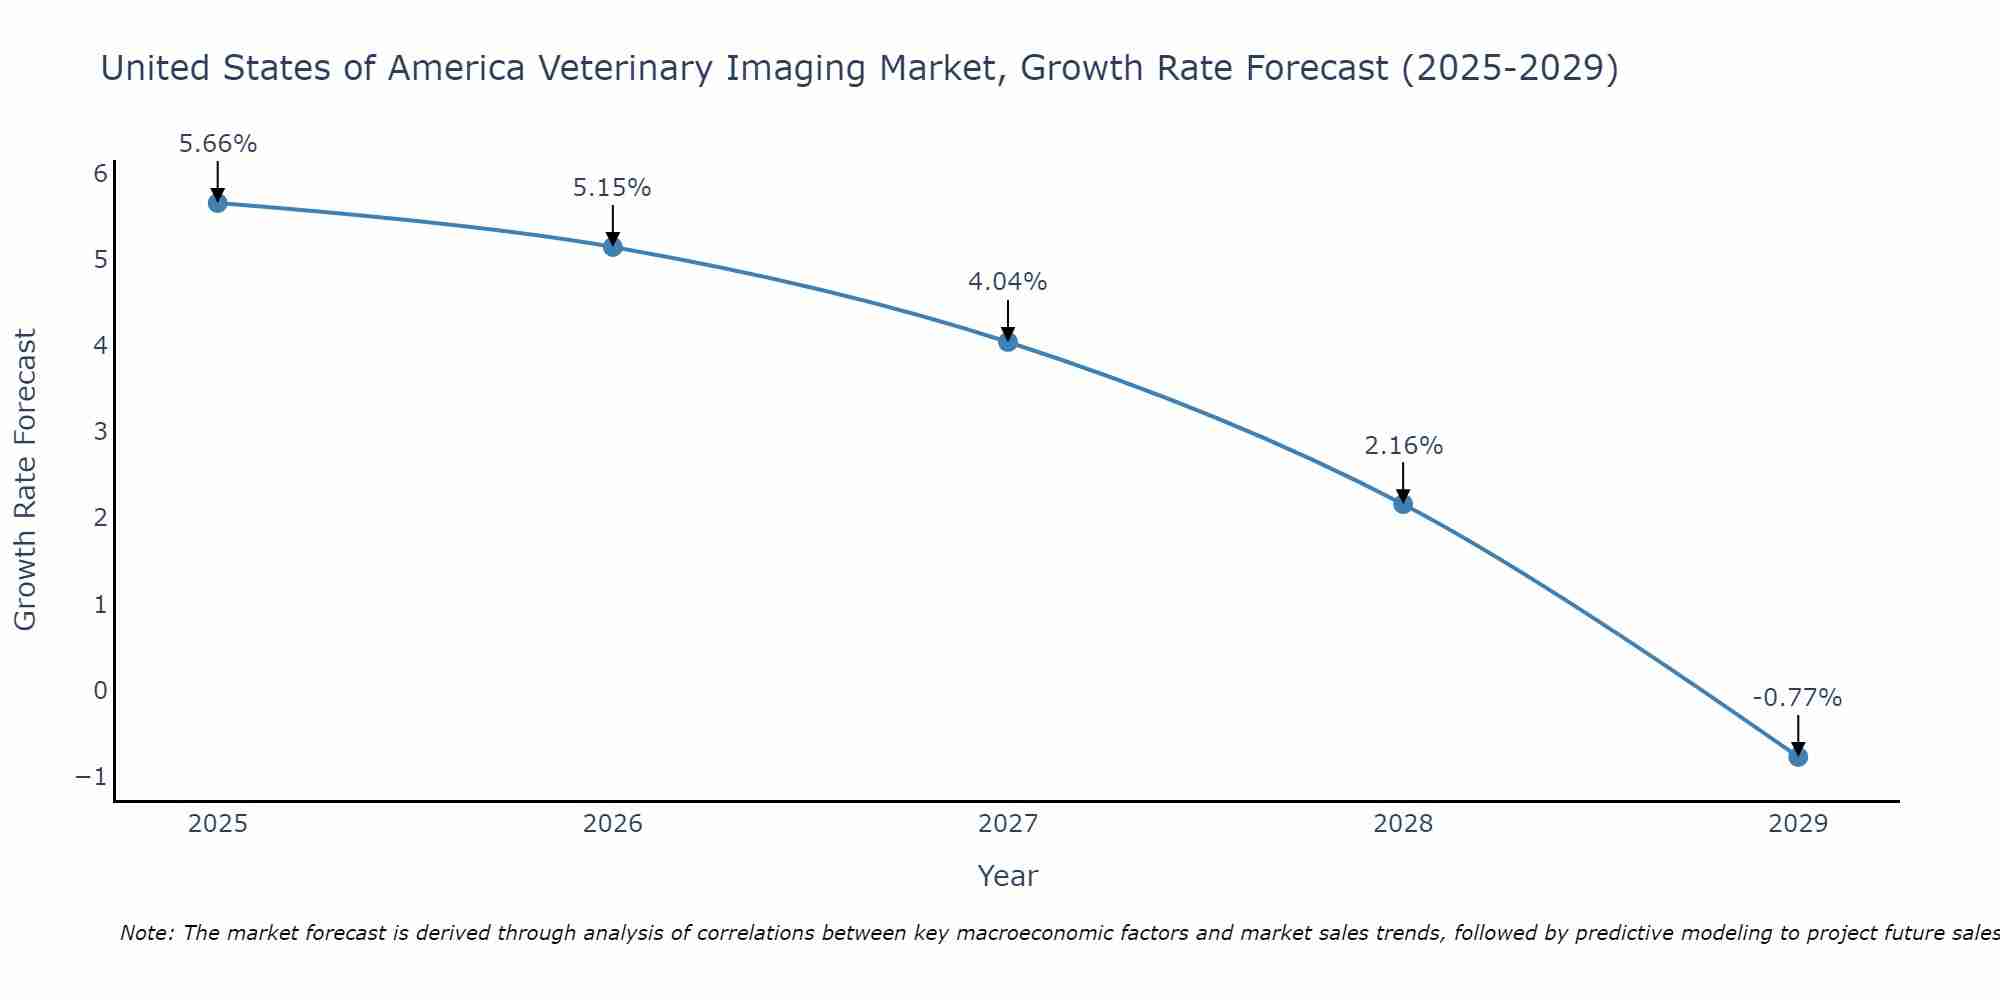
United States of America Veterinary Imaging Market Size Growth Rate
The United States of America Veterinary Imaging Market could see a tapering of growth rates over 2025 to 2029. Beginning strongly at 5.66% in 2025, growth softens to -0.77% in 2029.
United States (US) Veterinary Imaging Market Synopsis
The United States Veterinary Imaging Market is a rapidly growing sector driven by the increasing pet ownership, rising expenditure on animal healthcare, and advancements in imaging technologies. The market comprises various imaging modalities such as X-ray, ultrasound, MRI, CT scans, and others, utilized for diagnosing injuries, diseases, and monitoring the health of animals. With a strong focus on providing efficient and accurate diagnostic solutions for animals, the market is witnessing continuous innovation in imaging techniques and software. Key players in the US Veterinary Imaging Market include IDEXX Laboratories, Inc., Esaote S.p.A., Canon Inc., GE Healthcare, and others. The market is expected to expand further with the growing demand for high-quality veterinary care and the introduction of advanced imaging technologies tailored for animals.
United States (US) Veterinary Imaging Market Trends
The US Veterinary Imaging Market is experiencing several key trends. Firstly, there is a growing demand for advanced imaging modalities such as MRI and CT scans in veterinary care, driven by pet owners` increasing willingness to invest in their animals` health. Additionally, there is a shift towards portable and handheld imaging devices for greater convenience and mobility, particularly in rural areas or smaller veterinary clinics. Another trend is the integration of artificial intelligence and machine learning technologies into imaging systems, allowing for faster and more accurate diagnostics. Furthermore, there is an increasing focus on companion animal imaging, with a rise in specialized veterinary imaging centers catering specifically to pets. Overall, the US Veterinary Imaging Market is evolving towards more sophisticated, accessible, and tailored imaging solutions for improved animal healthcare.
United States (US) Veterinary Imaging Market Challenges
In the US Veterinary Imaging Market, challenges include the high cost of advanced imaging equipment, such as MRI and CT scanners, which can be a barrier for smaller veterinary practices in terms of investment and maintenance expenses. Another challenge is the need for specialized training and expertise to operate these complex imaging systems effectively, leading to a shortage of qualified personnel in some areas. Additionally, there is increasing competition among manufacturers and suppliers, which can make it challenging for veterinary clinics to choose the most suitable and cost-effective imaging solutions for their specific needs. Lastly, regulatory hurdles and compliance requirements also pose challenges for veterinary imaging facilities in ensuring adherence to standards and regulations while maintaining efficient operations.
United States (US) Veterinary Imaging Market Investment Opportunities
The United States Veterinary Imaging Market offers promising investment opportunities due to the increasing pet ownership rates and the growing demand for advanced diagnostic services in animal healthcare. Key areas for investment include advanced imaging modalities such as MRI, CT scans, and ultrasound machines tailored for veterinary use. Additionally, there is a rising trend towards the adoption of digital imaging technologies in veterinary clinics for enhanced accuracy and efficiency in diagnosing and treating animal ailments. Investing in companies that develop innovative veterinary imaging solutions, offer training and support services, or provide veterinary imaging equipment maintenance could yield significant returns in this expanding market. Overall, the US Veterinary Imaging Market presents a lucrative investment landscape driven by the evolving needs of pet owners and the continuous advancements in veterinary healthcare technology.
Jordan Agar Market Government Policies
Government policies related to the US Veterinary Imaging Market primarily focus on ensuring the safety and efficacy of imaging equipment used in veterinary practices. The Food and Drug Administration (FDA) regulates the approval and clearance of veterinary imaging devices to guarantee they meet established standards for quality and performance. Additionally, the US Department of Agriculture (USDA) may provide guidelines and regulations regarding the use of imaging technologies in livestock and agricultural settings to monitor animal health and welfare. Overall, these government policies aim to promote the proper use of veterinary imaging equipment, protect animal welfare, and ensure the accuracy of diagnostic procedures in the US Veterinary Imaging Market.
United States (US) Veterinary Imaging Market Future Outlook
The United States Veterinary Imaging Market is poised for steady growth in the foreseeable future, driven by factors such as increasing pet ownership, rising demand for advanced veterinary care, and technological advancements in imaging modalities. The market is expected to expand due to the growing awareness about the benefits of early disease detection and the importance of quality healthcare for animals. Additionally, the integration of artificial intelligence and machine learning in veterinary imaging systems is likely to enhance diagnostic accuracy and efficiency. With a focus on improving animal welfare and the overall health of pets, the US Veterinary Imaging Market is anticipated to experience sustained growth and innovation in the coming years.
Key Highlights of the Report:
- United States (US) Veterinary Imaging Market Outlook
- Market Size of United States (US) Veterinary Imaging Market, 2021
- Forecast of United States (US) Veterinary Imaging Market, 2031
- Historical Data and Forecast of United States (US) Veterinary Imaging Revenues & Volume for the Period 2018 - 2031
- United States (US) Veterinary Imaging Market Trend Evolution
- United States (US) Veterinary Imaging Market Drivers and Challenges
- United States (US) Veterinary Imaging Price Trends
- United States (US) Veterinary Imaging Porter's Five Forces
- United States (US) Veterinary Imaging Industry Life Cycle
- Historical Data and Forecast of United States (US) Veterinary Imaging Market Revenues & Volume By Product Type for the Period 2018 - 2031
- Historical Data and Forecast of United States (US) Veterinary Imaging Market Revenues & Volume By Veterinary Imaging Instruments for the Period 2018 - 2031
- Historical Data and Forecast of United States (US) Veterinary Imaging Market Revenues & Volume By Veterinary Software for the Period 2018 - 2031
- Historical Data and Forecast of United States (US) Veterinary Imaging Market Revenues & Volume By Veterinary Imaging Reagents for the Period 2018 - 2031
- Historical Data and Forecast of United States (US) Veterinary Imaging Market Revenues & Volume By Animal Type for the Period 2018 - 2031
- Historical Data and Forecast of United States (US) Veterinary Imaging Market Revenues & Volume By Small Companion Animals for the Period 2018 - 2031
- Historical Data and Forecast of United States (US) Veterinary Imaging Market Revenues & Volume By Large Animals for the Period 2018 - 2031
- Historical Data and Forecast of United States (US) Veterinary Imaging Market Revenues & Volume By Other Animals for the Period 2018 - 2031
- Historical Data and Forecast of United States (US) Veterinary Imaging Market Revenues & Volume By Application for the Period 2018 - 2031
- Historical Data and Forecast of United States (US) Veterinary Imaging Market Revenues & Volume By Orthopedics and Traumatology for the Period 2018 - 2031
- Historical Data and Forecast of United States (US) Veterinary Imaging Market Revenues & Volume By Oncology for the Period 2018 - 2031
- Historical Data and Forecast of United States (US) Veterinary Imaging Market Revenues & Volume By Cardiology for the Period 2018 - 2031
- Historical Data and Forecast of United States (US) Veterinary Imaging Market Revenues & Volume By Neurology for the Period 2018 - 2031
- Historical Data and Forecast of United States (US) Veterinary Imaging Market Revenues & Volume By Others for the Period 2018 - 2031
- Historical Data and Forecast of United States (US) Veterinary Imaging Market Revenues & Volume By End-use for the Period 2018 - 2031
- Historical Data and Forecast of United States (US) Veterinary Imaging Market Revenues & Volume By Hospitals for the Period 2018 - 2031
- Historical Data and Forecast of United States (US) Veterinary Imaging Market Revenues & Volume By Clinics for the Period 2018 - 2031
- Historical Data and Forecast of United States (US) Veterinary Imaging Market Revenues & Volume By Others for the Period 2018 - 2031
- United States (US) Veterinary Imaging Import Export Trade Statistics
- Market Opportunity Assessment By Product Type
- Market Opportunity Assessment By Animal Type
- Market Opportunity Assessment By Application
- Market Opportunity Assessment By End-use
- United States (US) Veterinary Imaging Top Companies Market Share
- United States (US) Veterinary Imaging Competitive Benchmarking By Technical and Operational Parameters
- United States (US) Veterinary Imaging Company Profiles
- United States (US) Veterinary Imaging Key Strategic Recommendations
Frequently Asked Questions About the Market Study (FAQs):
6Wresearch actively monitors the United States (US) Veterinary Imaging Market and publishes its comprehensive annual report, highlighting emerging trends, growth drivers, revenue analysis, and forecast outlook. Our insights help businesses to make data-backed strategic decisions with ongoing market dynamics. Our analysts track relevent industries related to the United States (US) Veterinary Imaging Market, allowing our clients with actionable intelligence and reliable forecasts tailored to emerging regional needs.
Yes, we provide customisation as per your requirements. To learn more, feel free to contact us on sales@6wresearch.com
1 Executive Summary |
2 Introduction |
2.1 Key Highlights of the Report |
2.2 Report Description |
2.3 Market Scope & Segmentation |
2.4 Research Methodology |
2.5 Assumptions |
3 United States (US) Veterinary Imaging Market Overview |
3.1 United States (US) Country Macro Economic Indicators |
3.2 United States (US) Veterinary Imaging Market Revenues & Volume, 2021 & 2031F |
3.3 United States (US) Veterinary Imaging Market - Industry Life Cycle |
3.4 United States (US) Veterinary Imaging Market - Porter's Five Forces |
3.5 United States (US) Veterinary Imaging Market Revenues & Volume Share, By Product Type, 2021 & 2031F |
3.6 United States (US) Veterinary Imaging Market Revenues & Volume Share, By Animal Type, 2021 & 2031F |
3.7 United States (US) Veterinary Imaging Market Revenues & Volume Share, By Application, 2021 & 2031F |
3.8 United States (US) Veterinary Imaging Market Revenues & Volume Share, By End-use, 2021 & 2031F |
4 United States (US) Veterinary Imaging Market Dynamics |
4.1 Impact Analysis |
4.2 Market Drivers |
4.2.1 Increasing pet ownership and humanization of pets leading to higher demand for veterinary services. |
4.2.2 Technological advancements in veterinary imaging equipment improving diagnostic capabilities and treatment outcomes. |
4.2.3 Growing awareness about animal health and preventive care among pet owners driving the need for veterinary imaging services. |
4.3 Market Restraints |
4.3.1 High cost associated with veterinary imaging equipment and procedures limiting adoption among small clinics and practices. |
4.3.2 Limited reimbursement options for veterinary imaging services impacting affordability for pet owners. |
4.3.3 Lack of standardized training and certification programs for veterinary imaging professionals hindering the quality of services provided. |
5 United States (US) Veterinary Imaging Market Trends |
6 United States (US) Veterinary Imaging Market, By Types |
6.1 United States (US) Veterinary Imaging Market, By Product Type |
6.1.1 Overview and Analysis |
6.1.2 United States (US) Veterinary Imaging Market Revenues & Volume, By Product Type, 2021-2031F |
6.1.3 United States (US) Veterinary Imaging Market Revenues & Volume, By Veterinary Imaging Instruments, 2021-2031F |
6.1.4 United States (US) Veterinary Imaging Market Revenues & Volume, By Veterinary Software, 2021-2031F |
6.1.5 United States (US) Veterinary Imaging Market Revenues & Volume, By Veterinary Imaging Reagents, 2021-2031F |
6.2 United States (US) Veterinary Imaging Market, By Animal Type |
6.2.1 Overview and Analysis |
6.2.2 United States (US) Veterinary Imaging Market Revenues & Volume, By Small Companion Animals, 2021-2031F |
6.2.3 United States (US) Veterinary Imaging Market Revenues & Volume, By Large Animals, 2021-2031F |
6.2.4 United States (US) Veterinary Imaging Market Revenues & Volume, By Other Animals, 2021-2031F |
6.3 United States (US) Veterinary Imaging Market, By Application |
6.3.1 Overview and Analysis |
6.3.2 United States (US) Veterinary Imaging Market Revenues & Volume, By Orthopedics and Traumatology, 2021-2031F |
6.3.3 United States (US) Veterinary Imaging Market Revenues & Volume, By Oncology, 2021-2031F |
6.3.4 United States (US) Veterinary Imaging Market Revenues & Volume, By Cardiology, 2021-2031F |
6.3.5 United States (US) Veterinary Imaging Market Revenues & Volume, By Neurology, 2021-2031F |
6.3.6 United States (US) Veterinary Imaging Market Revenues & Volume, By Others, 2021-2031F |
6.4 United States (US) Veterinary Imaging Market, By End-use |
6.4.1 Overview and Analysis |
6.4.2 United States (US) Veterinary Imaging Market Revenues & Volume, By Hospitals, 2021-2031F |
6.4.3 United States (US) Veterinary Imaging Market Revenues & Volume, By Clinics, 2021-2031F |
6.4.4 United States (US) Veterinary Imaging Market Revenues & Volume, By Others, 2021-2031F |
7 United States (US) Veterinary Imaging Market Import-Export Trade Statistics |
7.1 United States (US) Veterinary Imaging Market Export to Major Countries |
7.2 United States (US) Veterinary Imaging Market Imports from Major Countries |
8 United States (US) Veterinary Imaging Market Key Performance Indicators |
8.1 Average number of veterinary imaging procedures per clinic per month. |
8.2 Adoption rate of advanced veterinary imaging technologies in clinics and hospitals. |
8.3 Percentage of pet owners opting for preventive veterinary imaging services. |
8.4 Average wait time for veterinary imaging appointments. |
8.5 Rate of referrals to specialty veterinary imaging centers. |
9 United States (US) Veterinary Imaging Market - Opportunity Assessment |
9.1 United States (US) Veterinary Imaging Market Opportunity Assessment, By Product Type, 2021 & 2031F |
9.2 United States (US) Veterinary Imaging Market Opportunity Assessment, By Animal Type, 2021 & 2031F |
9.3 United States (US) Veterinary Imaging Market Opportunity Assessment, By Application, 2021 & 2031F |
9.4 United States (US) Veterinary Imaging Market Opportunity Assessment, By End-use, 2021 & 2031F |
10 United States (US) Veterinary Imaging Market - Competitive Landscape |
10.1 United States (US) Veterinary Imaging Market Revenue Share, By Companies, 2021 |
10.2 United States (US) Veterinary Imaging Market Competitive Benchmarking, By Operating and Technical Parameters |
11 Company Profiles |
12 Recommendations |
13 Disclaimer |
Global Go To Market Strategy - 2030
Export potential enables firms to identify high-growth global markets with greater confidence by combining advanced trade intelligence with a structured quantitative methodology. The framework analyzes emerging demand trends and country-level import patterns while integrating macroeconomic and trade datasets such as GDP and population forecasts, bilateral import–export flows, tariff structures, elasticity differentials between developed and developing economies, geographic distance, and import demand projections. Using weighted trade values from 2020–2024 as the base period to project country-to-country export potential for 2030, these inputs are operationalized through calculated drivers such as gravity model parameters, tariff impact factors, and projected GDP per-capita growth. Through an analysis of hidden potentials, demand hotspots, and market conditions that are most favorable to success, this method enables firms to focus on target countries, maximize returns, and global expansion with data, backed by accuracy.
By factoring in the projected importer demand gap that is currently unmet and could be potential opportunity, it identifies the potential for the Exporter (Country) among 190 countries, against the general trade analysis, which identifies the biggest importer or exporter.
To discover high-growth global markets and optimize your business strategy:
Click Here
Pricing
- Single User License$ 1,995
- Department License$ 2,400
- Site License$ 3,120
- Global License$ 3,795

Leadership Perspectives from Industry Events
Search
Thought Leadership and Analyst Meet


Our Clients
6WResearch In News
- India Air Conditioner Market Set for Strong Rebound in 2026 After Weather-Led Correction and GST-Driven Recovery: 6Wresearch
- ADAS in India: How Automatic Emergency Braking, Blind Spot Detection & Driver Monitoring are Transforming Road Safety
- Doha a strategic location for EV manufacturing hub: IPA Qatar
- Demand for luxury TVs surging in the GCC, says Samsung
- Empowering Growth: The Thriving Journey of Bangladesh’s Cable Industry
- Demand for luxury TVs surging in the GCC, says Samsung
Latest Reports
- Nicaragua RPG Gaming Market (2026-2032)
- New Zealand RPG Gaming Market (2026-2032)
- Netherlands RPG Gaming Market (2026-2032)
- Nauru RPG Gaming Market (2026-2032)
- Namibia RPG Gaming Market (2026-2032)
- Mozambique RPG Gaming Market (2026-2032)
- Montenegro RPG Gaming Market (2026-2032)
- Mongolia RPG Gaming Market (2026-2032)
- Monaco RPG Gaming Market (2026-2032)
- Micronesia RPG Gaming Market (2026-2032)
Industry Events and Analyst Meet

EV India Expo 2026

HIMTEX 2026

India Refining Summit 2026

India EV Show 2026

EV tech India Expo 2026
Whitepaper
- Middle East & Africa Commercial Security Market Click here to view more.
- Middle East & Africa Fire Safety Systems & Equipment Market Click here to view more.
- GCC Drone Market Click here to view more.
- Middle East Lighting Fixture Market Click here to view more.
- GCC Physical & Perimeter Security Market Click here to view more.