Uruguay Dairy Snacks Market (2026-2032) | Forecast, Industry, Trends, Size & Revenue, Competitive Landscape, Companies, Outlook, Segmentation, Analysis, Growth, Value, Share
Market Forecast By Type (Cheese, Yogurt, Ice Cream, Others), By Nature (Organic, Conventional), By Distribution Channel (Supermarkets, Hypermarkets, Convenience Stores, Specialty Stores, Others), By End Use (HoReCa, Foods and Beverages Industry) And Competitive Landscape
| Product Code: ETC9985539 | Publication Date: Sep 2024 | Updated Date: Feb 2026 | Product Type: Market Research Report | |
| Publisher: 6Wresearch | Author: Vasudha | No. of Pages: 75 | No. of Figures: 35 | No. of Tables: 20 |
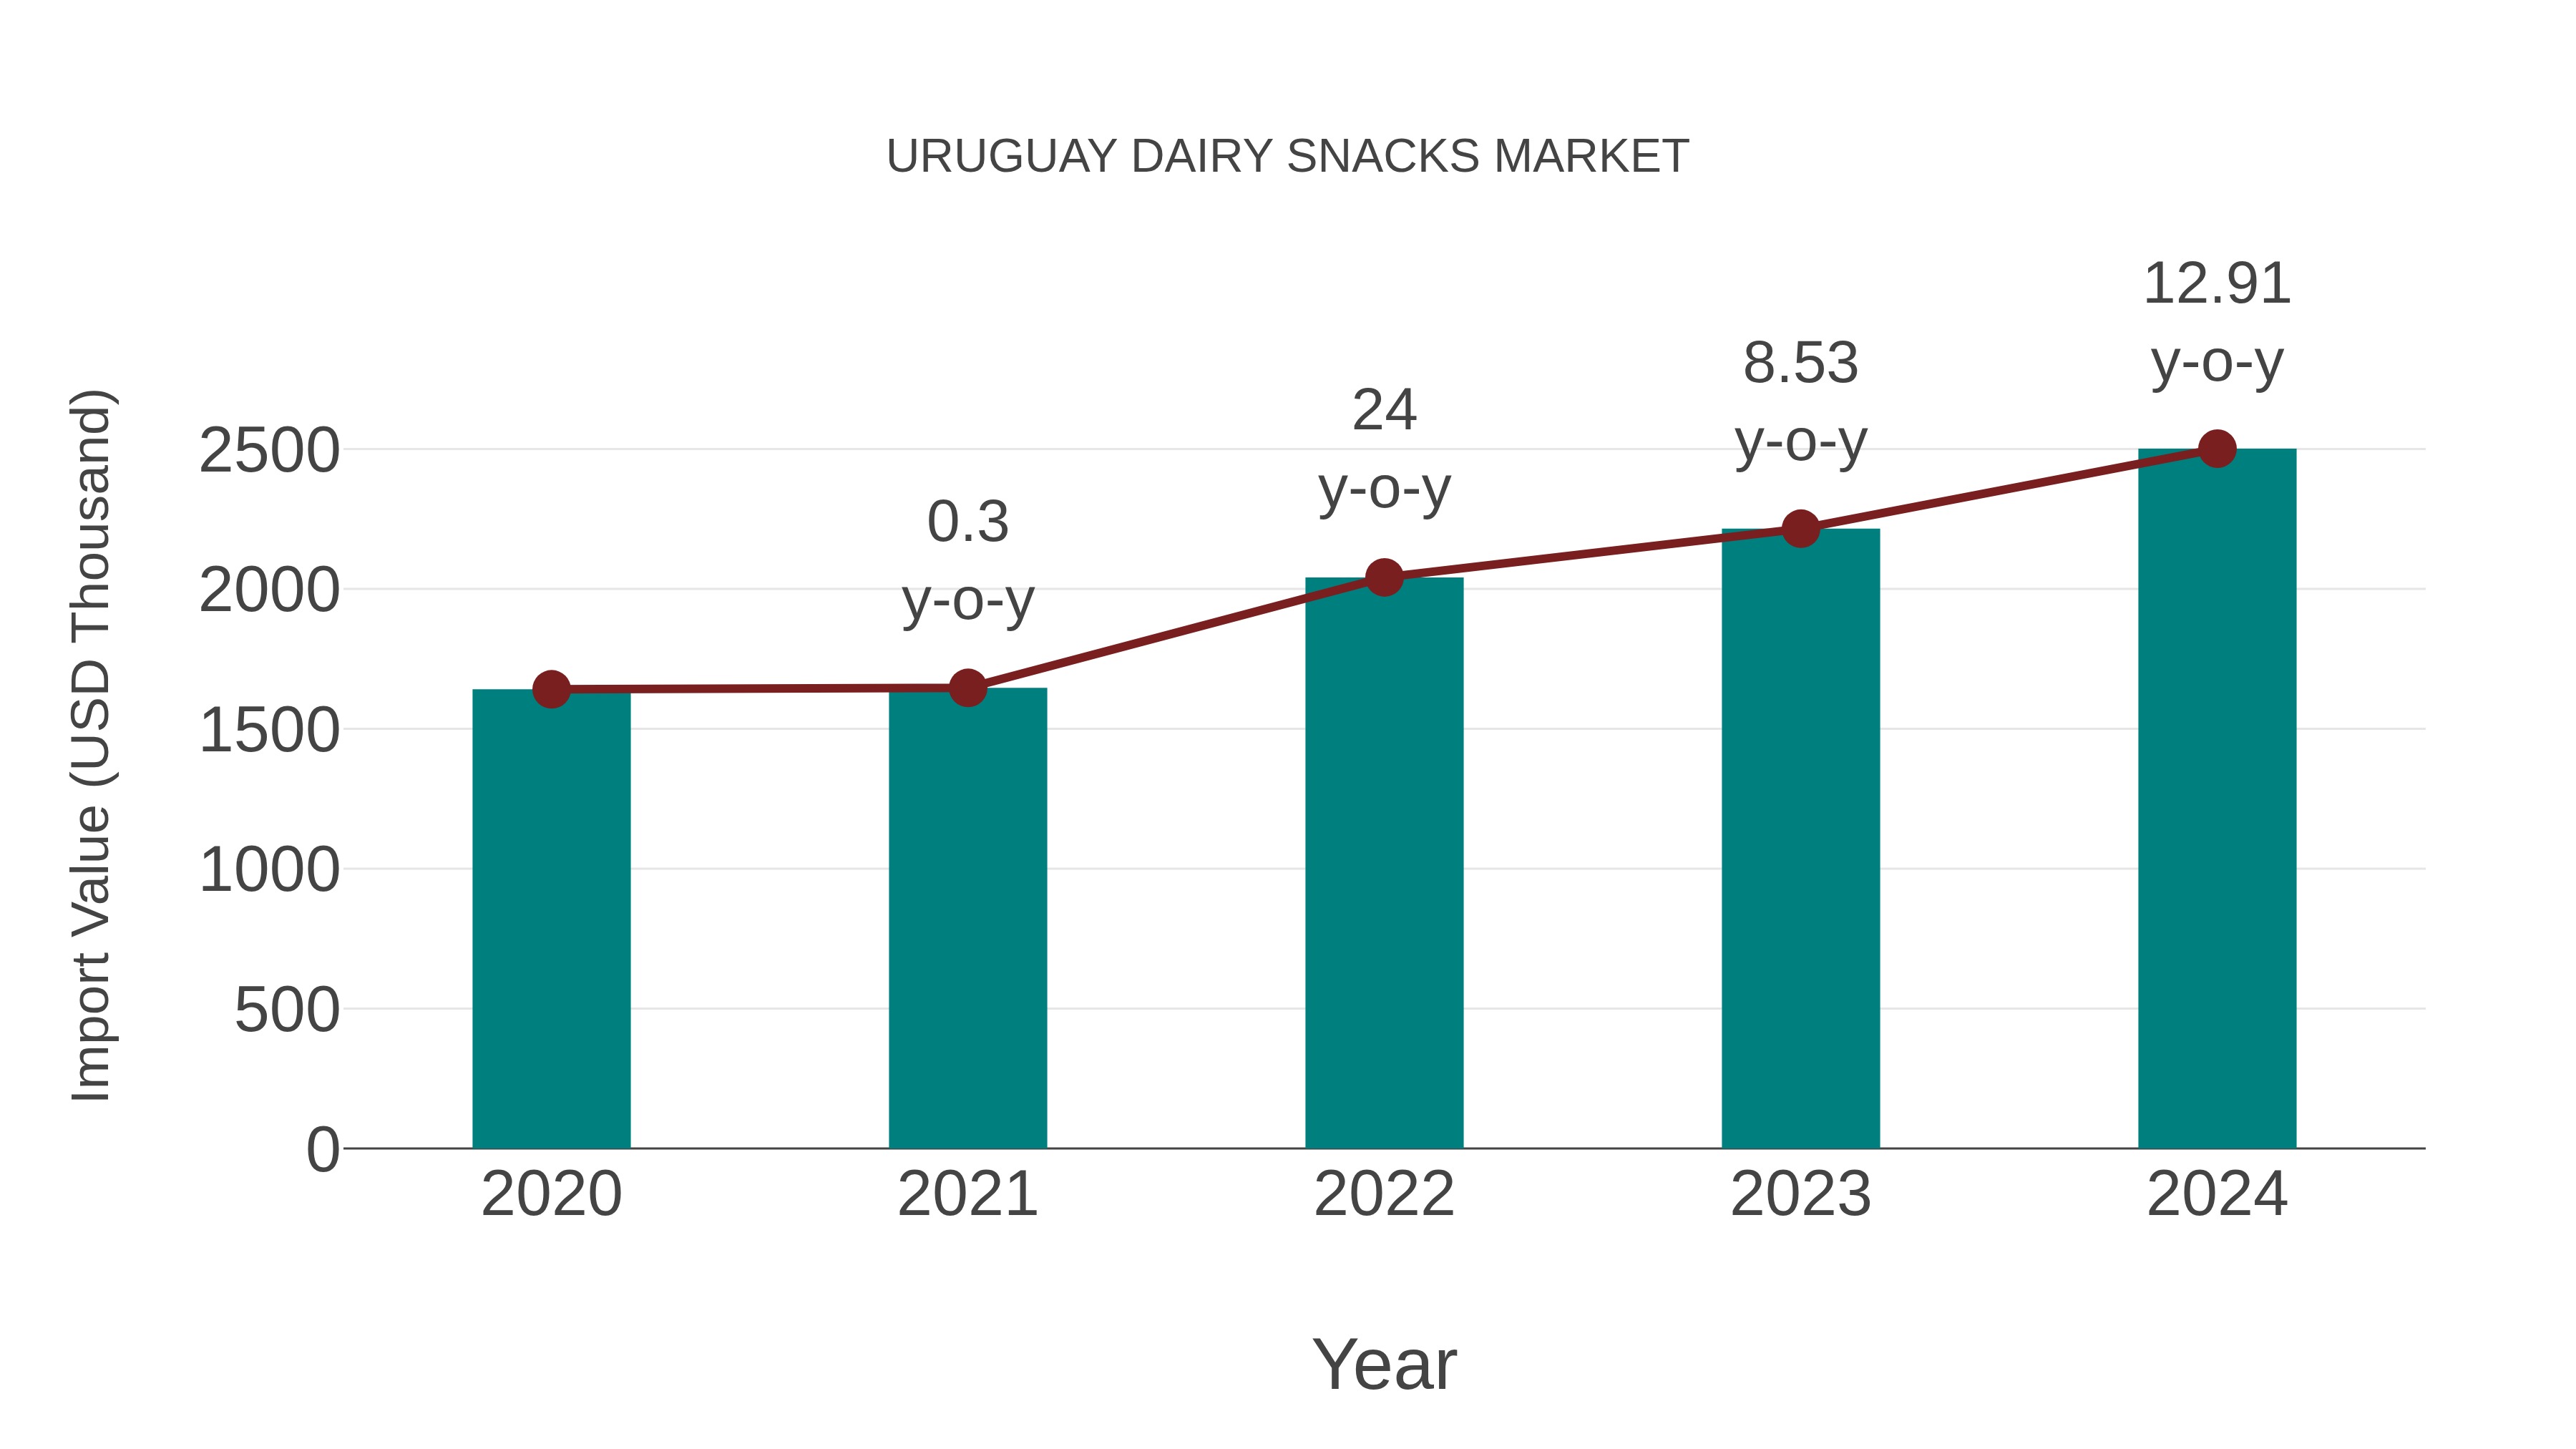
Uruguay Dairy Snacks Market: Import Trend Analysis
In the past year, the import trend for dairy snacks in the Uruguay market experienced a steady increase. This was driven by a growing consumer preference for a wider variety of dairy snack options, including yogurt-based snacks and cheese snacks. The market saw a notable rise in imported dairy snack products from various international suppliers.
Key Highlights of the Report:
- Uruguay Dairy Snacks Market Outlook
- Market Size of Uruguay Dairy Snacks Market, 2025
- Forecast of Uruguay Dairy Snacks Market, 2032
- Historical Data and Forecast of Uruguay Dairy Snacks Revenues & Volume for the Period 2022-2032F
- Uruguay Dairy Snacks Market Trend Evolution
- Uruguay Dairy Snacks Market Drivers and Challenges
- Uruguay Dairy Snacks Price Trends
- Uruguay Dairy Snacks Porter's Five Forces
- Uruguay Dairy Snacks Industry Life Cycle
- Historical Data and Forecast of Uruguay Dairy Snacks Market Revenues & Volume By Type for the Period 2022-2032F
- Historical Data and Forecast of Uruguay Dairy Snacks Market Revenues & Volume By Cheese for the Period 2022-2032F
- Historical Data and Forecast of Uruguay Dairy Snacks Market Revenues & Volume By Yogurt for the Period 2022-2032F
- Historical Data and Forecast of Uruguay Dairy Snacks Market Revenues & Volume By Ice Cream for the Period 2022-2032F
- Historical Data and Forecast of Uruguay Dairy Snacks Market Revenues & Volume By Others for the Period 2022-2032F
- Historical Data and Forecast of Uruguay Dairy Snacks Market Revenues & Volume By Nature for the Period 2022-2032F
- Historical Data and Forecast of Uruguay Dairy Snacks Market Revenues & Volume By Organic for the Period 2022-2032F
- Historical Data and Forecast of Uruguay Dairy Snacks Market Revenues & Volume By Conventional for the Period 2022-2032F
- Historical Data and Forecast of Uruguay Dairy Snacks Market Revenues & Volume By Distribution Channel for the Period 2022-2032F
- Historical Data and Forecast of Uruguay Dairy Snacks Market Revenues & Volume By Supermarkets for the Period 2022-2032F
- Historical Data and Forecast of Uruguay Dairy Snacks Market Revenues & Volume By Hypermarkets for the Period 2022-2032F
- Historical Data and Forecast of Uruguay Dairy Snacks Market Revenues & Volume By Convenience Stores for the Period 2022-2032F
- Historical Data and Forecast of Uruguay Dairy Snacks Market Revenues & Volume By Specialty Stores for the Period 2022-2032F
- Historical Data and Forecast of Uruguay Dairy Snacks Market Revenues & Volume By Others for the Period 2022-2032F
- Historical Data and Forecast of Uruguay Dairy Snacks Market Revenues & Volume By End Use for the Period 2022-2032F
- Historical Data and Forecast of Uruguay Dairy Snacks Market Revenues & Volume By HoReCa for the Period 2022-2032F
- Historical Data and Forecast of Uruguay Dairy Snacks Market Revenues & Volume By Foods and Beverages Industry for the Period 2022-2032F
- Uruguay Dairy Snacks Import Export Trade Statistics
- Market Opportunity Assessment By Type
- Market Opportunity Assessment By Nature
- Market Opportunity Assessment By Distribution Channel
- Market Opportunity Assessment By End Use
- Uruguay Dairy Snacks Top Companies Market Share
- Uruguay Dairy Snacks Competitive Benchmarking By Technical and Operational Parameters
- Uruguay Dairy Snacks Company Profiles
- Uruguay Dairy Snacks Key Strategic Recommendations
Frequently Asked Questions About the Market Study (FAQs):
6Wresearch actively monitors the Uruguay Dairy Snacks Market and publishes its comprehensive annual report, highlighting emerging trends, growth drivers, revenue analysis, and forecast outlook. Our insights help businesses to make data-backed strategic decisions with ongoing market dynamics. Our analysts track relevent industries related to the Uruguay Dairy Snacks Market, allowing our clients with actionable intelligence and reliable forecasts tailored to emerging regional needs.
Yes, we provide customisation as per your requirements. To learn more, feel free to contact us on sales@6wresearch.com
1 Executive Summary |
2 Introduction |
2.1 Key Highlights of the Report |
2.2 Report Description |
2.3 Market Scope & Segmentation |
2.4 Research Methodology |
2.5 Assumptions |
3 Uruguay Dairy Snacks Market Overview |
3.1 Uruguay Country Macro Economic Indicators |
3.2 Uruguay Dairy Snacks Market Revenues & Volume, 2022 & 2032F |
3.3 Uruguay Dairy Snacks Market - Industry Life Cycle |
3.4 Uruguay Dairy Snacks Market - Porter's Five Forces |
3.5 Uruguay Dairy Snacks Market Revenues & Volume Share, By Type, 2022 & 2032F |
3.6 Uruguay Dairy Snacks Market Revenues & Volume Share, By Nature, 2022 & 2032F |
3.7 Uruguay Dairy Snacks Market Revenues & Volume Share, By Distribution Channel, 2022 & 2032F |
3.8 Uruguay Dairy Snacks Market Revenues & Volume Share, By End Use, 2022 & 2032F |
4 Uruguay Dairy Snacks Market Dynamics |
4.1 Impact Analysis |
4.2 Market Drivers |
4.2.1 Growing health consciousness among consumers leading to increased demand for healthier snack options. |
4.2.2 Rising disposable income levels driving the consumption of premium dairy snack products. |
4.2.3 Increasing urbanization and changing lifestyles leading to higher demand for convenient and on-the-go snack options. |
4.2.4 Innovation in flavors and product varieties attracting consumers towards dairy snacks. |
4.2.5 Expansion of retail channels and e-commerce facilitating easier access to dairy snack products. |
4.3 Market Restraints |
4.3.1 Price volatility of raw materials impacting production costs and pricing of dairy snacks. |
4.3.2 Intense competition from other snack categories such as confectionery, savory snacks, and alternative healthy snacks. |
4.3.3 Regulatory challenges related to food safety standards and labeling requirements affecting market entry and product positioning. |
4.3.4 Seasonality of dairy production impacting the availability and pricing of dairy snack products. |
4.3.5 Consumer perception of dairy snacks as less healthy compared to other snack options affecting market penetration. |
5 Uruguay Dairy Snacks Market Trends |
6 Uruguay Dairy Snacks Market, By Types |
6.1 Uruguay Dairy Snacks Market, By Type |
6.1.1 Overview and Analysis |
6.1.2 Uruguay Dairy Snacks Market Revenues & Volume, By Type, 2022-2032F |
6.1.3 Uruguay Dairy Snacks Market Revenues & Volume, By Cheese, 2022-2032F |
6.1.4 Uruguay Dairy Snacks Market Revenues & Volume, By Yogurt, 2022-2032F |
6.1.5 Uruguay Dairy Snacks Market Revenues & Volume, By Ice Cream, 2022-2032F |
6.1.6 Uruguay Dairy Snacks Market Revenues & Volume, By Others, 2022-2032F |
6.2 Uruguay Dairy Snacks Market, By Nature |
6.2.1 Overview and Analysis |
6.2.2 Uruguay Dairy Snacks Market Revenues & Volume, By Organic, 2022-2032F |
6.2.3 Uruguay Dairy Snacks Market Revenues & Volume, By Conventional, 2022-2032F |
6.3 Uruguay Dairy Snacks Market, By Distribution Channel |
6.3.1 Overview and Analysis |
6.3.2 Uruguay Dairy Snacks Market Revenues & Volume, By Supermarkets, 2022-2032F |
6.3.3 Uruguay Dairy Snacks Market Revenues & Volume, By Hypermarkets, 2022-2032F |
6.3.4 Uruguay Dairy Snacks Market Revenues & Volume, By Convenience Stores, 2022-2032F |
6.3.5 Uruguay Dairy Snacks Market Revenues & Volume, By Specialty Stores, 2022-2032F |
6.3.6 Uruguay Dairy Snacks Market Revenues & Volume, By Others, 2022-2032F |
6.4 Uruguay Dairy Snacks Market, By End Use |
6.4.1 Overview and Analysis |
6.4.2 Uruguay Dairy Snacks Market Revenues & Volume, By HoReCa, 2022-2032F |
6.4.3 Uruguay Dairy Snacks Market Revenues & Volume, By Foods and Beverages Industry, 2022-2032F |
7 Uruguay Dairy Snacks Market Import-Export Trade Statistics |
7.1 Uruguay Dairy Snacks Market Export to Major Countries |
7.2 Uruguay Dairy Snacks Market Imports from Major Countries |
8 Uruguay Dairy Snacks Market Key Performance Indicators |
8.1 Consumer engagement metrics such as social media interactions, online reviews, and brand sentiment analysis. |
8.2 Product innovation rate measured by the number of new product launches and customer acceptance rates. |
8.3 Distribution channel expansion metrics including the number of new retail partnerships and growth in e-commerce sales. |
8.4 Consumer loyalty and repeat purchase rates indicating the acceptance and satisfaction level with dairy snack products. |
8.5 Health and wellness trend adoption metrics tracking the demand for low-fat, high-protein, and organic dairy snack variants. |
9 Uruguay Dairy Snacks Market - Opportunity Assessment |
9.1 Uruguay Dairy Snacks Market Opportunity Assessment, By Type, 2022 & 2032F |
9.2 Uruguay Dairy Snacks Market Opportunity Assessment, By Nature, 2022 & 2032F |
9.3 Uruguay Dairy Snacks Market Opportunity Assessment, By Distribution Channel, 2022 & 2032F |
9.4 Uruguay Dairy Snacks Market Opportunity Assessment, By End Use, 2022 & 2032F |
10 Uruguay Dairy Snacks Market - Competitive Landscape |
10.1 Uruguay Dairy Snacks Market Revenue Share, By Companies, 2025 |
10.2 Uruguay Dairy Snacks Market Competitive Benchmarking, By Operating and Technical Parameters |
11 Company Profiles |
12 Recommendations |
13 Disclaimer |
Global Go To Market Strategy - 2030
Export potential enables firms to identify high-growth global markets with greater confidence by combining advanced trade intelligence with a structured quantitative methodology. The framework analyzes emerging demand trends and country-level import patterns while integrating macroeconomic and trade datasets such as GDP and population forecasts, bilateral import–export flows, tariff structures, elasticity differentials between developed and developing economies, geographic distance, and import demand projections. Using weighted trade values from 2020–2024 as the base period to project country-to-country export potential for 2030, these inputs are operationalized through calculated drivers such as gravity model parameters, tariff impact factors, and projected GDP per-capita growth. Through an analysis of hidden potentials, demand hotspots, and market conditions that are most favorable to success, this method enables firms to focus on target countries, maximize returns, and global expansion with data, backed by accuracy.
By factoring in the projected importer demand gap that is currently unmet and could be potential opportunity, it identifies the potential for the Exporter (Country) among 190 countries, against the general trade analysis, which identifies the biggest importer or exporter.
To discover high-growth global markets and optimize your business strategy:
Click Here
Pricing
- Single User License$ 1,995
- Department License$ 2,400
- Site License$ 3,120
- Global License$ 3,795

Leadership Perspectives from Industry Events
Search
Thought Leadership and Analyst Meet


Our Clients
6WResearch In News
- Doha a strategic location for EV manufacturing hub: IPA Qatar
- Demand for luxury TVs surging in the GCC, says Samsung
- Empowering Growth: The Thriving Journey of Bangladesh’s Cable Industry
- Demand for luxury TVs surging in the GCC, says Samsung
- Video call with a traditional healer? Once unthinkable, it’s now common in South Africa
- Intelligent Buildings To Smooth GCC’s Path To Net Zero
Latest Reports
- New Zealand Aseptic Manufacturing Market (2026-2032)
- Netherlands Aseptic Manufacturing Market (2026-2032)
- Nauru Aseptic Manufacturing Market (2026-2032)
- Namibia Aseptic Manufacturing Market (2026-2032)
- Mozambique Aseptic Manufacturing Market (2026-2032)
- Montenegro Aseptic Manufacturing Market (2026-2032)
- Mongolia Aseptic Manufacturing Market (2026-2032)
- Monaco Aseptic Manufacturing Market (2026-2032)
- Micronesia Aseptic Manufacturing Market (2026-2032)
- Mauritius Aseptic Manufacturing Market (2026-2032)
Industry Events and Analyst Meet

HIMTEX 2026

India Refining Summit 2026

India EV Show 2026

EV tech India Expo 2026

Auto Tech Asia 2026
Whitepaper
- Middle East & Africa Commercial Security Market Click here to view more.
- Middle East & Africa Fire Safety Systems & Equipment Market Click here to view more.
- GCC Drone Market Click here to view more.
- Middle East Lighting Fixture Market Click here to view more.
- GCC Physical & Perimeter Security Market Click here to view more.