Venezuela Flavored Water Market (2026-2032) Outlook | Revenue, Value, Industry, Share, Companies, Analysis, Size, Trends, Forecast & Growth
Market Forecast By Type (Carbonated, Still), By Packaging type (Bottles, Cans, others), By Distribution Channel (Store-Based, Non-Store-Based) And Competitive Landscape
| Product Code: ETC094226 | Publication Date: Jun 2021 | Updated Date: Jun 2026 | Product Type: Report | |
| Publisher: 6Wresearch | Author: Sachin Kumar Rai | No. of Pages: 70 | No. of Figures: 35 | No. of Tables: 5 |
Venezuela Flavored Water Market Size, Share & Growth Rate
The Venezuela Flavored Water Market was estimated at USD 248 Million in 2025 and is projected to reach USD 334 Million by 2032, growing at a CAGR of 4.3% from 2026 to 2032. This growth trajectory is primarily fueled by an increasing consumer inclination toward healthier beverage alternatives amidst rising health consciousness and the desire for innovative hydration options. Furthermore, the expansion of flavored water availability across various retail channels is propelling market accessibility and consumer adoption.
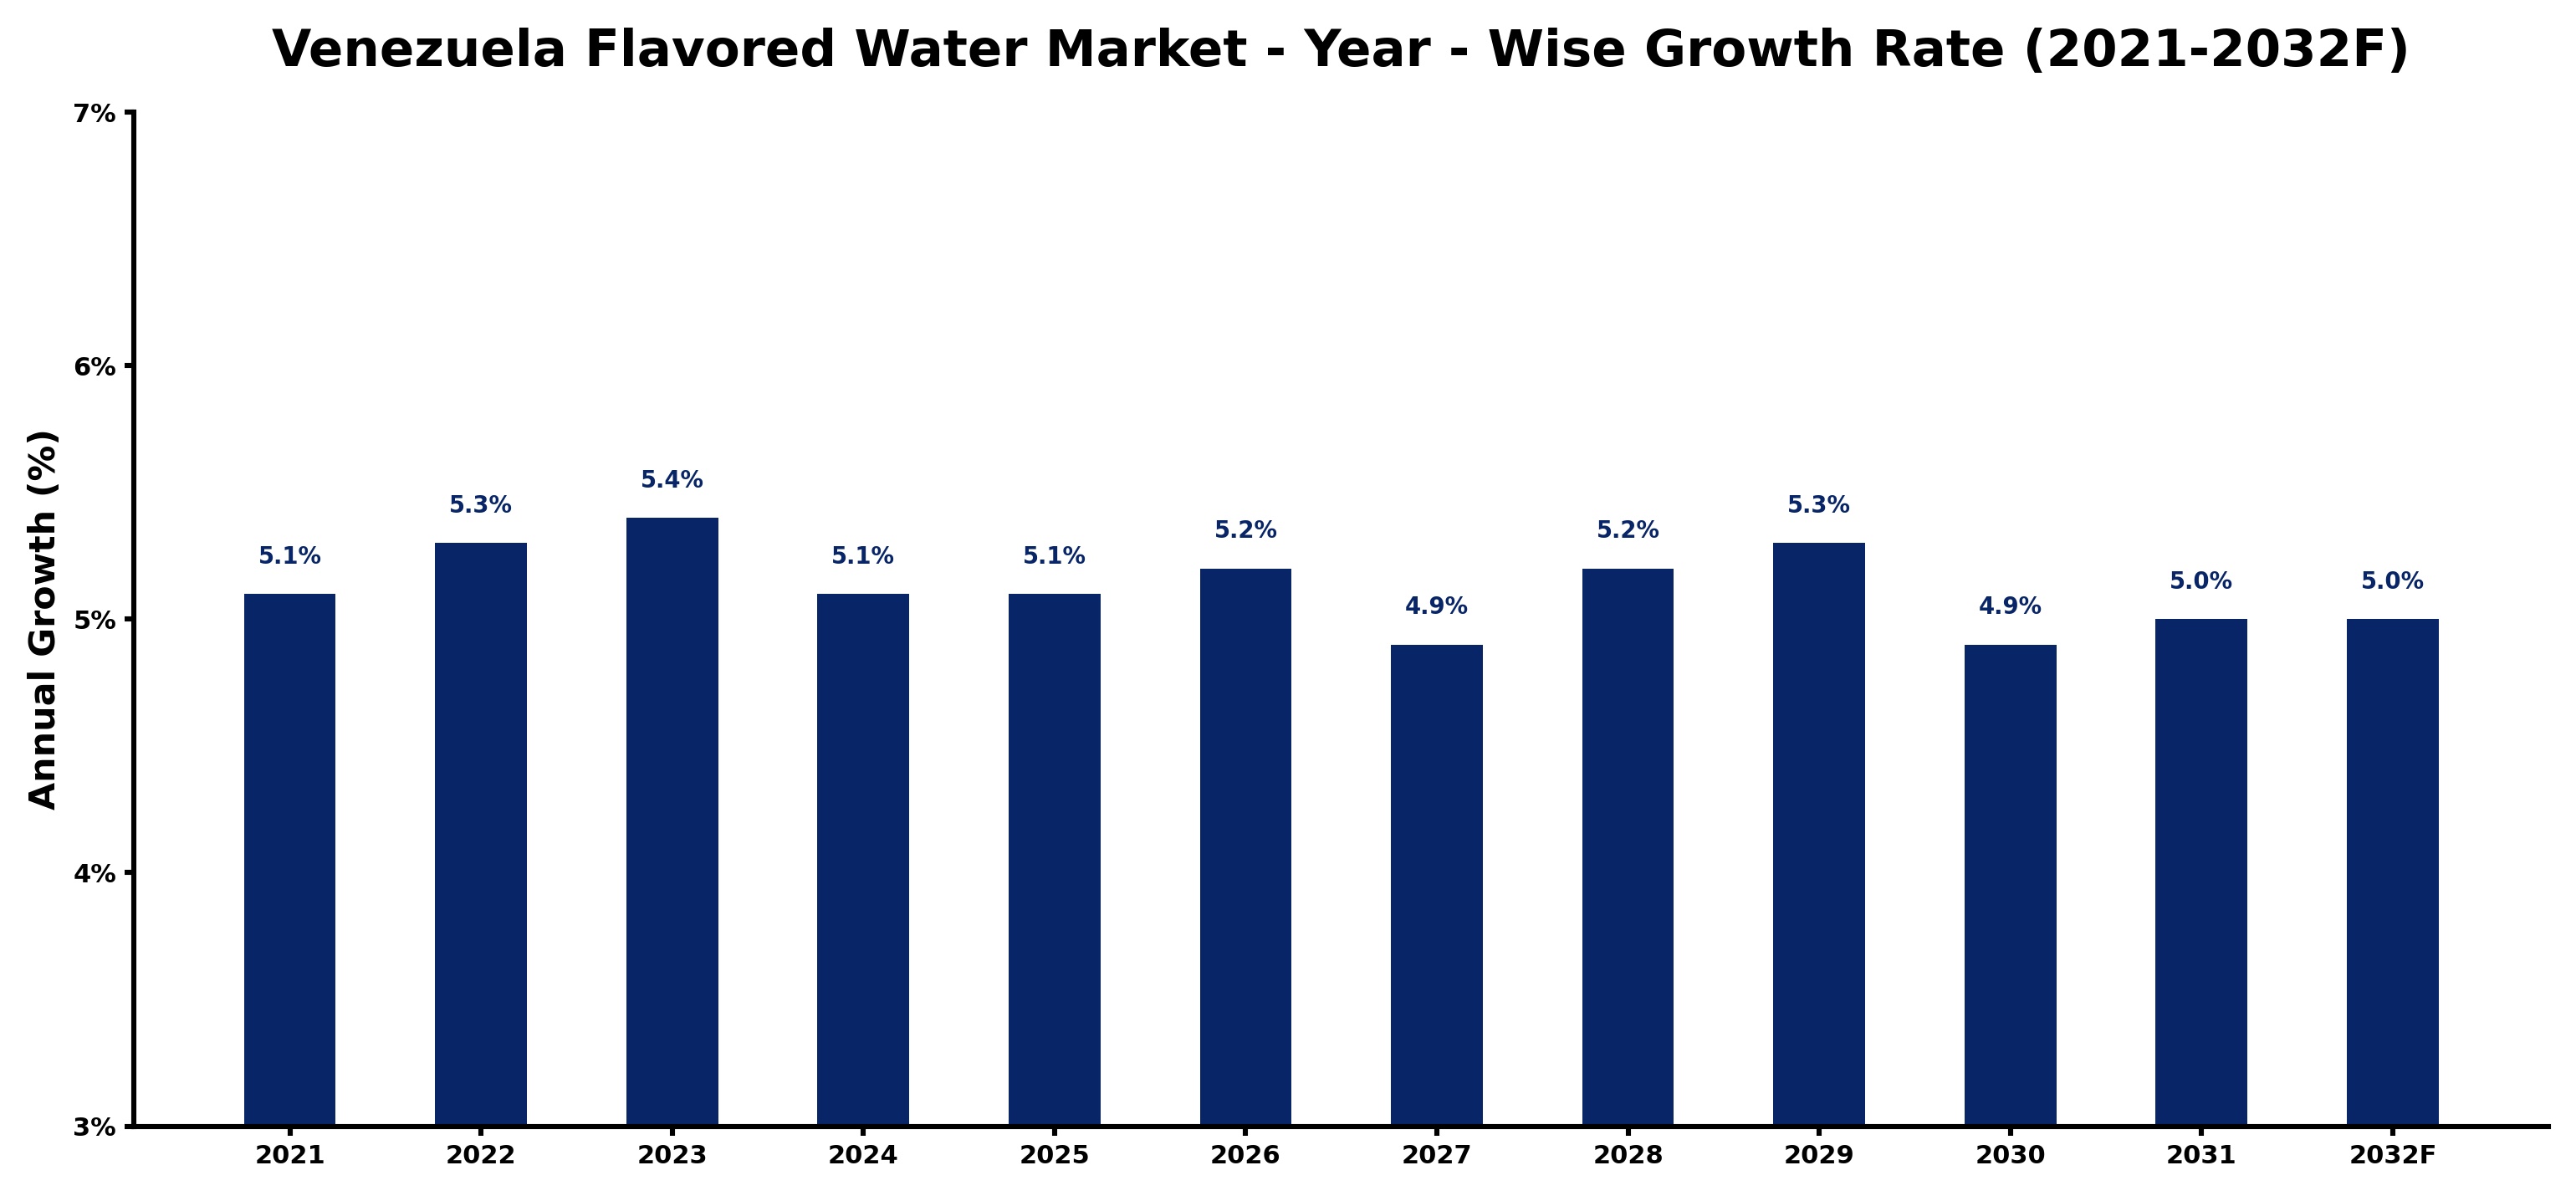
Venezuela Flavored Water Market Growth Rate Analysis (2021-2032)
The Venezuelan flavored water market exhibits a stable growth pattern, with annual increases of 5.1% in 2021 and 2024, followed by slight upticks to 5.3% in 2022 and 2029, indicating a resilient consumer preference for healthier beverage alternatives amidst economic challenges. The growth in 2023 reached 5.4%, attributed to improved production techniques and a surge in urbanization, which has fostered an inclination towards convenient, flavored hydration options. Although projections suggest occasional dips, such as 4.9% in 2027 and 2030 due to fluctuating raw material costs, the market remains buoyed by ongoing investments in distribution infrastructure and consumer demand for innovative flavors, ensuring sustained expansion through 2032.
Venezuela Flavored Water Market Year-wise Growth Rate and Key Drivers
This graph highlights how the Venezuela Flavored Water Market has steadily grown over the past five years, supported by major growth factors.
The table below presents the year‑wise growth rates along with the key drivers influencing the market
| Year | Growth Rate | Major Drivers |
| 2021 | 5.1% | Smart bottling technologies streamline flavored water production processes |
| 2022 | 5.3% | Flavored water production aligns with consumer health and wellness trends |
| 2023 | 5.4% | Local beverage firms invest in advanced filtration technologies production |
| 2024 | 5.1% | Local sourcing initiatives boosted flavored water ingredient production capacity |
| 2025 | 5.1% | Local bottling facilities optimized processes for flavored water production |
| 2026 | 5.2% | Export driven flavored water demand boosts local bottling plant investments |
| 2027 | 4.9% | Higher flavored water production capacity drives bottling equipment investments |
| 2028 | 5.2% | Local sourcing of ingredients boosted flavored water production efficiency |
| 2029 | 5.3% | Flavored water brands invest in eco friendly packaging technologies |
| 2030 | 4.9% | Flavored water brands expand bottling facilities to boost production capacity |
| 2031 | 5.0% | Higher bottling line efficiency boosted flavored water production capacity |
| 2032 | 5.0% | Flavored water manufacturers invest in advanced bottling technology systems |
Note - Market size estimations and growth projections presented in this report are based on 6Wresearch’s advanced forecasting approach, validated with industry datasets as of June 2026.
Venezuela Flavored Water Market Synopsis
As consumers become more health-conscious, the demand for flavored water that is free from artificial additives is rising significantly in Venezuela. This trend is coupled with a growing preference for beverages that offer not only hydration but also added health benefits, such as vitamins and antioxidants.
Distribution channels are evolving, with flavored water increasingly available in supermarkets, convenience stores, and online platforms. This diversification in accessibility enhances consumer exposure to flavored water products, encouraging trial and repeat purchases within this market segment.
Venezuela Flavored Water Market Key Takeaways
- Health-conscious consumers are driving the demand for flavored water free from artificial ingredients.
- Innovative flavors and eco-friendly packaging are key strategies for companies looking to differentiate in the market.
- The market is poised for growth despite economic challenges due to the ongoing crisis in Venezuela.
- Increasing retail distribution channels enhance consumer access to flavored water products.
- Local production and tailored offerings can help mitigate challenges posed by economic instability.
Evaluation of Restraints in Venezuela Flavored Water Market
The Venezuela Flavored Water Market faces significant restraints primarily due to the country’s ongoing economic instability and hyperinflation. These factors have created an environment of fluctuating consumer purchasing power, which directly impacts demand. Additionally, infrastructure challenges and supply chain disruptions hinder the effective distribution of flavored water products, limiting market reach. Regulatory uncertainties and political unrest further complicate the landscape, making it difficult for companies to execute long-term investment strategies and maintain consistent sales growth.
Venezuela Flavored Water Market Trends
Current trends in the Venezuela Flavored Water Market indicate a strong shift toward natural and health-oriented offerings. Consumers increasingly prefer products devoid of artificial colors, flavors, and sweeteners, seeking transparent labeling and functional benefits. Moreover, unique flavor combinations are gaining traction, reflecting a consumer appetite for new experiences. The emphasis on sustainable practices and eco-friendly packaging solutions is also becoming crucial as consumers align their purchasing decisions with environmental considerations.
Venezuela Flavored Water Market Opportunities
Investors and companies looking to enter the Venezuela Flavored Water Market have various opportunities to capitalize on the burgeoning demand for healthier beverages. Establishing local production facilities can alleviate some supply chain issues while tapping into the desire for locally sourced products. Additionally, innovative marketing strategies that emphasize health benefits and unique flavor offerings can attract the increasingly discerning consumer base. Collaborating with existing beverage companies for product development tailored to local tastes can also present significant growth potential.
Government Initiatives in the Venezuela Flavored Water Market
Government policies influencing the Venezuela Flavored Water Market include stringent regulations on food and beverage labeling, quality assurance, and pricing controls aimed at safeguarding consumer interests. Measures have been put in place to prevent price gouging, ensuring that flavored water remains affordable for consumers. Import restrictions and tariffs are designed to protect domestic production, thereby promoting local manufacturing of flavored water products while adhering to safety and health requirements.
Future Insights of the Venezuela Flavored Water Market
Looking ahead to the period between 2026 and 2032, the Venezuela Flavored Water Market is anticipated to navigate a complex landscape of economic challenges. Despite ongoing issues like hyperinflation and supply disruptions, there is potential for market resilience driven by local innovation. Companies may increasingly focus on using cost-effective ingredients and sustainable packaging solutions to align with consumer preferences, thereby carving out niche segments within the overall beverage market. Strategic adaptations will be essential for players seeking to thrive in this dynamic environment.
Venezuela Flavored Water Market Latest Developments (May 2025 - June 2026)
Recent developments in the Venezuela Flavored Water Market highlight a growing emphasis on product innovation and sustainability. Companies are exploring diverse flavor profiles that cater to local tastes, while eco-friendly packaging options are being introduced in response to consumer demand for environmentally responsible products. Enhanced distribution strategies are also being implemented to improve market reach and consumer accessibility, reflecting an adaptive response to the current economic conditions.
Venezuela Flavored Water Market - Key Attractiveness of the Report
- 10 Years of Market Numbers
- Historical Data Starting from 2022 to 2025
- Base Year: 2025
- Forecast Data until 2032
- Key Performance Indicators Impacting the Market
- Major Upcoming Developments and Projects
Key Highlights of the Report:
- Venezuela Flavored Water Market Outlook
- Market Size of Venezuela Flavored Water Market, 2025
- Forecast of Venezuela Flavored Water Market, 2032
- Historical Data and Forecast of Venezuela Flavored Water Revenues & Volume for the Period 2022-2032F
- Venezuela Flavored Water Market Trend Evolution
- Venezuela Flavored Water Market Drivers and Challenges
- Venezuela Flavored Water Price Trends
- Venezuela Flavored Water Porter's Five Forces
- Venezuela Flavored Water Industry Life Cycle
- Historical Data and Forecast of Venezuela Flavored Water Market Revenues & Volume By Type for the Period 2022-2032F
- Historical Data and Forecast of Venezuela Flavored Water Market Revenues & Volume By Carbonated for the Period 2022-2032F
- Historical Data and Forecast of Venezuela Flavored Water Market Revenues & Volume By Still for the Period 2022-2032F
- Historical Data and Forecast of Venezuela Flavored Water Market Revenues & Volume By Packaging type for the Period 2022-2032F
- Historical Data and Forecast of Venezuela Flavored Water Market Revenues & Volume By Bottles for the Period 2022-2032F
- Historical Data and Forecast of Venezuela Flavored Water Market Revenues & Volume By Cans for the Period 2022-2032F
- Historical Data and Forecast of Venezuela Flavored Water Market Revenues & Volume By others for the Period 2022-2032F
- Historical Data and Forecast of Venezuela Flavored Water Market Revenues & Volume By Distribution Channel for the Period 2022-2032F
- Historical Data and Forecast of Venezuela Flavored Water Market Revenues & Volume By Store-Based for the Period 2022-2032F
- Historical Data and Forecast of Venezuela Flavored Water Market Revenues & Volume By Non-Store-Based for the Period 2022-2032F
- Venezuela Flavored Water Import Export Trade Statistics
- Market Opportunity Assessment By Type
- Market Opportunity Assessment By Packaging type
- Market Opportunity Assessment By Distribution Channel
- Venezuela Flavored Water Top Companies Market Share
- Venezuela Flavored Water Competitive Benchmarking By Technical and Operational Parameters
- Venezuela Flavored Water Company Profiles
- Venezuela Flavored Water Key Strategic Recommendations
Venezuela Flavored Water Market - Frequently Asked Questions
Increasing health consciousness among consumers and a growing preference for healthier beverage options are major factors driving growth in the flavored water market in Venezuela.
The Venezuela Flavored Water Market was estimated at USD 248 Million in 2025 and is projected to reach USD 334 Million by 2032, with a CAGR of 4.3% from 2026 to 2032, indicating a robust growth trajectory.
Notable trends include the demand for natural ingredients, unique flavor combinations, and sustainability in packaging, reflecting evolving consumer preferences in Venezuela.
The Venezuelan economy's hyperinflation and supply chain disruptions pose significant challenges, affecting consumer purchasing power and product availability in the flavored water sector.
Local manufacturers are focusing on innovative, cost-effective ingredients and sustainable practices to cater to changing consumer preferences while navigating economic challenges.
6Wresearch actively monitors the Venezuela Flavored Water Market and publishes its comprehensive annual report, highlighting emerging trends, growth drivers, revenue analysis, and forecast outlook. Our insights help businesses to make data-backed strategic decisions with ongoing market dynamics. Our analysts track relevent industries related to the Venezuela Flavored Water Market, allowing our clients with actionable intelligence and reliable forecasts tailored to emerging regional needs.
Yes, we provide customisation as per your requirements. To learn more, feel free to contact us on sales@6wresearch.com
1 Executive Summary |
2 Introduction |
2.1 Key Highlights of the Report |
2.2 Report Description |
2.3 Market Scope & Segmentation |
2.4 Research Methodology |
2.5 Assumptions |
3 Venezuela Flavored Water Market Overview |
3.1 Venezuela Country Macro Economic Indicators |
3.2 Venezuela Flavored Water Market Revenues & Volume, 2022 & 2032F |
3.3 Venezuela Flavored Water Market - Industry Life Cycle |
3.4 Venezuela Flavored Water Market - Porter's Five Forces |
3.5 Venezuela Flavored Water Market Revenues & Volume Share, By Type, 2022 & 2032F |
3.6 Venezuela Flavored Water Market Revenues & Volume Share, By Packaging type, 2022 & 2032F |
3.7 Venezuela Flavored Water Market Revenues & Volume Share, By Distribution Channel, 2022 & 2032F |
4 Venezuela Flavored Water Market Dynamics |
4.1 Impact Analysis |
4.2 Market Drivers |
4.3 Market Restraints |
5 Venezuela Flavored Water Market Trends |
6 Venezuela Flavored Water Market, By Types |
6.1 Venezuela Flavored Water Market, By Type |
6.1.1 Overview and Analysis |
6.1.2 Venezuela Flavored Water Market Revenues & Volume, By Type, 2022-2032F |
6.1.3 Venezuela Flavored Water Market Revenues & Volume, By Carbonated, 2022-2032F |
6.1.4 Venezuela Flavored Water Market Revenues & Volume, By Still, 2022-2032F |
6.2 Venezuela Flavored Water Market, By Packaging type |
6.2.1 Overview and Analysis |
6.2.2 Venezuela Flavored Water Market Revenues & Volume, By Bottles, 2022-2032F |
6.2.3 Venezuela Flavored Water Market Revenues & Volume, By Cans, 2022-2032F |
6.2.4 Venezuela Flavored Water Market Revenues & Volume, By others, 2022-2032F |
6.3 Venezuela Flavored Water Market, By Distribution Channel |
6.3.1 Overview and Analysis |
6.3.2 Venezuela Flavored Water Market Revenues & Volume, By Store-Based, 2022-2032F |
6.3.3 Venezuela Flavored Water Market Revenues & Volume, By Non-Store-Based, 2022-2032F |
7 Venezuela Flavored Water Market Import-Export Trade Statistics |
7.1 Venezuela Flavored Water Market Export to Major Countries |
7.2 Venezuela Flavored Water Market Imports from Major Countries |
8 Venezuela Flavored Water Market Key Performance Indicators |
9 Venezuela Flavored Water Market - Opportunity Assessment |
9.1 Venezuela Flavored Water Market Opportunity Assessment, By Type, 2022 & 2032F |
9.2 Venezuela Flavored Water Market Opportunity Assessment, By Packaging type, 2022 & 2032F |
9.3 Venezuela Flavored Water Market Opportunity Assessment, By Distribution Channel, 2022 & 2032F |
10 Venezuela Flavored Water Market - Competitive Landscape |
10.1 Venezuela Flavored Water Market Revenue Share, By Companies, 2025 |
10.2 Venezuela Flavored Water Market Competitive Benchmarking, By Operating and Technical Parameters |
11 Company Profiles |
12 Recommendations |
13 Disclaimer |
Global Go To Market Strategy - 2030
Export potential enables firms to identify high-growth global markets with greater confidence by combining advanced trade intelligence with a structured quantitative methodology. The framework analyzes emerging demand trends and country-level import patterns while integrating macroeconomic and trade datasets such as GDP and population forecasts, bilateral import–export flows, tariff structures, elasticity differentials between developed and developing economies, geographic distance, and import demand projections. Using weighted trade values from 2020–2024 as the base period to project country-to-country export potential for 2030, these inputs are operationalized through calculated drivers such as gravity model parameters, tariff impact factors, and projected GDP per-capita growth. Through an analysis of hidden potentials, demand hotspots, and market conditions that are most favorable to success, this method enables firms to focus on target countries, maximize returns, and global expansion with data, backed by accuracy.
By factoring in the projected importer demand gap that is currently unmet and could be potential opportunity, it identifies the potential for the Exporter (Country) among 190 countries, against the general trade analysis, which identifies the biggest importer or exporter.
To discover high-growth global markets and optimize your business strategy:
Click Here
Pricing
- Single User License$ 1,995
- Department License$ 2,400
- Site License$ 3,120
- Global License$ 3,795

Leadership Perspectives from Industry Events
Search
Thought Leadership and Analyst Meet


Our Clients
6WResearch In News
- India Air Conditioner Market Set for Strong Rebound in 2026 After Weather-Led Correction and GST-Driven Recovery: 6Wresearch
- ADAS in India: How Automatic Emergency Braking, Blind Spot Detection & Driver Monitoring are Transforming Road Safety
- Doha a strategic location for EV manufacturing hub: IPA Qatar
- Demand for luxury TVs surging in the GCC, says Samsung
- Empowering Growth: The Thriving Journey of Bangladesh’s Cable Industry
- Demand for luxury TVs surging in the GCC, says Samsung
Latest Reports
- Poland Fire Protection Systems Market (2026-2032)
- Cape Verde Portable Hand-Thrown Extinguisher Market (2026-2032)
- Canada Portable Hand-Thrown Extinguisher Market (2026-2032)
- Cameroon Portable Hand-Thrown Extinguisher Market (2026-2032)
- Burundi Portable Hand-Thrown Extinguisher Market (2026-2032)
- Burkina Faso Portable Hand-Thrown Extinguisher Market (2026-2032)
- Bulgaria Portable Hand-Thrown Extinguisher Market (2026-2032)
- Brunei Portable Hand-Thrown Extinguisher Market (2026-2032)
- Botswana Portable Hand-Thrown Extinguisher Market (2026-2032)
- Bosnia and Herzegovina Portable Hand-Thrown Extinguisher Market (2026-2032)
Industry Events and Analyst Meet

HIMTEX 2026

India Refining Summit 2026

India EV Show 2026

EV tech India Expo 2026

Auto Tech Asia 2026
Whitepaper
- Middle East & Africa Commercial Security Market Click here to view more.
- Middle East & Africa Fire Safety Systems & Equipment Market Click here to view more.
- GCC Drone Market Click here to view more.
- Middle East Lighting Fixture Market Click here to view more.
- GCC Physical & Perimeter Security Market Click here to view more.