Zambia Chemical Sensors for Liquid Market (2025-2031) | Forecast, Value, Companies, Segmentation, Industry, Analysis, Trends, Competitive Landscape, Size & Revenue, Outlook, Growth, Share
Market Forecast By Product Type (Electrochemical, Optical, Pellistor/Catalytic Bead, Semiconductor, Others), By Applicaton (Industrial, Environmental Monitoring, Medical, Defence and Homeland Security, Others) And Competitive Landscape
| Product Code: ETC10113671 | Publication Date: Sep 2024 | Updated Date: Dec 2025 | Product Type: Market Research Report | |
| Publisher: 6Wresearch | Author: Sumit Sagar | No. of Pages: 75 | No. of Figures: 35 | No. of Tables: 20 |
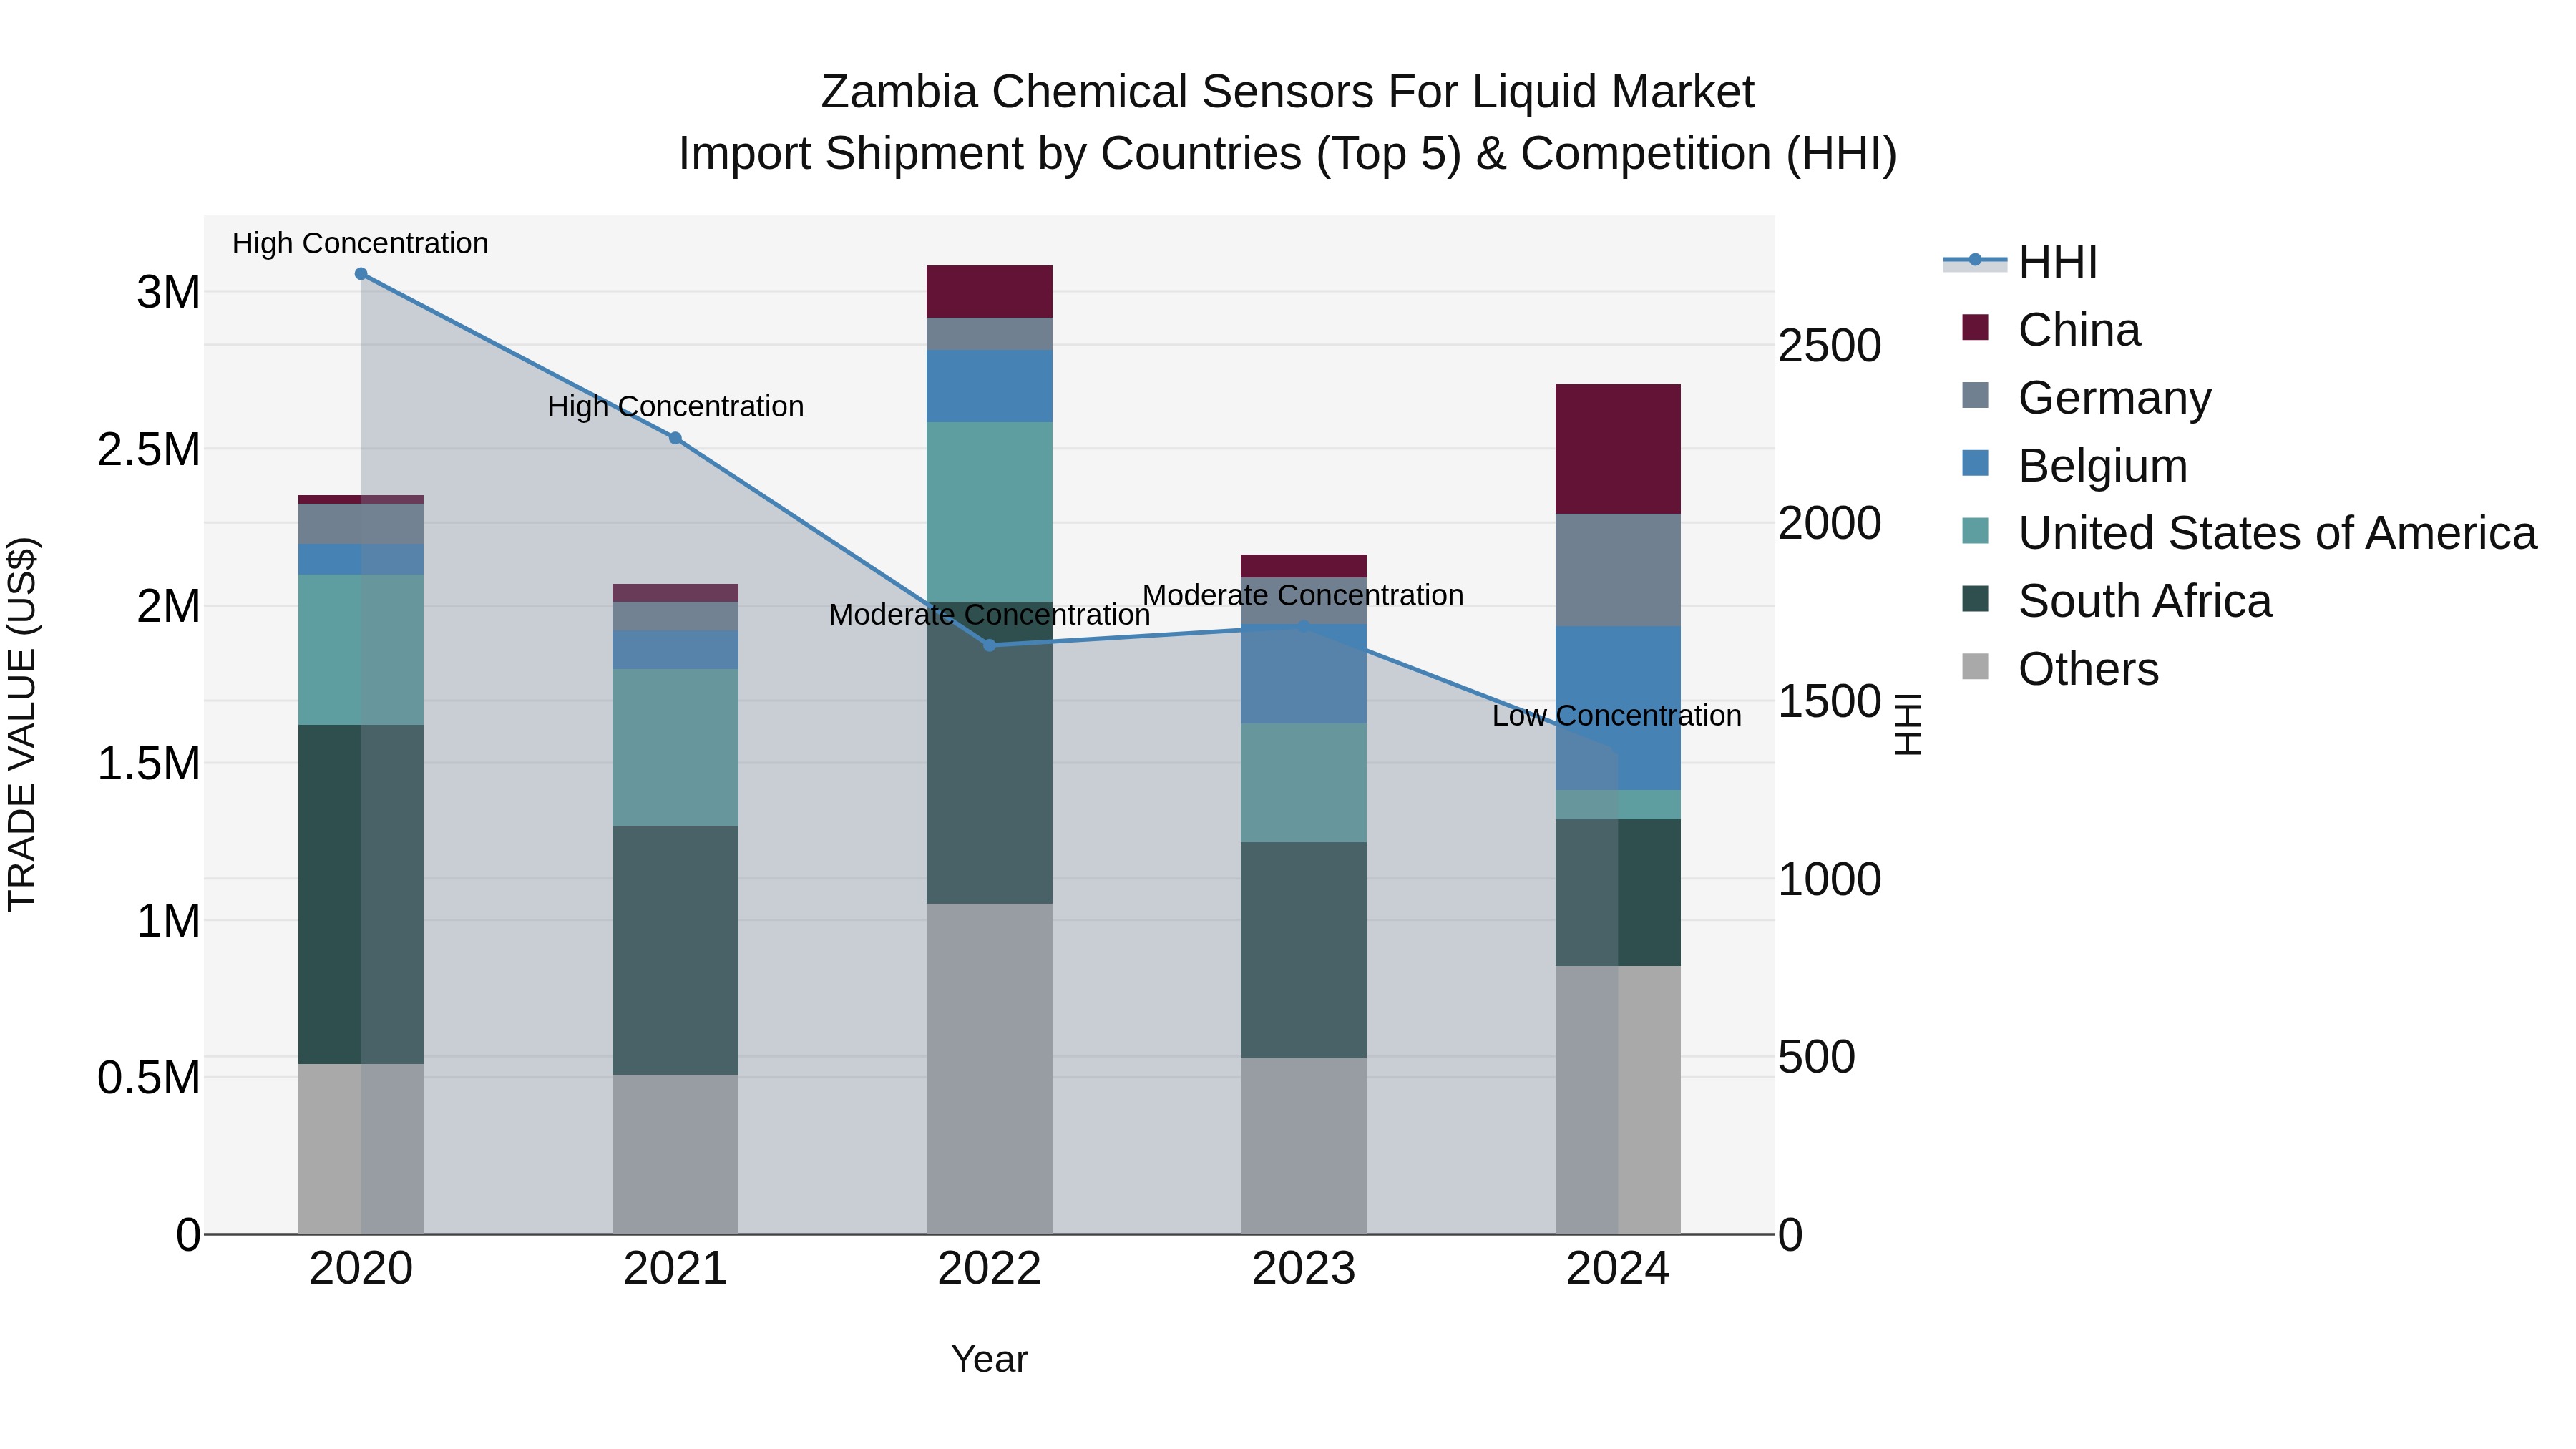
Zambia Chemical Sensors for Liquid Market: Top 5 Importing Countries and Market Competition (HHI) Analysis
The market for chemical sensors for liquid import shipments in Zambia experienced a notable shift in concentration levels from moderate to low in 2024, indicating increased competition among suppliers. The top exporting countries, including Belgium, South Africa, United Arab Emirates, China, and Germany, have been key players in driving growth with a CAGR of 3.57% from 2020 to 2024. The impressive growth rate of 25.05% from 2023 to 2024 suggests a rising demand for advanced sensor technologies in the Zambian market, presenting opportunities for market expansion and innovation.
Key Highlights of the Report:
- Zambia Chemical Sensors for Liquid Market Outlook
- Market Size of Zambia Chemical Sensors for Liquid Market, 2024
- Forecast of Zambia Chemical Sensors for Liquid Market, 2031
- Historical Data and Forecast of Zambia Chemical Sensors for Liquid Revenues & Volume for the Period 2021- 2031
- Zambia Chemical Sensors for Liquid Market Trend Evolution
- Zambia Chemical Sensors for Liquid Market Drivers and Challenges
- Zambia Chemical Sensors for Liquid Price Trends
- Zambia Chemical Sensors for Liquid Porter's Five Forces
- Zambia Chemical Sensors for Liquid Industry Life Cycle
- Historical Data and Forecast of Zambia Chemical Sensors for Liquid Market Revenues & Volume By Product Type for the Period 2021- 2031
- Historical Data and Forecast of Zambia Chemical Sensors for Liquid Market Revenues & Volume By Electrochemical for the Period 2021- 2031
- Historical Data and Forecast of Zambia Chemical Sensors for Liquid Market Revenues & Volume By Optical for the Period 2021- 2031
- Historical Data and Forecast of Zambia Chemical Sensors for Liquid Market Revenues & Volume By Pellistor/Catalytic Bead for the Period 2021- 2031
- Historical Data and Forecast of Zambia Chemical Sensors for Liquid Market Revenues & Volume By Semiconductor for the Period 2021- 2031
- Historical Data and Forecast of Zambia Chemical Sensors for Liquid Market Revenues & Volume By Others for the Period 2021- 2031
- Historical Data and Forecast of Zambia Chemical Sensors for Liquid Market Revenues & Volume By Applicaton for the Period 2021- 2031
- Historical Data and Forecast of Zambia Chemical Sensors for Liquid Market Revenues & Volume By Industrial for the Period 2021- 2031
- Historical Data and Forecast of Zambia Chemical Sensors for Liquid Market Revenues & Volume By Environmental Monitoring for the Period 2021- 2031
- Historical Data and Forecast of Zambia Chemical Sensors for Liquid Market Revenues & Volume By Medical for the Period 2021- 2031
- Historical Data and Forecast of Zambia Chemical Sensors for Liquid Market Revenues & Volume By Defence and Homeland Security for the Period 2021- 2031
- Historical Data and Forecast of Zambia Chemical Sensors for Liquid Market Revenues & Volume By Others for the Period 2021- 2031
- Zambia Chemical Sensors for Liquid Import Export Trade Statistics
- Market Opportunity Assessment By Product Type
- Market Opportunity Assessment By Applicaton
- Zambia Chemical Sensors for Liquid Top Companies Market Share
- Zambia Chemical Sensors for Liquid Competitive Benchmarking By Technical and Operational Parameters
- Zambia Chemical Sensors for Liquid Company Profiles
- Zambia Chemical Sensors for Liquid Key Strategic Recommendations
Frequently Asked Questions About the Market Study (FAQs):
6Wresearch actively monitors the Zambia Chemical Sensors for Liquid Market and publishes its comprehensive annual report, highlighting emerging trends, growth drivers, revenue analysis, and forecast outlook. Our insights help businesses to make data-backed strategic decisions with ongoing market dynamics. Our analysts track relevent industries related to the Zambia Chemical Sensors for Liquid Market, allowing our clients with actionable intelligence and reliable forecasts tailored to emerging regional needs.
Yes, we provide customisation as per your requirements. To learn more, feel free to contact us on sales@6wresearch.com
1 Executive Summary |
2 Introduction |
2.1 Key Highlights of the Report |
2.2 Report Description |
2.3 Market Scope & Segmentation |
2.4 Research Methodology |
2.5 Assumptions |
3 Zambia Chemical Sensors for Liquid Market Overview |
3.1 Zambia Country Macro Economic Indicators |
3.2 Zambia Chemical Sensors for Liquid Market Revenues & Volume, 2021 & 2031F |
3.3 Zambia Chemical Sensors for Liquid Market - Industry Life Cycle |
3.4 Zambia Chemical Sensors for Liquid Market - Porter's Five Forces |
3.5 Zambia Chemical Sensors for Liquid Market Revenues & Volume Share, By Product Type, 2021 & 2031F |
3.6 Zambia Chemical Sensors for Liquid Market Revenues & Volume Share, By Applicaton, 2021 & 2031F |
4 Zambia Chemical Sensors for Liquid Market Dynamics |
4.1 Impact Analysis |
4.2 Market Drivers |
4.2.1 Increasing demand for real-time monitoring and control of liquid processes in industries such as oil gas, chemical, and food & beverage |
4.2.2 Growing focus on environmental monitoring and compliance regulations driving the adoption of chemical sensors for liquid analysis |
4.2.3 Technological advancements leading to the development of more sensitive, accurate, and cost-effective chemical sensors for liquids |
4.3 Market Restraints |
4.3.1 High initial investment costs associated with the procurement and installation of chemical sensors for liquid analysis |
4.3.2 Lack of skilled professionals for the operation and maintenance of complex chemical sensor systems |
4.3.3 Challenges related to calibration and maintenance of chemical sensors impacting their reliability and performance over time |
5 Zambia Chemical Sensors for Liquid Market Trends |
6 Zambia Chemical Sensors for Liquid Market, By Types |
6.1 Zambia Chemical Sensors for Liquid Market, By Product Type |
6.1.1 Overview and Analysis |
6.1.2 Zambia Chemical Sensors for Liquid Market Revenues & Volume, By Product Type, 2021- 2031F |
6.1.3 Zambia Chemical Sensors for Liquid Market Revenues & Volume, By Electrochemical, 2021- 2031F |
6.1.4 Zambia Chemical Sensors for Liquid Market Revenues & Volume, By Optical, 2021- 2031F |
6.1.5 Zambia Chemical Sensors for Liquid Market Revenues & Volume, By Pellistor/Catalytic Bead, 2021- 2031F |
6.1.6 Zambia Chemical Sensors for Liquid Market Revenues & Volume, By Semiconductor, 2021- 2031F |
6.1.7 Zambia Chemical Sensors for Liquid Market Revenues & Volume, By Others, 2021- 2031F |
6.2 Zambia Chemical Sensors for Liquid Market, By Applicaton |
6.2.1 Overview and Analysis |
6.2.2 Zambia Chemical Sensors for Liquid Market Revenues & Volume, By Industrial, 2021- 2031F |
6.2.3 Zambia Chemical Sensors for Liquid Market Revenues & Volume, By Environmental Monitoring, 2021- 2031F |
6.2.4 Zambia Chemical Sensors for Liquid Market Revenues & Volume, By Medical, 2021- 2031F |
6.2.5 Zambia Chemical Sensors for Liquid Market Revenues & Volume, By Defence and Homeland Security, 2021- 2031F |
6.2.6 Zambia Chemical Sensors for Liquid Market Revenues & Volume, By Others, 2021- 2031F |
7 Zambia Chemical Sensors for Liquid Market Import-Export Trade Statistics |
7.1 Zambia Chemical Sensors for Liquid Market Export to Major Countries |
7.2 Zambia Chemical Sensors for Liquid Market Imports from Major Countries |
8 Zambia Chemical Sensors for Liquid Market Key Performance Indicators |
8.1 Average response time of chemical sensors in detecting changes in liquid composition |
8.2 Percentage of compliance with environmental regulations achieved by industries using chemical sensors for liquid analysis |
8.3 Rate of adoption of advanced features and technologies in chemical sensors for liquids |
8.4 Frequency of sensor calibration and maintenance to ensure optimal performance |
8.5 Percentage reduction in downtime and operational costs achieved by industries implementing chemical sensors for liquid monitoring and control |
9 Zambia Chemical Sensors for Liquid Market - Opportunity Assessment |
9.1 Zambia Chemical Sensors for Liquid Market Opportunity Assessment, By Product Type, 2021 & 2031F |
9.2 Zambia Chemical Sensors for Liquid Market Opportunity Assessment, By Applicaton, 2021 & 2031F |
10 Zambia Chemical Sensors for Liquid Market - Competitive Landscape |
10.1 Zambia Chemical Sensors for Liquid Market Revenue Share, By Companies, 2024 |
10.2 Zambia Chemical Sensors for Liquid Market Competitive Benchmarking, By Operating and Technical Parameters |
11 Company Profiles |
12 Recommendations |
13 Disclaimer |
Pricing
- Single User License$ 1,995
- Department License$ 2,400
- Site License$ 3,120
- Global License$ 3,795

Search
Thought Leadership and Analyst Meet


Our Clients
Related Reports
- Canada Oil and Gas Market (2026-2032) | Share, Segmentation, Value, Industry, Trends, Forecast, Analysis, Size & Revenue, Growth, Competitive Landscape, Outlook, Companies
- Germany Breakfast Food Market (2026-2032) | Industry, Share, Growth, Size, Companies, Value, Analysis, Revenue, Trends, Forecast & Outlook
- Australia Briquette Market (2025-2031) | Growth, Size, Revenue, Forecast, Analysis, Trends, Value, Share, Industry & Companies
- Vietnam System Integrator Market (2025-2031) | Size, Companies, Analysis, Industry, Value, Forecast, Growth, Trends, Revenue & Share
- ASEAN and Thailand Brain Health Supplements Market (2025-2031) | Strategy, Consumer Insights, Analysis, Investment Trends, Opportunities, Growth, Size, Share, Industry, Revenue, Segments, Value, Segmentation, Supply, Forecast, Restraints, Outlook, Competition, Drivers, Trends, Demand, Pricing Analysis, Competitive, Strategic Insights, Companies, Challenges
- ASEAN Bearings Market (2025-2031) | Strategy, Consumer Insights, Analysis, Investment Trends, Opportunities, Growth, Size, Share, Industry, Revenue, Segments, Value, Segmentation, Supply, Forecast, Restraints, Outlook, Competition, Drivers, Trends, Demand, Pricing Analysis, Competitive, Strategic Insights, Companies, Challenges
- Europe Flooring Market (2025-2031) | Outlook, Share, Industry, Trends, Forecast, Companies, Revenue, Size, Analysis, Growth & Value
- Saudi Arabia Manlift Market (2025-2031) | Outlook, Size, Growth, Trends, Companies, Industry, Revenue, Value, Share, Forecast & Analysis
- Uganda Excavator, Crane, and Wheel Loaders Market (2025-2031) | Strategy, Consumer Insights, Analysis, Investment Trends, Opportunities, Growth, Size, Share, Industry, Revenue, Segments, Value, Segmentation, Supply, Forecast, Restraints, Outlook, Competition, Drivers, Trends, Demand, Pricing Analysis, Competitive, Strategic Insights, Companies, Challenges
- Rwanda Excavator, Crane, and Wheel Loaders Market (2025-2031) | Strategy, Consumer Insights, Analysis, Investment Trends, Opportunities, Growth, Size, Share, Industry, Revenue, Segments, Value, Segmentation, Supply, Forecast, Restraints, Outlook, Competition, Drivers, Trends, Demand, Pricing Analysis, Competitive, Strategic Insights, Companies, Challenges
Industry Events and Analyst Meet

Stationery & Paper Expo Saudi Arabia 2026

Kids & Toys Expo Saudi Arabia 2026

Gifts & Homeware Expo Saudi Arabia 2026

Smart Home Expo 2026

Industrial Facilities Management Expo 2025
Whitepaper
- Middle East & Africa Commercial Security Market Click here to view more.
- Middle East & Africa Fire Safety Systems & Equipment Market Click here to view more.
- GCC Drone Market Click here to view more.
- Middle East Lighting Fixture Market Click here to view more.
- GCC Physical & Perimeter Security Market Click here to view more.
6WResearch In News
- Doha a strategic location for EV manufacturing hub: IPA Qatar
- Demand for luxury TVs surging in the GCC, says Samsung
- Empowering Growth: The Thriving Journey of Bangladesh’s Cable Industry
- Demand for luxury TVs surging in the GCC, says Samsung
- Video call with a traditional healer? Once unthinkable, it’s now common in South Africa
- Intelligent Buildings To Smooth GCC’s Path To Net Zero