Zambia Laboratory Plastic Consumables Market (2026-2032) | Segmentation, Outlook, Revenue, Pricing Analysis, Challenges, Drivers, Companies, Competitive, Strategic Insights, Size, Segments, Investment Trends, Industry, Opportunities, Forecast, Demand, Restraints, Analysis, Trends, Competition, Supply, Consumer Insights, Growth, Share, Strategy, Value
Market Forecast By Product Type (Pipette Tips, Centrifuge Tubes, Microplates, Petri Dishes, Test Tubes), By Material Type (Polypropylene, Polyethylene, Polycarbonate, Polystyrene, Acrylic), By Application (Clinical Diagnostics, Biotechnology, Pharmaceutical Testing, Chemical Analysis, Cell Culture), By Capacity Range (Below 100ml, 100ml-500ml, 500ml-1000ml, 1L-5L, Above 5L), By End User (Hospitals, Research Labs, Diagnostic Centers, Academic Institutes, Industrial Labs) And Competitive Landscape
| Product Code: ETC12617722 | Publication Date: Apr 2025 | Updated Date: Apr 2026 | Product Type: Market Research Report | |
| Publisher: 6Wresearch | No. of Pages: 65 | No. of Figures: 34 | No. of Tables: 19 | |
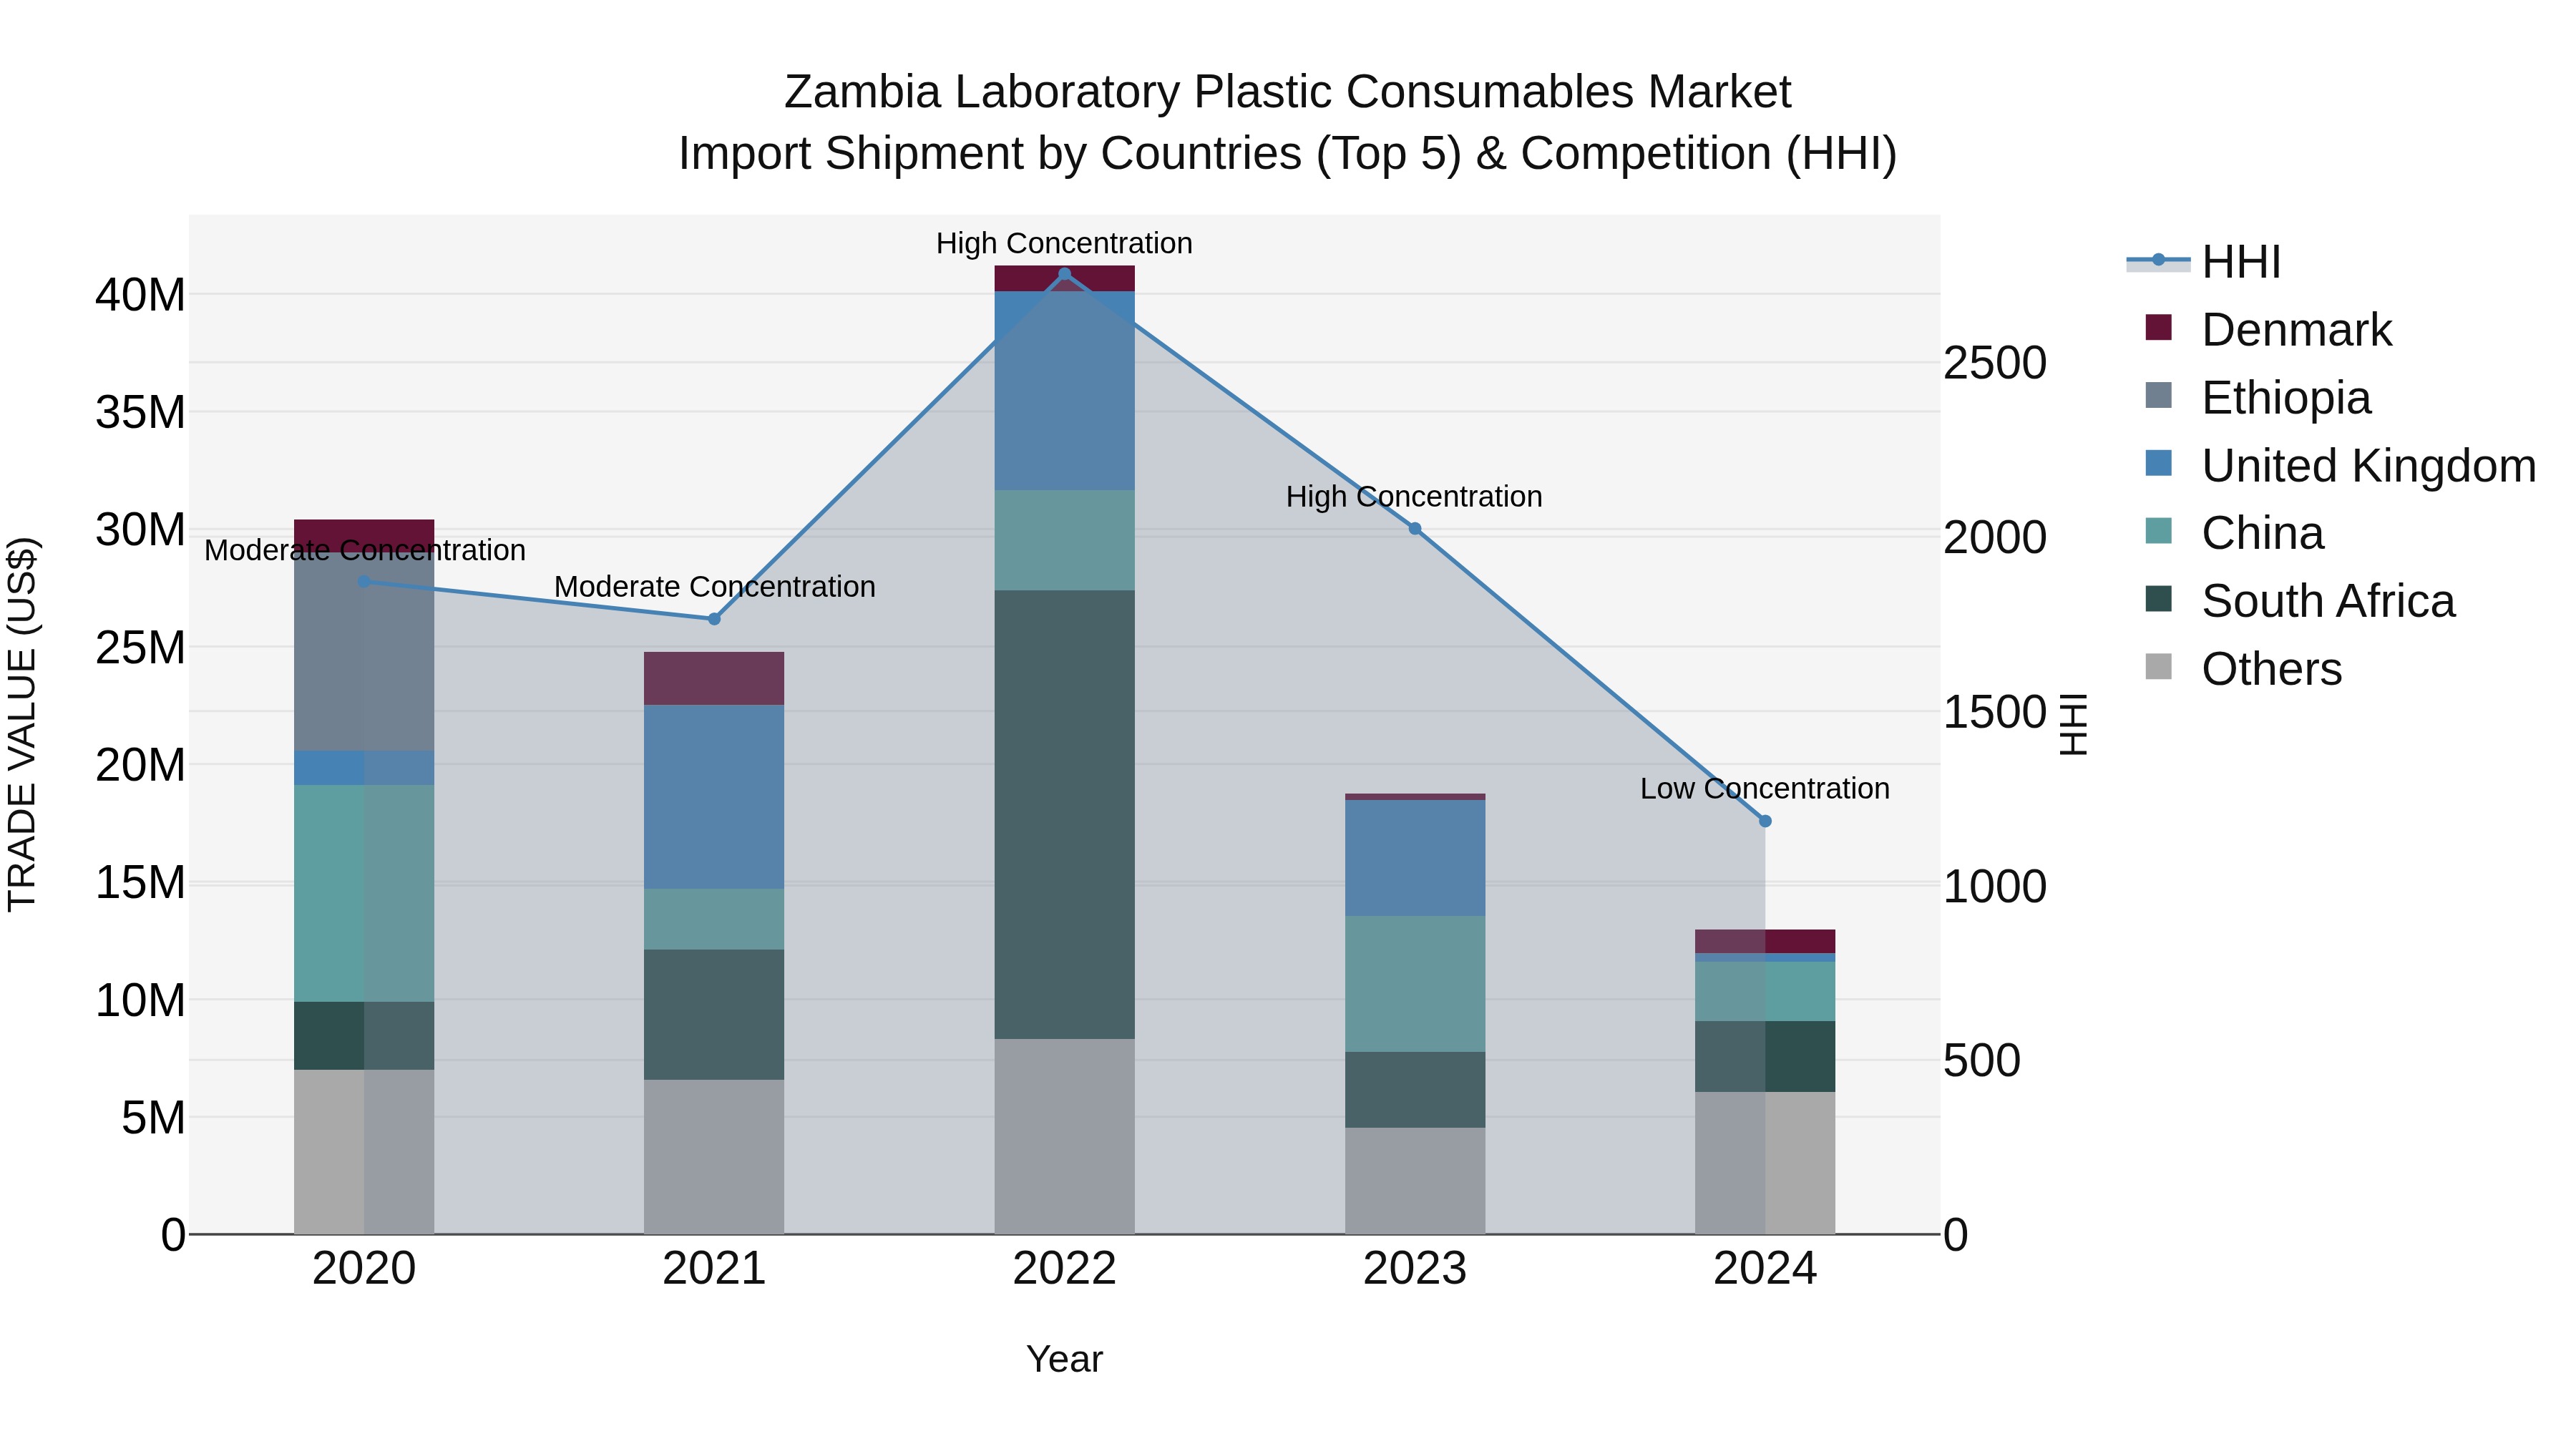
Zambia Laboratory Plastic Consumables Market: Top 5 Importing Countries and Market Competition (HHI) Analysis
In 2024, Zambia`s laboratory plastic consumables import shipments were primarily sourced from South Africa, China, Belgium, Denmark, and India. The market saw a significant shift from high concentration to low concentration, indicating a more diversified import landscape. With a negative Compound Annual Growth Rate (CAGR) of -19.2% from 2020 to 2024, and a further decline in growth rate of -30.85% from 2023 to 2024, stakeholders should closely monitor market dynamics and adapt strategies to navigate the changing competitive environment.
Key Highlights of the Report:
- Zambia Laboratory Plastic Consumables Market Outlook
- Market Size of Zambia Laboratory Plastic Consumables Market, 2025
- Forecast of Zambia Laboratory Plastic Consumables Market, 2032
- Historical Data and Forecast of Zambia Laboratory Plastic Consumables Revenues & Volume for the Period 2022 - 2032F
- Zambia Laboratory Plastic Consumables Market Trend Evolution
- Zambia Laboratory Plastic Consumables Market Drivers and Challenges
- Zambia Laboratory Plastic Consumables Price Trends
- Zambia Laboratory Plastic Consumables Porter's Five Forces
- Zambia Laboratory Plastic Consumables Industry Life Cycle
- Historical Data and Forecast of Zambia Laboratory Plastic Consumables Market Revenues & Volume By Product Type for the Period 2022 - 2032F
- Historical Data and Forecast of Zambia Laboratory Plastic Consumables Market Revenues & Volume By Pipette Tips for the Period 2022 - 2032F
- Historical Data and Forecast of Zambia Laboratory Plastic Consumables Market Revenues & Volume By Centrifuge Tubes for the Period 2022 - 2032F
- Historical Data and Forecast of Zambia Laboratory Plastic Consumables Market Revenues & Volume By Microplates for the Period 2022 - 2032F
- Historical Data and Forecast of Zambia Laboratory Plastic Consumables Market Revenues & Volume By Petri Dishes for the Period 2022 - 2032F
- Historical Data and Forecast of Zambia Laboratory Plastic Consumables Market Revenues & Volume By Test Tubes for the Period 2022 - 2032F
- Historical Data and Forecast of Zambia Laboratory Plastic Consumables Market Revenues & Volume By Material Type for the Period 2022 - 2032F
- Historical Data and Forecast of Zambia Laboratory Plastic Consumables Market Revenues & Volume By Polypropylene for the Period 2022 - 2032F
- Historical Data and Forecast of Zambia Laboratory Plastic Consumables Market Revenues & Volume By Polyethylene for the Period 2022 - 2032F
- Historical Data and Forecast of Zambia Laboratory Plastic Consumables Market Revenues & Volume By Polycarbonate for the Period 2022 - 2032F
- Historical Data and Forecast of Zambia Laboratory Plastic Consumables Market Revenues & Volume By Polystyrene for the Period 2022 - 2032F
- Historical Data and Forecast of Zambia Laboratory Plastic Consumables Market Revenues & Volume By Acrylic for the Period 2022 - 2032F
- Historical Data and Forecast of Zambia Laboratory Plastic Consumables Market Revenues & Volume By Application for the Period 2022 - 2032F
- Historical Data and Forecast of Zambia Laboratory Plastic Consumables Market Revenues & Volume By Clinical Diagnostics for the Period 2022 - 2032F
- Historical Data and Forecast of Zambia Laboratory Plastic Consumables Market Revenues & Volume By Biotechnology for the Period 2022 - 2032F
- Historical Data and Forecast of Zambia Laboratory Plastic Consumables Market Revenues & Volume By Pharmaceutical Testing for the Period 2022 - 2032F
- Historical Data and Forecast of Zambia Laboratory Plastic Consumables Market Revenues & Volume By Chemical Analysis for the Period 2022 - 2032F
- Historical Data and Forecast of Zambia Laboratory Plastic Consumables Market Revenues & Volume By Cell Culture for the Period 2022 - 2032F
- Historical Data and Forecast of Zambia Laboratory Plastic Consumables Market Revenues & Volume By Capacity Range for the Period 2022 - 2032F
- Historical Data and Forecast of Zambia Laboratory Plastic Consumables Market Revenues & Volume By Below 100ml for the Period 2022 - 2032F
- Historical Data and Forecast of Zambia Laboratory Plastic Consumables Market Revenues & Volume By 100ml-500ml for the Period 2022 - 2032F
- Historical Data and Forecast of Zambia Laboratory Plastic Consumables Market Revenues & Volume By 500ml-1000ml for the Period 2022 - 2032F
- Historical Data and Forecast of Zambia Laboratory Plastic Consumables Market Revenues & Volume By 1L-5L for the Period 2022 - 2032F
- Historical Data and Forecast of Zambia Laboratory Plastic Consumables Market Revenues & Volume By Above 5L for the Period 2022 - 2032F
- Historical Data and Forecast of Zambia Laboratory Plastic Consumables Market Revenues & Volume By End User for the Period 2022 - 2032F
- Historical Data and Forecast of Zambia Laboratory Plastic Consumables Market Revenues & Volume By Hospitals for the Period 2022 - 2032F
- Historical Data and Forecast of Zambia Laboratory Plastic Consumables Market Revenues & Volume By Research Labs for the Period 2022 - 2032F
- Historical Data and Forecast of Zambia Laboratory Plastic Consumables Market Revenues & Volume By Diagnostic Centers for the Period 2022 - 2032F
- Historical Data and Forecast of Zambia Laboratory Plastic Consumables Market Revenues & Volume By Academic Institutes for the Period 2022 - 2032F
- Historical Data and Forecast of Zambia Laboratory Plastic Consumables Market Revenues & Volume By Industrial Labs for the Period 2022 - 2032F
- Zambia Laboratory Plastic Consumables Import Export Trade Statistics
- Market Opportunity Assessment By Product Type
- Market Opportunity Assessment By Material Type
- Market Opportunity Assessment By Application
- Market Opportunity Assessment By Capacity Range
- Market Opportunity Assessment By End User
- Zambia Laboratory Plastic Consumables Top Companies Market Share
- Zambia Laboratory Plastic Consumables Competitive Benchmarking By Technical and Operational Parameters
- Zambia Laboratory Plastic Consumables Company Profiles
- Zambia Laboratory Plastic Consumables Key Strategic Recommendations
Frequently Asked Questions About the Market Study (FAQs):
6Wresearch actively monitors the Zambia Laboratory Plastic Consumables Market and publishes its comprehensive annual report, highlighting emerging trends, growth drivers, revenue analysis, and forecast outlook. Our insights help businesses to make data-backed strategic decisions with ongoing market dynamics. Our analysts track relevent industries related to the Zambia Laboratory Plastic Consumables Market, allowing our clients with actionable intelligence and reliable forecasts tailored to emerging regional needs.
Yes, we provide customisation as per your requirements. To learn more, feel free to contact us on sales@6wresearch.com
1 Executive Summary |
2 Introduction |
2.1 Key Highlights of the Report |
2.2 Report Description |
2.3 Market Scope & Segmentation |
2.4 Research Methodology |
2.5 Assumptions |
3 Zambia Laboratory Plastic Consumables Market Overview |
3.1 Zambia Country Macro Economic Indicators |
3.2 Zambia Laboratory Plastic Consumables Market Revenues & Volume, 2022 & 2032F |
3.3 Zambia Laboratory Plastic Consumables Market - Industry Life Cycle |
3.4 Zambia Laboratory Plastic Consumables Market - Porter's Five Forces |
3.5 Zambia Laboratory Plastic Consumables Market Revenues & Volume Share, By Product Type, 2022 & 2032F |
3.6 Zambia Laboratory Plastic Consumables Market Revenues & Volume Share, By Material Type, 2022 & 2032F |
3.7 Zambia Laboratory Plastic Consumables Market Revenues & Volume Share, By Application, 2022 & 2032F |
3.8 Zambia Laboratory Plastic Consumables Market Revenues & Volume Share, By Capacity Range, 2022 & 2032F |
3.9 Zambia Laboratory Plastic Consumables Market Revenues & Volume Share, By End User, 2022 & 2032F |
4 Zambia Laboratory Plastic Consumables Market Dynamics |
4.1 Impact Analysis |
4.2 Market Drivers |
4.2.1 Increasing demand for healthcare services and diagnostic testing in Zambia |
4.2.2 Growing investments in research and development activities in the healthcare sector |
4.2.3 Rising focus on disease prevention and control leading to more laboratory testing |
4.3 Market Restraints |
4.3.1 Limited availability of skilled labor in the laboratory sector |
4.3.2 Challenges related to the procurement and maintenance of advanced laboratory equipment |
4.3.3 Lack of standardized regulations for laboratory practices in Zambia |
5 Zambia Laboratory Plastic Consumables Market Trends |
6 Zambia Laboratory Plastic Consumables Market, By Types |
6.1 Zambia Laboratory Plastic Consumables Market, By Product Type |
6.1.1 Overview and Analysis |
6.1.2 Zambia Laboratory Plastic Consumables Market Revenues & Volume, By Product Type, 2022 - 2032F |
6.1.3 Zambia Laboratory Plastic Consumables Market Revenues & Volume, By Pipette Tips, 2022 - 2032F |
6.1.4 Zambia Laboratory Plastic Consumables Market Revenues & Volume, By Centrifuge Tubes, 2022 - 2032F |
6.1.5 Zambia Laboratory Plastic Consumables Market Revenues & Volume, By Microplates, 2022 - 2032F |
6.1.6 Zambia Laboratory Plastic Consumables Market Revenues & Volume, By Petri Dishes, 2022 - 2032F |
6.1.7 Zambia Laboratory Plastic Consumables Market Revenues & Volume, By Test Tubes, 2022 - 2032F |
6.2 Zambia Laboratory Plastic Consumables Market, By Material Type |
6.2.1 Overview and Analysis |
6.2.2 Zambia Laboratory Plastic Consumables Market Revenues & Volume, By Polypropylene, 2022 - 2032F |
6.2.3 Zambia Laboratory Plastic Consumables Market Revenues & Volume, By Polyethylene, 2022 - 2032F |
6.2.4 Zambia Laboratory Plastic Consumables Market Revenues & Volume, By Polycarbonate, 2022 - 2032F |
6.2.5 Zambia Laboratory Plastic Consumables Market Revenues & Volume, By Polystyrene, 2022 - 2032F |
6.2.6 Zambia Laboratory Plastic Consumables Market Revenues & Volume, By Acrylic, 2022 - 2032F |
6.3 Zambia Laboratory Plastic Consumables Market, By Application |
6.3.1 Overview and Analysis |
6.3.2 Zambia Laboratory Plastic Consumables Market Revenues & Volume, By Clinical Diagnostics, 2022 - 2032F |
6.3.3 Zambia Laboratory Plastic Consumables Market Revenues & Volume, By Biotechnology, 2022 - 2032F |
6.3.4 Zambia Laboratory Plastic Consumables Market Revenues & Volume, By Pharmaceutical Testing, 2022 - 2032F |
6.3.5 Zambia Laboratory Plastic Consumables Market Revenues & Volume, By Chemical Analysis, 2022 - 2032F |
6.3.6 Zambia Laboratory Plastic Consumables Market Revenues & Volume, By Cell Culture, 2022 - 2032F |
6.4 Zambia Laboratory Plastic Consumables Market, By Capacity Range |
6.4.1 Overview and Analysis |
6.4.2 Zambia Laboratory Plastic Consumables Market Revenues & Volume, By Below 100ml, 2022 - 2032F |
6.4.3 Zambia Laboratory Plastic Consumables Market Revenues & Volume, By 100ml-500ml, 2022 - 2032F |
6.4.4 Zambia Laboratory Plastic Consumables Market Revenues & Volume, By 500ml-1000ml, 2022 - 2032F |
6.4.5 Zambia Laboratory Plastic Consumables Market Revenues & Volume, By 1L-5L, 2022 - 2032F |
6.4.6 Zambia Laboratory Plastic Consumables Market Revenues & Volume, By Above 5L, 2022 - 2032F |
6.5 Zambia Laboratory Plastic Consumables Market, By End User |
6.5.1 Overview and Analysis |
6.5.2 Zambia Laboratory Plastic Consumables Market Revenues & Volume, By Hospitals, 2022 - 2032F |
6.5.3 Zambia Laboratory Plastic Consumables Market Revenues & Volume, By Research Labs, 2022 - 2032F |
6.5.4 Zambia Laboratory Plastic Consumables Market Revenues & Volume, By Diagnostic Centers, 2022 - 2032F |
6.5.5 Zambia Laboratory Plastic Consumables Market Revenues & Volume, By Academic Institutes, 2022 - 2032F |
6.5.6 Zambia Laboratory Plastic Consumables Market Revenues & Volume, By Industrial Labs, 2022 - 2032F |
7 Zambia Laboratory Plastic Consumables Market Import-Export Trade Statistics |
7.1 Zambia Laboratory Plastic Consumables Market Export to Major Countries |
7.2 Zambia Laboratory Plastic Consumables Market Imports from Major Countries |
8 Zambia Laboratory Plastic Consumables Market Key Performance Indicators |
8.1 Percentage increase in the number of laboratories utilizing plastic consumables |
8.2 Adoption rate of innovative plastic consumables in laboratories |
8.3 Percentage growth in the use of plastic consumables in research projects |
8.4 Efficiency improvements in laboratory processes due to the use of plastic consumables |
8.5 Rate of compliance with quality standards in the use of plastic consumables |
9 Zambia Laboratory Plastic Consumables Market - Opportunity Assessment |
9.1 Zambia Laboratory Plastic Consumables Market Opportunity Assessment, By Product Type, 2022 & 2032F |
9.2 Zambia Laboratory Plastic Consumables Market Opportunity Assessment, By Material Type, 2022 & 2032F |
9.3 Zambia Laboratory Plastic Consumables Market Opportunity Assessment, By Application, 2022 & 2032F |
9.4 Zambia Laboratory Plastic Consumables Market Opportunity Assessment, By Capacity Range, 2022 & 2032F |
9.5 Zambia Laboratory Plastic Consumables Market Opportunity Assessment, By End User, 2022 & 2032F |
10 Zambia Laboratory Plastic Consumables Market - Competitive Landscape |
10.1 Zambia Laboratory Plastic Consumables Market Revenue Share, By Companies, 2025 |
10.2 Zambia Laboratory Plastic Consumables Market Competitive Benchmarking, By Operating and Technical Parameters |
11 Company Profiles |
12 Recommendations |
13 Disclaimer |
Global Go To Market Strategy - 2030
Export potential enables firms to identify high-growth global markets with greater confidence by combining advanced trade intelligence with a structured quantitative methodology. The framework analyzes emerging demand trends and country-level import patterns while integrating macroeconomic and trade datasets such as GDP and population forecasts, bilateral import–export flows, tariff structures, elasticity differentials between developed and developing economies, geographic distance, and import demand projections. Using weighted trade values from 2020–2024 as the base period to project country-to-country export potential for 2030, these inputs are operationalized through calculated drivers such as gravity model parameters, tariff impact factors, and projected GDP per-capita growth. Through an analysis of hidden potentials, demand hotspots, and market conditions that are most favorable to success, this method enables firms to focus on target countries, maximize returns, and global expansion with data, backed by accuracy.
By factoring in the projected importer demand gap that is currently unmet and could be potential opportunity, it identifies the potential for the Exporter (Country) among 190 countries, against the general trade analysis, which identifies the biggest importer or exporter.
To discover high-growth global markets and optimize your business strategy:
Click Here
Pricing
- Single User License$ 1,995
- Department License$ 2,400
- Site License$ 3,120
- Global License$ 3,795

Leadership Perspectives from Industry Events
Search
Thought Leadership and Analyst Meet


Our Clients
6WResearch In News
- Doha a strategic location for EV manufacturing hub: IPA Qatar
- Demand for luxury TVs surging in the GCC, says Samsung
- Empowering Growth: The Thriving Journey of Bangladesh’s Cable Industry
- Demand for luxury TVs surging in the GCC, says Samsung
- Video call with a traditional healer? Once unthinkable, it’s now common in South Africa
- Intelligent Buildings To Smooth GCC’s Path To Net Zero
Latest Reports
- Taiwan Airport Wireless Infrastructure Market (2026-2032)
- Vietnam Airport Wireless Infrastructure Market (2026-2032)
- Thailand Airport Wireless Infrastructure Market (2026-2032)
- South Korea Airport Wireless Infrastructure Market (2026-2032)
- Romania Airport Wireless Infrastructure Market (2026-2032)
- Qatar Airport Wireless Infrastructure Market (2026-2032)
- Philippines Airport Wireless Infrastructure Market (2026-2032)
- Japan Airport Wireless Infrastructure Market (2026-2032)
- Taiwan Airport Winter Services Market (2026-2032)
- Vietnam Airport Winter Services Market (2026-2032)
Industry Events and Analyst Meet

HIMTEX 2026

India Refining Summit 2026

India EV Show 2026

EV tech India Expo 2026

Auto Tech Asia 2026
Whitepaper
- Middle East & Africa Commercial Security Market Click here to view more.
- Middle East & Africa Fire Safety Systems & Equipment Market Click here to view more.
- GCC Drone Market Click here to view more.
- Middle East Lighting Fixture Market Click here to view more.
- GCC Physical & Perimeter Security Market Click here to view more.