Zambia Space DC-DC Converter Market (2025-2031) | Growth, Trends, Size, Value, Forecast, Analysis, Share, Companies, Revenue, Segmentation, Industry & Outlook
Market Forecast By Type (Isolated, Non-Isolated), By Form Factor (Chassis Mount, Enclosed, Brick, Discrete), By Input Voltage (<12V, 12-40V, 42-75V, >75V), By Platform (Satellites, Capsules/Cargos, Interplanetary Spacecraft & Probes, Rovers/Spacecraft Landers, Launch Vehicles), By Application (Altitude & Orbital Control Systems, Surface Mobility and Navigation Systems, Command & Data Handling Systems, Environmental Monitoring Systems, Satellite Thermal Power Box, Electric Power Subsystems, Others), By Output Voltage (3.3V, 5V, 12V, 15V, 28V), By Output Power (<10W, 10-29W, 30-99W, 100-250W, 251-500W, 501-1000W, >1000W) And Competitive Landscape
| Product Code: ETC5864474 | Publication Date: Nov 2023 | Updated Date: Dec 2025 | Product Type: Market Research Report | |
| Publisher: 6Wresearch | Author: Ravi Bhandari | No. of Pages: 60 | No. of Figures: 30 | No. of Tables: 5 |
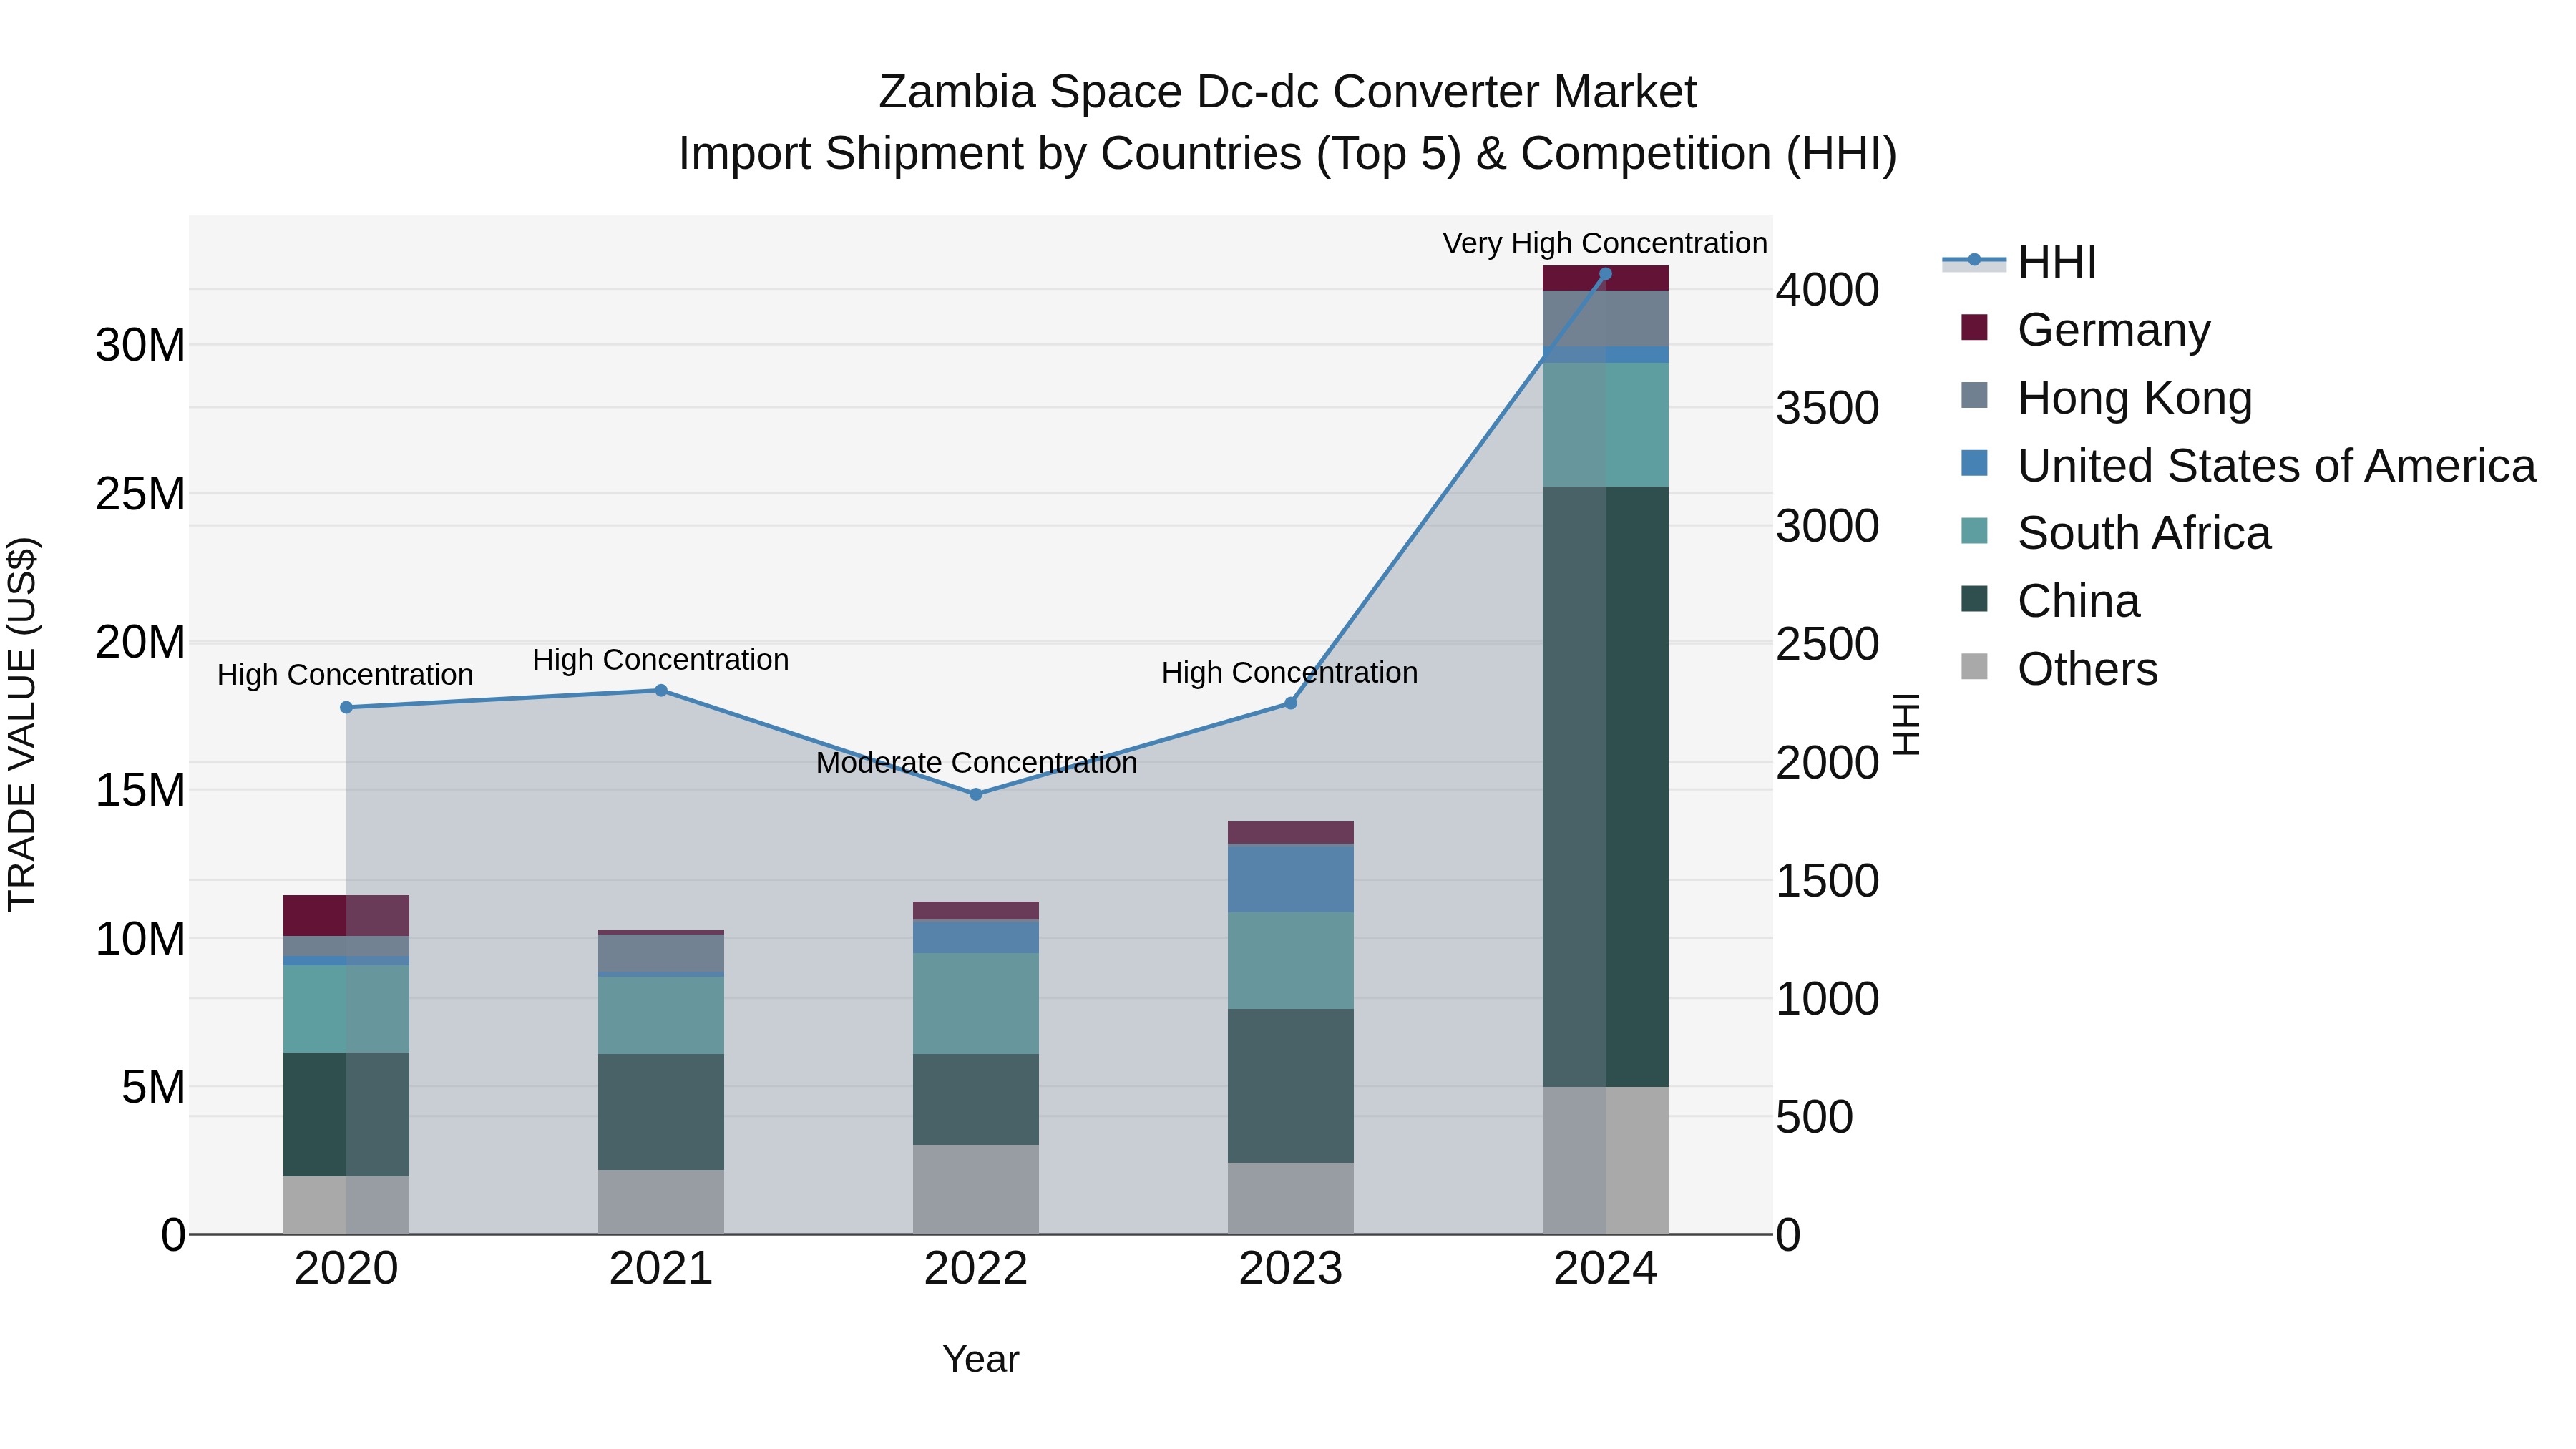
Zambia Space Dc-dc Converter Market: Top 5 Importing Countries and Market Competition (HHI) Analysis
The Zambia space DC-DC converter import market saw a significant increase in concentration levels in 2024, with top exporting countries being China, South Africa, Hong Kong, Japan, and Germany. The Herfindahl-Hirschman Index (HHI) indicated very high concentration, reflecting a competitive landscape dominated by a few key players. The impressive Compound Annual Growth Rate (CAGR) of 30.01% from 2020 to 2024 highlights the market`s rapid expansion. Moreover, the remarkable growth rate of 134.75% from 2023 to 2024 underscores the increasing demand for DC-DC converters in Zambia`s space sector.
Key Highlights of the Report:
- Zambia Space DC-DC Converter Market Outlook
- Market Size of Zambia Space DC-DC Converter Market, 2024
- Forecast of Zambia Space DC-DC Converter Market, 2031
- Historical Data and Forecast of Zambia Space DC-DC Converter Revenues & Volume for the Period 2021-2031
- Zambia Space DC-DC Converter Market Trend Evolution
- Zambia Space DC-DC Converter Market Drivers and Challenges
- Zambia Space DC-DC Converter Price Trends
- Zambia Space DC-DC Converter Porter`s Five Forces
- Zambia Space DC-DC Converter Industry Life Cycle
- Historical Data and Forecast of Zambia Space DC-DC Converter Market Revenues & Volume By Type for the Period 2021-2031
- Historical Data and Forecast of Zambia Space DC-DC Converter Market Revenues & Volume By Isolated for the Period 2021-2031
- Historical Data and Forecast of Zambia Space DC-DC Converter Market Revenues & Volume By Non-Isolated for the Period 2021-2031
- Historical Data and Forecast of Zambia Space DC-DC Converter Market Revenues & Volume By Form Factor for the Period 2021-2031
- Historical Data and Forecast of Zambia Space DC-DC Converter Market Revenues & Volume By Chassis Mount for the Period 2021-2031
- Historical Data and Forecast of Zambia Space DC-DC Converter Market Revenues & Volume By Enclosed for the Period 2021-2031
- Historical Data and Forecast of Zambia Space DC-DC Converter Market Revenues & Volume By Brick for the Period 2021-2031
- Historical Data and Forecast of Zambia Space DC-DC Converter Market Revenues & Volume By Discrete for the Period 2021-2031
- Historical Data and Forecast of Zambia Space DC-DC Converter Market Revenues & Volume By Input Voltage for the Period 2021-2031
- Historical Data and Forecast of Zambia Space DC-DC Converter Market Revenues & Volume By <12V for the Period 2021-2031
- Historical Data and Forecast of Zambia Space DC-DC Converter Market Revenues & Volume By 12-40V for the Period 2021-2031
- Historical Data and Forecast of Zambia Space DC-DC Converter Market Revenues & Volume By 42-75V for the Period 2021-2031
- Historical Data and Forecast of Zambia Space DC-DC Converter Market Revenues & Volume By >75V for the Period 2021-2031
- Historical Data and Forecast of Zambia Space DC-DC Converter Market Revenues & Volume By Platform for the Period 2021-2031
- Historical Data and Forecast of Zambia Space DC-DC Converter Market Revenues & Volume By Satellites for the Period 2021-2031
- Historical Data and Forecast of Zambia Space DC-DC Converter Market Revenues & Volume By Capsules/Cargos for the Period 2021-2031
- Historical Data and Forecast of Zambia Space DC-DC Converter Market Revenues & Volume By Interplanetary Spacecraft & Probes for the Period 2021-2031
- Historical Data and Forecast of Zambia Space DC-DC Converter Market Revenues & Volume By Rovers/Spacecraft Landers for the Period 2021-2031
- Historical Data and Forecast of Zambia Space DC-DC Converter Market Revenues & Volume By Launch Vehicles for the Period 2021-2031
- Historical Data and Forecast of Zambia Space DC-DC Converter Market Revenues & Volume By Application for the Period 2021-2031
- Historical Data and Forecast of Zambia Space DC-DC Converter Market Revenues & Volume By Altitude & Orbital Control Systems for the Period 2021-2031
- Historical Data and Forecast of Zambia Space DC-DC Converter Market Revenues & Volume By Surface Mobility and Navigation Systems for the Period 2021-2031
- Historical Data and Forecast of Zambia Space DC-DC Converter Market Revenues & Volume By Command & Data Handling Systems for the Period 2021-2031
- Historical Data and Forecast of Zambia Space DC-DC Converter Market Revenues & Volume By Environmental Monitoring Systems for the Period 2021-2031
- Historical Data and Forecast of Zambia Space DC-DC Converter Market Revenues & Volume By Satellite Thermal Power Box for the Period 2021-2031
- Historical Data and Forecast of Zambia Space DC-DC Converter Market Revenues & Volume By Electric Power Subsystems for the Period 2021-2031
- Historical Data and Forecast of Zambia Space DC-DC Converter Market Revenues & Volume By Others for the Period 2021-2031
- Historical Data and Forecast of Zambia Space DC-DC Converter Market Revenues & Volume By Output Voltage for the Period 2021-2031
- Historical Data and Forecast of Zambia Space DC-DC Converter Market Revenues & Volume By 3.3V for the Period 2021-2031
- Historical Data and Forecast of Zambia Space DC-DC Converter Market Revenues & Volume By 5V for the Period 2021-2031
- Historical Data and Forecast of Zambia Space DC-DC Converter Market Revenues & Volume By 12V for the Period 2021-2031
- Historical Data and Forecast of Zambia Space DC-DC Converter Market Revenues & Volume By 15V for the Period 2021-2031
- Historical Data and Forecast of Zambia Space DC-DC Converter Market Revenues & Volume By 28V for the Period 2021-2031
- Historical Data and Forecast of Zambia Space DC-DC Converter Market Revenues & Volume By Output Power for the Period 2021-2031
- Historical Data and Forecast of Zambia Space DC-DC Converter Market Revenues & Volume By <10W for the Period 2021-2031
- Historical Data and Forecast of Zambia Space DC-DC Converter Market Revenues & Volume By 10-29W for the Period 2021-2031
- Historical Data and Forecast of Zambia Space DC-DC Converter Market Revenues & Volume By 30-99W for the Period 2021-2031
- Historical Data and Forecast of Zambia Space DC-DC Converter Market Revenues & Volume By 100-250W for the Period 2021-2031
- Historical Data and Forecast of Zambia Space DC-DC Converter Market Revenues & Volume By 251-500W for the Period 2021-2031
- Historical Data and Forecast of Zambia Space DC-DC Converter Market Revenues & Volume By 501-1000W for the Period 2021-2031
- Historical Data and Forecast of Zambia Space DC-DC Converter Market Revenues & Volume By >1000W for the Period 2021-2031
- Zambia Space DC-DC Converter Import Export Trade Statistics
- Market Opportunity Assessment By Type
- Market Opportunity Assessment By Form Factor
- Market Opportunity Assessment By Input Voltage
- Market Opportunity Assessment By Platform
- Market Opportunity Assessment By Application
- Market Opportunity Assessment By Output Voltage
- Market Opportunity Assessment By Output Power
- Zambia Space DC-DC Converter Top Companies Market Share
- Zambia Space DC-DC Converter Competitive Benchmarking By Technical and Operational Parameters
- Zambia Space DC-DC Converter Company Profiles
- Zambia Space DC-DC Converter Key Strategic Recommendations
Frequently Asked Questions About the Market Study (FAQs):
6Wresearch actively monitors the Zambia Space DC-DC Converter Market and publishes its comprehensive annual report, highlighting emerging trends, growth drivers, revenue analysis, and forecast outlook. Our insights help businesses to make data-backed strategic decisions with ongoing market dynamics. Our analysts track relevent industries related to the Zambia Space DC-DC Converter Market, allowing our clients with actionable intelligence and reliable forecasts tailored to emerging regional needs.
Yes, we provide customisation as per your requirements. To learn more, feel free to contact us on sales@6wresearch.com
1 Executive Summary |
2 Introduction |
2.1 Key Highlights of the Report |
2.2 Report Description |
2.3 Market Scope & Segmentation |
2.4 Research Methodology |
2.5 Assumptions |
3 Zambia Space DC-DC Converter Market Overview |
3.1 Zambia Country Macro Economic Indicators |
3.2 Zambia Space DC-DC Converter Market Revenues & Volume, 2021 & 2031F |
3.3 Zambia Space DC-DC Converter Market - Industry Life Cycle |
3.4 Zambia Space DC-DC Converter Market - Porter's Five Forces |
3.5 Zambia Space DC-DC Converter Market Revenues & Volume Share, By Type, 2021 & 2031F |
3.6 Zambia Space DC-DC Converter Market Revenues & Volume Share, By Form Factor, 2021 & 2031F |
3.7 Zambia Space DC-DC Converter Market Revenues & Volume Share, By Input Voltage, 2021 & 2031F |
3.8 Zambia Space DC-DC Converter Market Revenues & Volume Share, By Platform, 2021 & 2031F |
3.9 Zambia Space DC-DC Converter Market Revenues & Volume Share, By Application, 2021 & 2031F |
3.10 Zambia Space DC-DC Converter Market Revenues & Volume Share, By Output Voltage, 2021 & 2031F |
3.11 Zambia Space DC-DC Converter Market Revenues & Volume Share, By Output Power, 2021 & 2031F |
4 Zambia Space DC-DC Converter Market Dynamics |
4.1 Impact Analysis |
4.2 Market Drivers |
4.2.1 Increasing demand for compact and efficient power conversion solutions in the space industry |
4.2.2 Growing investments in space exploration and satellite technology in Zambia |
4.2.3 Technological advancements leading to the development of more sophisticated and reliable DC-DC converters |
4.3 Market Restraints |
4.3.1 High initial investment required for setting up manufacturing facilities for DC-DC converters |
4.3.2 Stringent regulatory requirements and quality standards in the space industry |
4.3.3 Limited availability of skilled workforce with expertise in designing and manufacturing space-grade DC-DC converters |
5 Zambia Space DC-DC Converter Market Trends |
6 Zambia Space DC-DC Converter Market Segmentations |
6.1 Zambia Space DC-DC Converter Market, By Type |
6.1.1 Overview and Analysis |
6.1.2 Zambia Space DC-DC Converter Market Revenues & Volume, By Isolated, 2021-2031F |
6.1.3 Zambia Space DC-DC Converter Market Revenues & Volume, By Non-Isolated, 2021-2031F |
6.2 Zambia Space DC-DC Converter Market, By Form Factor |
6.2.1 Overview and Analysis |
6.2.2 Zambia Space DC-DC Converter Market Revenues & Volume, By Chassis Mount, 2021-2031F |
6.2.3 Zambia Space DC-DC Converter Market Revenues & Volume, By Enclosed, 2021-2031F |
6.2.4 Zambia Space DC-DC Converter Market Revenues & Volume, By Brick, 2021-2031F |
6.2.5 Zambia Space DC-DC Converter Market Revenues & Volume, By Discrete, 2021-2031F |
6.3 Zambia Space DC-DC Converter Market, By Input Voltage |
6.3.1 Overview and Analysis |
6.3.2 Zambia Space DC-DC Converter Market Revenues & Volume, By <12V, 2021-2031F |
6.3.3 Zambia Space DC-DC Converter Market Revenues & Volume, By 12-40V, 2021-2031F |
6.3.4 Zambia Space DC-DC Converter Market Revenues & Volume, By 42-75V, 2021-2031F |
6.3.5 Zambia Space DC-DC Converter Market Revenues & Volume, By >75V, 2021-2031F |
6.4 Zambia Space DC-DC Converter Market, By Platform |
6.4.1 Overview and Analysis |
6.4.2 Zambia Space DC-DC Converter Market Revenues & Volume, By Satellites, 2021-2031F |
6.4.3 Zambia Space DC-DC Converter Market Revenues & Volume, By Capsules/Cargos, 2021-2031F |
6.4.4 Zambia Space DC-DC Converter Market Revenues & Volume, By Interplanetary Spacecraft & Probes, 2021-2031F |
6.4.5 Zambia Space DC-DC Converter Market Revenues & Volume, By Rovers/Spacecraft Landers, 2021-2031F |
6.4.6 Zambia Space DC-DC Converter Market Revenues & Volume, By Launch Vehicles, 2021-2031F |
6.5 Zambia Space DC-DC Converter Market, By Application |
6.5.1 Overview and Analysis |
6.5.2 Zambia Space DC-DC Converter Market Revenues & Volume, By Altitude & Orbital Control Systems, 2021-2031F |
6.5.3 Zambia Space DC-DC Converter Market Revenues & Volume, By Surface Mobility and Navigation Systems, 2021-2031F |
6.5.4 Zambia Space DC-DC Converter Market Revenues & Volume, By Command & Data Handling Systems, 2021-2031F |
6.5.5 Zambia Space DC-DC Converter Market Revenues & Volume, By Environmental Monitoring Systems, 2021-2031F |
6.5.6 Zambia Space DC-DC Converter Market Revenues & Volume, By Satellite Thermal Power Box, 2021-2031F |
6.5.7 Zambia Space DC-DC Converter Market Revenues & Volume, By Electric Power Subsystems, 2021-2031F |
6.6 Zambia Space DC-DC Converter Market, By Output Voltage |
6.6.1 Overview and Analysis |
6.6.2 Zambia Space DC-DC Converter Market Revenues & Volume, By 3.3V, 2021-2031F |
6.6.3 Zambia Space DC-DC Converter Market Revenues & Volume, By 5V, 2021-2031F |
6.6.4 Zambia Space DC-DC Converter Market Revenues & Volume, By 12V, 2021-2031F |
6.6.5 Zambia Space DC-DC Converter Market Revenues & Volume, By 15V, 2021-2031F |
6.6.6 Zambia Space DC-DC Converter Market Revenues & Volume, By 28V, 2021-2031F |
6.7 Zambia Space DC-DC Converter Market, By Output Power |
6.7.1 Overview and Analysis |
6.7.2 Zambia Space DC-DC Converter Market Revenues & Volume, By <10W, 2021-2031F |
6.7.3 Zambia Space DC-DC Converter Market Revenues & Volume, By 10-29W, 2021-2031F |
6.7.4 Zambia Space DC-DC Converter Market Revenues & Volume, By 100-250W, 2021-2031F |
6.7.5 Zambia Space DC-DC Converter Market Revenues & Volume, By 100-250W, 2021-2031F |
6.7.6 Zambia Space DC-DC Converter Market Revenues & Volume, By 251-500W, 2021-2031F |
6.7.7 Zambia Space DC-DC Converter Market Revenues & Volume, By 501-1000W, 2021-2031F |
7 Zambia Space DC-DC Converter Market Import-Export Trade Statistics |
7.1 Zambia Space DC-DC Converter Market Export to Major Countries |
7.2 Zambia Space DC-DC Converter Market Imports from Major Countries |
8 Zambia Space DC-DC Converter Market Key Performance Indicators |
8.1 Efficiency improvement rate of DC-DC converters |
8.2 Adoption rate of advanced materials and technologies in DC-DC converter manufacturing |
8.3 Number of research and development partnerships for innovation in space-grade power conversion solutions |
9 Zambia Space DC-DC Converter Market - Opportunity Assessment |
9.1 Zambia Space DC-DC Converter Market Opportunity Assessment, By Type, 2021 & 2031F |
9.2 Zambia Space DC-DC Converter Market Opportunity Assessment, By Form Factor, 2021 & 2031F |
9.3 Zambia Space DC-DC Converter Market Opportunity Assessment, By Input Voltage, 2021 & 2031F |
9.4 Zambia Space DC-DC Converter Market Opportunity Assessment, By Platform, 2021 & 2031F |
9.5 Zambia Space DC-DC Converter Market Opportunity Assessment, By Application, 2021 & 2031F |
9.6 Zambia Space DC-DC Converter Market Opportunity Assessment, By Output Voltage, 2021 & 2031F |
9.7 Zambia Space DC-DC Converter Market Opportunity Assessment, By Output Power, 2021 & 2031F |
10 Zambia Space DC-DC Converter Market - Competitive Landscape |
10.1 Zambia Space DC-DC Converter Market Revenue Share, By Companies, 2024 |
10.2 Zambia Space DC-DC Converter Market Competitive Benchmarking, By Operating and Technical Parameters |
11 Company Profiles |
12 Recommendations | 13 Disclaimer |
Export potential assessment - trade Analytics for 2030
Export potential enables firms to identify high-growth global markets with greater confidence by combining advanced trade intelligence with a structured quantitative methodology. The framework analyzes emerging demand trends and country-level import patterns while integrating macroeconomic and trade datasets such as GDP and population forecasts, bilateral import–export flows, tariff structures, elasticity differentials between developed and developing economies, geographic distance, and import demand projections. Using weighted trade values from 2020–2024 as the base period to project country-to-country export potential for 2030, these inputs are operationalized through calculated drivers such as gravity model parameters, tariff impact factors, and projected GDP per-capita growth. Through an analysis of hidden potentials, demand hotspots, and market conditions that are most favorable to success, this method enables firms to focus on target countries, maximize returns, and global expansion with data, backed by accuracy.
By factoring in the projected importer demand gap that is currently unmet and could be potential opportunity, it identifies the potential for the Exporter (Country) among 190 countries, against the general trade analysis, which identifies the biggest importer or exporter.
To discover high-growth global markets and optimize your business strategy:
Click Here
Pricing
- Single User License$ 1,995
- Department License$ 2,400
- Site License$ 3,120
- Global License$ 3,795

Search
Thought Leadership and Analyst Meet


Our Clients
Latest Reports
- United Kingdom (UK) Long-term Care Insurance Market (2026-2032) | Growth, Share, Consumer Insights, Drivers, Opportunities, Competition, Pricing Analysis, Segments, Restraints, Companies, Competitive, Value, Outlook, Size, Demand, Analysis, Challenges, Strategic Insights, Investment Trends, Revenue, Trends, Supply, Forecast
- United Kingdom (UK) Long Term Care Market (2026-2032) | Companies, Outlook, Analysis, Trends, Value, Revenue, Segmentation, Share, Forecast, Competitive Landscape, Growth, Size & Forecast
- Iraq Insulation and Waterproofing Market (2026-2032) | Outlook, Drivers, Growth, Size, Share, Industry, Revenue, Trends, Demand, Competitive, Strategic Insights, Opportunities, Segments, Companies, Challenges, Strategy, Consumer Insights, Analysis, Investment Trends, Value, Segmentation, Forecast, Restraints
- India Switchgear Market Outlook (2026 - 2032) | Size, Share, Trends, Growth, Revenue, Forecast, Analysis, Value, Outlook
- Pakistan Contraceptive Implants Market (2025-2031) | Demand, Growth, Size, Share, Industry, Pricing Analysis, Competitive, Strategic Insights, Strategy, Consumer Insights, Analysis, Investment Trends, Opportunities, Revenue, Segments, Value, Segmentation, Supply, Forecast, Restraints, Outlook, Competition, Drivers, Trends, Companies, Challenges
- Sri Lanka Packaging Market (2026-2032) | Outlook, Competition, Drivers, Trends, Demand, Pricing Analysis, Competitive, Strategic Insights, Companies, Challenges, Strategy, Consumer Insights, Analysis, Investment Trends, Opportunities, Growth, Size, Share, Industry, Revenue, Segments, Value, Segmentation, Supply, Forecast, Restraints
- India Kids Watches Market (2026-2032) | Strategy, Consumer Insights, Analysis, Investment Trends, Opportunities, Growth, Size, Share, Industry, Revenue, Segments, Value, Segmentation, Supply, Forecast, Restraints, Outlook, Competition, Drivers, Trends, Demand, Pricing Analysis, Competitive, Strategic Insights, Companies, Challenges
- Saudi Arabia Core Assurance Service Market (2025-2031) | Strategy, Consumer Insights, Analysis, Investment Trends, Opportunities, Growth, Size, Share, Industry, Revenue, Segments, Value, Segmentation, Supply, Forecast, Restraints, Outlook, Competition, Drivers, Trends, Demand, Pricing Analysis, Competitive, Strategic Insights, Companies, Challenges
- Romania Uninterruptible Power Supply (UPS) Market (2026-2032) | Industry, Analysis, Revenue, Size, Forecast, Outlook, Value, Trends, Share, Growth & Companies
- Saudi Arabia Car Window Tinting Film, Paint Protection Film (PPF), and Ceramic Coating Market (2025-2031) | Strategy, Consumer Insights, Analysis, Investment Trends, Opportunities, Growth, Size, Share, Industry, Revenue, Segments, Value, Segmentation, Supply, Forecast, Restraints, Outlook, Competition, Drivers, Trends, Demand, Pricing Analysis, Competitive, Strategic Insights, Companies, Challenges
Industry Events and Analyst Meet

India EV Show 2026

EV tech India Expo 2026

Auto Tech Asia 2026

Battery Tech India 2026

Smart Production Solutions Guangzhou 2026
Whitepaper
- Middle East & Africa Commercial Security Market Click here to view more.
- Middle East & Africa Fire Safety Systems & Equipment Market Click here to view more.
- GCC Drone Market Click here to view more.
- Middle East Lighting Fixture Market Click here to view more.
- GCC Physical & Perimeter Security Market Click here to view more.
6WResearch In News
- Doha a strategic location for EV manufacturing hub: IPA Qatar
- Demand for luxury TVs surging in the GCC, says Samsung
- Empowering Growth: The Thriving Journey of Bangladesh’s Cable Industry
- Demand for luxury TVs surging in the GCC, says Samsung
- Video call with a traditional healer? Once unthinkable, it’s now common in South Africa
- Intelligent Buildings To Smooth GCC’s Path To Net Zero