 1. Executive Summary
2. Introduction
2.1 Report Description
2.2 Key Highlights of The Report
2.3 Market Scope & Segmentation
2.4 Research Methodology
2.5 Assumption
3. Myanmar UPS Systems Market Overview
3.1 Myanmar Country Overview
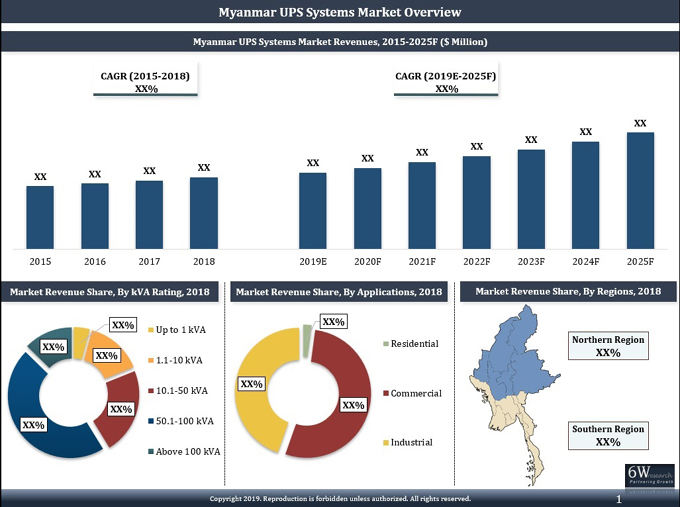
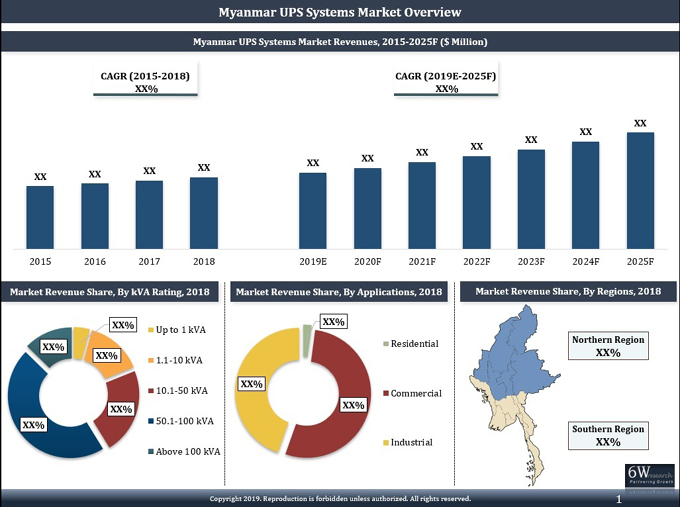
3.2 Myanmar UPS Systems Market Revenues & Volume (2015-2025F)
3.3 Myanmar UPS Systems Market Revenue Share, By kVA Rating (2018 & 2025F)
3.4 Myanmar UPS Systems Market Volume Share, By kVA Rating (2018 & 2025F)
3.5 Myanmar UPS Systems Market Revenue Share, By Phases (2018 & 2025F)
3.6 Myanmar UPS Systems Market Volume Share, By Phases (2018 & 2025F)
3.7 Myanmar UPS Systems Market Revenue Share, By Applications (2018 & 2025F)
3.8 Myanmar UPS Systems Market Volume Share, By Applications (2018 & 2025F)
3.9 Myanmar UPS Systems Market Revenue Share, By Regions (2018 & 2025F)
3.10 Myanmar UPS Systems Market Industry Life Cycle
3.11 Myanmar UPS Systems Market - Porter's Five Forces Model
4. Myanmar UPS Systems Market Dynamics
4.1 Impact Analysis
4.2 Market Drivers
4.3 Market Restraints
5. Myanmar UPS Systems Market Trends
6. Myanmar UPS Systems Market Overview, By kVA Rating
6.1 Myanmar Up to 1 kVA UPS Systems Market Revenues & Volume, 2015-2025F
6.1.1 Myanmar Up to 1 kVA UPS Systems Market Revenues & Volume, By Applications, 2015-2025F
6.2 Myanmar 1.1-10 kVA UPS Systems Market Revenues & Volume, 2015-2025F
6.2.1 Myanmar 1.1-100 kVA UPS Systems Market Revenues & Volume, By Applications, 2015-2025F
6.3 Myanmar 10.1-50 kVA UPS Systems Market Revenues & Volume, 2015-2025F
6.3.1 Myanmar 10.1-50 kVA UPS Systems Market Revenues & Volume, By Applications, 2015-2025F
6.4 Myanmar 50.1-100 kVA UPS Systems Market Revenues & Volume, 2015-2025F
6.4.1 Myanmar 50.1-100 kVA UPS Systems Market Revenues & Volume, By Applications, 2015-2025F
6.5 Myanmar Above 100 kVA UPS Systems Market Revenues & Volume, 2015-2025F
6.5.1 Myanmar Above 100 kVA UPS Systems Market Revenues & Volume, By Applications, 2015-2025F
7. Myanmar UPS Systems Market Overview, By Phases
7.1 Myanmar 1-Phase UPS Systems Market Revenues & Volume, 2015-2025F
7.2 Myanmar 3-Phase UPS Systems Market Revenues & Volume, 2015-2025F
8. Myanmar UPS Systems Market Overview, By Applications
8.1 Myanmar Residential Applications UPS Systems Market Revenues & Volume, 2015-2025F
8.1.1 Myanmar Residential Sector Outlook
8.2 Myanmar Commercial Applications UPS Systems Market Revenues & Volume, 2015-2025F
8.2.1 Myanmar Commercial Applications UPS Systems Market Revenues, By Sub-Segment, 2015-2025F
8.2.2 Myanmar Commercial Sector Outlook
8.3 Myanmar Industrial Applications UPS Systems Market Revenues & Volume, 2015-2025F
8.3.1 Myanmar Industrial Sector Outlook
9. Myanmar UPS Systems Market Overview, By Regions
9.1 Northern Myanmar UPS Systems Market Revenues, 2015-2025F
9.2 Southern Myanmar UPS Systems Market Revenues, 2015-2025F
10. Myanmar UPS Systems Market Key Performance Indicators
10.1 Myanmar Government Spending Outlook
10.2 Myanmar Construction Sector Outlook
10.3 Myanmar Tourism Spending Outlook
10.4 Myanmar Urban Development Plan 2040
11. Myanmar UPS Systems Market Opportunity Assessment
11.1 Myanmar UPS Systems Market Opportunity Assessment, By kVA Rating
11.2 Myanmar UPS Systems Market Opportunity Assessment, By Applications
12. Competitive Landscape
12.1 Myanmar UPS Systems Market Revenue Share, By Company, 2018
12.2 Myanmar UPS Systems Market Competitive Benchmarking, By kVA Rating
13. Company Profiles
13.1 Eaton Corporation Plc
13.2 Schneider Electric SE
13.3 Vertiv Co.
13.4 Socomec Group S.A
13.5 Delta Electronics (Myanmar) Company Limited
13.6 GE Myanmar
13.7 ABB Limited (Myanmar Branch)
13.8 Fuji Electric Co., Ltd (Myanmar Branch Office)
14. Key Strategic Recommendations
15. Disclaimer
List of Figures
Figure1. Myanmar UPS Systems Market Revenues & Volume, 2015-2025F ($ Million, Units)
Figure2. Myanmar UPS Systems Market Revenue Share, By kVA Rating, 2018 & 2025F
Figure3. Myanmar UPS Systems Market Volume Share, By kVA Rating, 2018 & 2025F
Figure4. Myanmar UPS Systems Market Revenue Share, By Phases, 2018 & 2025F
Figure5. Myanmar UPS Systems Market Volume Share, By Phases, 2018 & 2025F
Figure6. Myanmar UPS Systems Market Revenue Share, By Applications, 2018 & 2025F
Figure7. Myanmar UPS Systems Market Volume Share, By Applications, 2018 & 2025F
Figure8. Myanmar UPS Systems Market Revenue Share, By Regions, 2018 & 2025F
Figure9. Myanmar UPS Systems Market Industry Life Cycle, 2018
Figure10. Myanmar GDP Growth Rate, 2011-2018 (%)
Figure11. Myanmar Breakdown of Total Contribution of Travel & Tourism to GDP, 2017
Figure12. Myanmar Total Contribution of Travel & Tourism to GDP, 2017-2028 (Kyat Millions)
Figure13. Myanmar Total Contribution of Travel & Tourism to GDP, 2017-2028 (%)
Figure14. Myanmar Up to 1 kVA UPS Systems Market Revenues & Volume, 2015-2025F ($ Thousand, Units)
Figure15. Myanmar 1.1-10 kVA UPS Systems Market Revenues & Volume, 2015-2025F ($ Thousand, Units)
Figure16. Myanmar 10.1-50 kVA UPS Systems Market Revenues & Volume, 2015-2025F ($ Thousand, Units)
Figure17. Myanmar 50.1-100 kVA UPS Systems Market Revenues & Volume, 2015-2025F ($ Thousand, Units)
Figure18. Myanmar Above 100 kVA UPS Systems Market Revenues & Volume, 2015-2025F ($ Thousand, Units)
Figure19. Myanmar 1-Phase UPS Systems Market Revenues & Volume, 2015-2025F ($ Thousand, Units)
Figure20. Myanmar 3-Phase UPS Systems Market Revenues & Volume, 2015-2025F ($ Thousand, Units)
Figure21. Myanmar Residential Application UPS Systems Market Revenues & Volume, 2015-2025F ($ Thousand, Units)
Figure22. Yangon Serviced Apartment Cumulative Room Stock, 2011-2020 (Units)
Figure23. Mandalay Condominium Cumulative Supply, 2014-2019 (Units)
Figure24. Myanmar Commercial Application UPS Systems Market Revenues & Volume, 2015-2025F ($ Thousand, Units)
Figure25. Yangon Retail Supply Stock, 2011-2020 (GLA sq.m.)
Figure26. Mandalay Retail Supply Stock, 2011-2019 (GLA sq.m.)
Figure27. Myanmar Industrial Application UPS Systems Market Revenues & Volume, 2015-2025F ($ Thousand, Units)
Figure28. Myanmar Foreign Direct Investment in Manufacturing Per Fiscal Year, 2012-2017 ($ Million)
Figure29. Myanmar Yearly Approved Amount of Foreign Investment (Till 31.1.2018) ($ Million)
Figure30. Myanmar Share of Permitted FDI, by Sector (1988-2017)
Figure31. Northern Myanmar UPS Systems Market Revenues & Volume, 2015-2025F ($ Thousand)
Figure32. Southern Myanmar UPS Systems Market Revenues & Volume, 2015-2025F ($ Thousand)
Figure33. Myanmar Actual Government Spending Vs Actual Government Revenues, 2014-2023F (Burmese kyat Trillion)
Figure34. Myanmar Total Investment as a Percent of GDP, 2014-2022F
Figure35. Myanmar Construction Industry Value by Sector, 2011 - 2016
Figure36. Myanmar Infrastructure Investment Forecast, 2017-2040 ($ Billion)
Figure37. Myanmar Infrastructure Investment Forecast, By Sector, 2017-2040 ($ Billion)
Figure38. Myanmar Foreign Visitor Arrivals, 2015-2025F (Million Person)
Figure39. International Arrivals in Myanmar, By Continents (2018)
Figure40. Upcoming Urban Development Plans
Figure41. Myanmar UPS Systems Market Opportunity Assessment, By kVA Rating, 2025F
Figure42. Myanmar UPS Systems Market Opportunity Assessment, By Applications, 2025F
Figure43. Myanmar UPS Systems Market Revenue Share, By Company, 2018
List of Tables
Table1. Upcoming Construction Projects in Myanmar
Table2. Myanmar Up to 1 kVA UPS Systems Market Revenues, By Applications, 2015-2025F ($ Thousand)
Table3. Myanmar Up to 1 kVA UPS Systems Market Volume, By Applications, 2015-2025F (Units)
Table4. Myanmar 1.1-10 kVA UPS Systems Market Revenues, By Applications, 2015-2025F ($ Thousand)
Table5. Myanmar 1.1-10 kVA UPS Systems Market Volume, By Applications, 2015-2025F (Units)
Table6. Myanmar 10.1-50 kVA UPS Systems Market Revenues, By Applications, 2015-2025F ($ Thousand)
Table7. Myanmar 10.1-50 kVA UPS Systems Market Volume, By Applications, 2015-2025F (Units)
Table8. Myanmar 50.1-100 kVA UPS Systems Market Revenues, By Applications, 2015-2025F ($ Thousand)
Table9. Myanmar 50.1-100 kVA UPS Systems Market Volume, By Applications, 2015-2025F (Units)
Table10. Myanmar Above 100 kVA UPS Systems Market Revenues, By Applications, 2015-2025F ($ Thousand)
Table11. Myanmar Above 100 kVA UPS Systems Market Volume, By Applications, 2015-2025F (Units)
Table12. Myanmar UPS Systems Market Revenues, Commercial Sub-Segment, 2015-2018 ($ Thousand)
Table13. Myanmar UPS Systems Market Revenues, Commercial Sub-Segment, 2018E-2024F ($ Thousand)
Table14. Myanmar Upcoming Commercial Projects
Table15. Myanmar Foreign Direct Investment in Manufacturing Per Fiscal Year ($ Million)
Table16. Myanmar Functional Expenditure Allocation, 2013 - 2020
Global Go To Market Strategy - 2030
Export potential enables firms to identify high-growth global markets with greater confidence by combining advanced trade intelligence with a structured quantitative methodology. The framework analyzes emerging demand trends and country-level import patterns while integrating macroeconomic and trade datasets such as GDP and population forecasts, bilateral import–export flows, tariff structures, elasticity differentials between developed and developing economies, geographic distance, and import demand projections. Using weighted trade values from 2020–2024 as the base period to project country-to-country export potential for 2030, these inputs are operationalized through calculated drivers such as gravity model parameters, tariff impact factors, and projected GDP per-capita growth. Through an analysis of hidden potentials, demand hotspots, and market conditions that are most favorable to success, this method enables firms to focus on target countries, maximize returns, and global expansion with data, backed by accuracy.
By factoring in the projected importer demand gap that is currently unmet and could be potential opportunity, it identifies the potential for the Exporter (Country) among 190 countries, against the general trade analysis, which identifies the biggest importer or exporter.
To discover high-growth global markets and optimize your business strategy:
Click Here