Oman Interactive Tables Market (2026-2032) Outlook | Value, Industry, Trends, Companies, Share, Forecast, Size, Analysis, Growth & Revenue
Market Forecast By Technology (LCD, LED, Capacitive, Others), By Screen Size (32-65 Inch, 65 Inch & Above), By Application (Exhibition & Trade Shows, Education, Retail, Control Room, Hospitality, Transportation, Others) And Competitive Landscape
| Product Code: ETC275083 | Publication Date: Aug 2022 | Updated Date: Jul 2026 | Product Type: Market Research Report | |
| Publisher: 6Wresearch | Author: Ravi Bhandari | No. of Pages: 75 | No. of Figures: 35 | No. of Tables: 20 |
Oman Interactive Tables Market Size, Share & Growth Rate
The Oman Interactive Tables Market was estimated at USD 364 Million in 2025 and is projected to reach USD 494 Million by 2032, growing at a CAGR of 4.5% from 2026 to 2032. This promising trajectory is fueled by a rising demand for innovative customer engagement solutions, particularly within the hospitality and entertainment sectors. As businesses increasingly adopt digital technologies to create immersive experiences, interactive tables are becoming a focal point for enhancing interactivity and collaboration.
Oman Interactive Tables Market Year-wise Growth Rate and Key Drivers
This graph highlights how the Oman Interactive Tables Market has steadily grown over the years, supported by major growth factors.
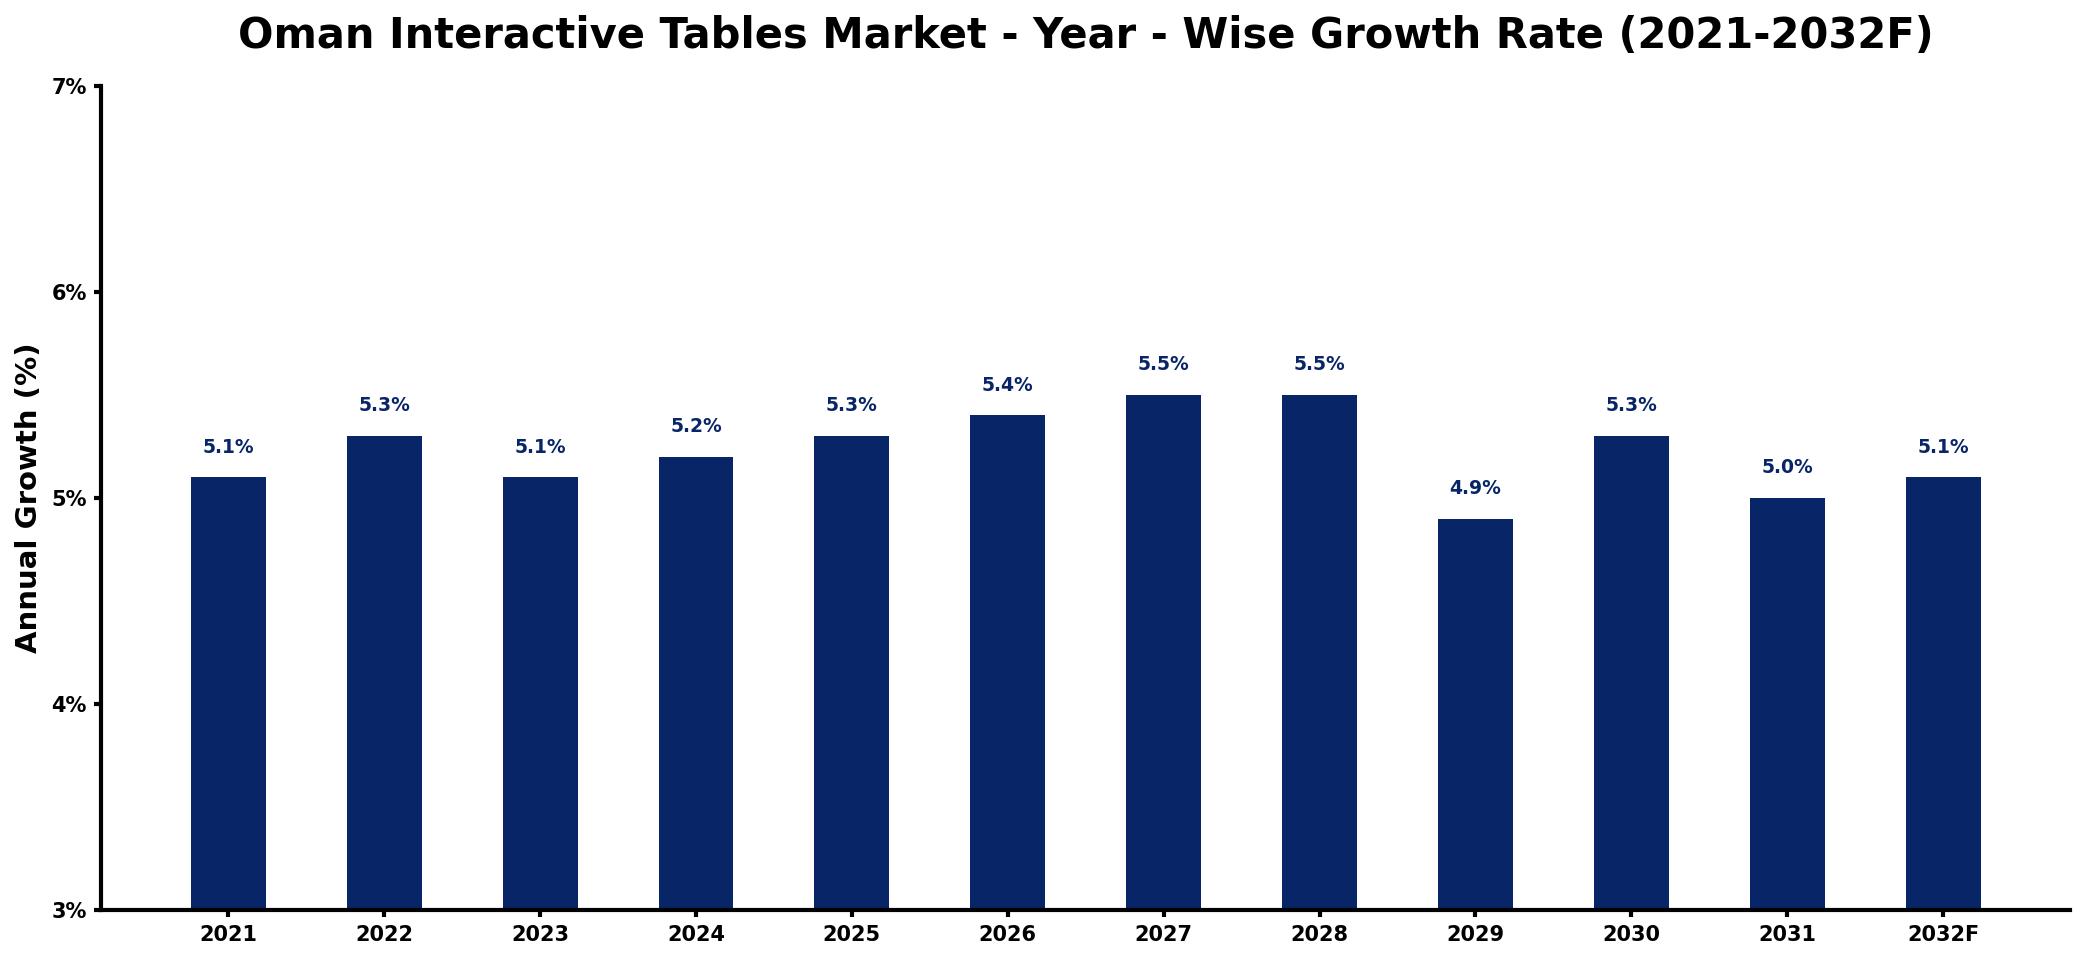
The table below presents the year‑wise growth rates along with the key drivers influencing the market
| Year | Growth Rate | Major Drivers |
| 2021 | 5.1% | Rising demand for digital solutions |
| 2022 | 5.3% | Increased investments in technology |
| 2023 | 5.1% | Growing popularity of smart environments |
| 2024 | 5.2% | Expansion of educational technology initiatives |
| 2025 | 5.3% | Surge in corporate training programs |
| 2026 | 5.4% | Enhanced consumer engagement strategies |
| 2027 | 5.5% | Development of immersive experiences |
| 2028 | 5.5% | Adoption of innovative retail concepts |
| 2029 | 4.9% | Diversification of entertainment offerings |
| 2030 | 5.3% | Strengthened focus on collaboration tools |
| 2031 | 5.0% | Emergence of new market players |
| 2032 | 5.1% | Integration of advanced analytics solutions |
Note: Market size estimations and growth projections presented in this report are based on 6Wresearch's proprietary forecasting methodology, utilizing the latest available industry data, government publications, and primary research inputs.
Oman Interactive Tables Market Synopsis
The demand for engaging and collaborative solutions is the most powerful force shaping the Oman Interactive Tables Market today. This need is evident across multiple sectors, including education, corporate environments, and entertainment venues, where businesses seek to enhance user experiences and foster interaction.
Moreover, the integration of advanced display technologies alongside digital transformation initiatives further supports market expansion. Stakeholders are increasingly recognizing the potential of interactive tables in delivering not only aesthetic value but also practical applications that improve information sharing and teamwork.
Oman Interactive Tables Market Key Takeaways
- Rising demand from the hospitality and entertainment sectors significantly boosts market growth.
- Technological advancements in display and touch functionalities are pivotal to market evolution.
- Government policies promoting the adoption of interactive solutions catalyze industry expansion.
- Ongoing digital transformation initiatives across various sectors enhance market potential.
- Emphasis on user engagement strategies is increasingly becoming essential for market players.
Evaluation of Restraints in Oman Interactive Tables Market
Despite the optimistic growth forecast, several factors may restrain the Oman Interactive Tables Market. Ensuring the durability and responsiveness of interactive tables is crucial; inadequate performance can lead to user dissatisfaction. Additionally, challenges related to software compatibility can hinder seamless integration across platforms. The effective management of user engagement in diverse applications also poses a challenge, as businesses strive to maintain high levels of interaction and satisfaction.
Oman Interactive Tables Market Trends
Current trends indicate a growing interest in multifunctional interactive tables that can serve various purposes within educational and corporate environments. As technology evolves, theres a noticeable shift towards incorporating augmented reality (AR) and artificial intelligence (AI) to enhance user experiences further. Furthermore, sustainability is becoming a significant consideration, with manufacturers increasingly focusing on eco-friendly materials and energy-efficient designs.
Oman Interactive Tables Market Opportunities
The potential for growth and investment in the Oman Interactive Tables Market lies in exploring untapped sectors such as healthcare and retail, where interactive solutions can improve patient engagement and customer experience, respectively. Additionally, ongoing government support for technological innovation opens avenues for partnerships and collaborations in research and development, further driving market expansion.
Government Initiatives in the Oman Interactive Tables Market
The Omani government has actively introduced policies aimed at fostering the adoption of advanced interactive solutions across various sectors. These initiatives include financial incentives for manufacturers, research and development grants, and the establishment of regulatory standards that ensure quality and performance. The government's commitment to enhancing the user experience in education, hospitality, and healthcare sectors underscores its dedication to supporting the interactive tables market's growth.
Future Insights of the Oman Interactive Tables Market
Looking ahead to 2026-2032, the Oman Interactive Tables Market is expected to witness significant advancements driven by technological innovation and enhanced user engagement strategies. As businesses continue to seek immersive experiences, interactive tables will likely play a crucial role in creating collaborative environments. Additionally, the integration of new technologies such as AI and AR is set to redefine user interactions, making the market ripe for dynamic growth and development.
Oman Interactive Tables Market Latest Developments (2025 - 2026)
Recent industry developments indicate a surge in interest from various sectors in implementing interactive tables. Companies are exploring partnerships to integrate state-of-the-art technologies that enhance interactivity and usability. Moreover, trade shows and exhibitions have become platforms for showcasing innovative solutions, providing opportunities for stakeholders to connect and discuss the future of interactive table applications.
Oman Interactive Tables Market - Key Attractiveness of the Report
- 10 Years of Market Numbers
- Historical Data Starting from 2022 to 2025
- Base Year: 2025
- Forecast Data until 2032
- Key Performance Indicators Impacting the Market
- Major Upcoming Developments and Projects
Key Highlights of the Report:
- Oman Interactive Tables Market Outlook
- Market Size of Oman Interactive Tables Market, 2025
- Forecast of Oman Interactive Tables Market, 2032
- Historical Data and Forecast of Oman Interactive Tables Revenues & Volume for the Period 2022-2032F
- Oman Interactive Tables Market Trend Evolution
- Oman Interactive Tables Market Drivers and Challenges
- Oman Interactive Tables Price Trends
- Oman Interactive Tables Porter's Five Forces
- Oman Interactive Tables Industry Life Cycle
- Historical Data and Forecast of Oman Interactive Tables Market Revenues & Volume By Technology for the Period 2022-2032F
- Historical Data and Forecast of Oman Interactive Tables Market Revenues & Volume By LCD for the Period 2022-2032F
- Historical Data and Forecast of Oman Interactive Tables Market Revenues & Volume By LED for the Period 2022-2032F
- Historical Data and Forecast of Oman Interactive Tables Market Revenues & Volume By Capacitive for the Period 2022-2032F
- Historical Data and Forecast of Oman Interactive Tables Market Revenues & Volume By Others for the Period 2022-2032F
- Historical Data and Forecast of Oman Interactive Tables Market Revenues & Volume By Screen Size for the Period 2022-2032F
- Historical Data and Forecast of Oman Interactive Tables Market Revenues & Volume By 32-65 Inch for the Period 2022-2032F
- Historical Data and Forecast of Oman Interactive Tables Market Revenues & Volume By 65 Inch & Above for the Period 2022-2032F
- Historical Data and Forecast of Oman Interactive Tables Market Revenues & Volume By Application for the Period 2022-2032F
- Historical Data and Forecast of Oman Interactive Tables Market Revenues & Volume By Exhibition & Trade Shows for the Period 2022-2032F
- Historical Data and Forecast of Oman Interactive Tables Market Revenues & Volume By Education for the Period 2022-2032F
- Historical Data and Forecast of Oman Interactive Tables Market Revenues & Volume By Retail for the Period 2022-2032F
- Historical Data and Forecast of Oman Interactive Tables Market Revenues & Volume By Control Room for the Period 2022-2032F
- Historical Data and Forecast of Oman Interactive Tables Market Revenues & Volume By Hospitality for the Period 2022-2032F
- Historical Data and Forecast of Oman Interactive Tables Market Revenues & Volume By Transportation for the Period 2022-2032F
- Historical Data and Forecast of Oman Interactive Tables Market Revenues & Volume By Others for the Period 2022-2032F
- Oman Interactive Tables Import Export Trade Statistics
- Market Opportunity Assessment By Technology
- Market Opportunity Assessment By Screen Size
- Market Opportunity Assessment By Application
- Oman Interactive Tables Top Companies Market Share
- Oman Interactive Tables Competitive Benchmarking By Technical and Operational Parameters
- Oman Interactive Tables Company Profiles
- Oman Interactive Tables Key Strategic Recommendations
Frequently Asked Questions About the Market Study (FAQs):
The growth is primarily driven by increasing demand from the hospitality and entertainment sectors for engaging solutions, along with technological advancements in display capabilities.
The Oman Interactive Tables Market was estimated at USD 364 Million in 2025 and is projected to reach USD 494 Million by 2032, growing at a CAGR of 4.5% from 2026 to 2032.
Genuine growth opportunities lie in the healthcare and retail sectors, where interactive tables can significantly enhance engagement and customer experience.
Yes, the Omani government has implemented various policies promoting the adoption of advanced interactive solutions, including financial incentives for manufacturers and regulatory standards for quality.
Key trends include the integration of augmented reality (AR) and artificial intelligence (AI) in interactive tables, as well as a growing emphasis on sustainability and energy-efficient designs.
6Wresearch actively monitors the Oman Interactive Tables Market and publishes its comprehensive annual report, highlighting emerging trends, growth drivers, revenue analysis, and forecast outlook. Our insights help businesses to make data-backed strategic decisions with ongoing market dynamics. Our analysts track relevent industries related to the Oman Interactive Tables Market, allowing our clients with actionable intelligence and reliable forecasts tailored to emerging regional needs.
Yes, we provide customisation as per your requirements. To learn more, feel free to contact us on sales@6wresearch.com
1 Executive Summary |
2 Introduction |
2.1 Key Highlights of the Report |
2.2 Report Description |
2.3 Market Scope & Segmentation |
2.4 Research Methodology |
2.5 Assumptions |
3 Oman Interactive Tables Market Overview |
3.1 Oman Country Macro Economic Indicators |
3.2 Oman Interactive Tables Market Revenues & Volume, 2022 & 2032F |
3.3 Oman Interactive Tables Market - Industry Life Cycle |
3.4 Oman Interactive Tables Market - Porter's Five Forces |
3.5 Oman Interactive Tables Market Revenues & Volume Share, By Technology, 2022 & 2032F |
3.6 Oman Interactive Tables Market Revenues & Volume Share, By Screen Size, 2022 & 2032F |
3.7 Oman Interactive Tables Market Revenues & Volume Share, By Application, 2022 & 2032F |
4 Oman Interactive Tables Market Dynamics |
4.1 Impact Analysis |
4.2 Market Drivers |
4.2.1 Increasing demand for interactive technologies in educational institutions and corporate settings |
4.2.2 Growing focus on enhancing customer experience in hospitality and retail sectors |
4.2.3 Government initiatives to promote digitalization and technology adoption in Oman |
4.3 Market Restraints |
4.3.1 High initial investment required for implementing interactive table solutions |
4.3.2 Limited awareness and understanding of interactive table technology among potential customers in Oman |
5 Oman Interactive Tables Market Trends |
6 Oman Interactive Tables Market, By Types |
6.1 Oman Interactive Tables Market, By Technology |
6.1.1 Overview and Analysis |
6.1.2 Oman Interactive Tables Market Revenues & Volume, By Technology, 2022-2032F |
6.1.3 Oman Interactive Tables Market Revenues & Volume, By LCD, 2022-2032F |
6.1.4 Oman Interactive Tables Market Revenues & Volume, By LED, 2022-2032F |
6.1.5 Oman Interactive Tables Market Revenues & Volume, By Capacitive, 2022-2032F |
6.1.6 Oman Interactive Tables Market Revenues & Volume, By Others, 2022-2032F |
6.2 Oman Interactive Tables Market, By Screen Size |
6.2.1 Overview and Analysis |
6.2.2 Oman Interactive Tables Market Revenues & Volume, By 32-65 Inch, 2022-2032F |
6.2.3 Oman Interactive Tables Market Revenues & Volume, By 65 Inch & Above, 2022-2032F |
6.3 Oman Interactive Tables Market, By Application |
6.3.1 Overview and Analysis |
6.3.2 Oman Interactive Tables Market Revenues & Volume, By Exhibition & Trade Shows, 2022-2032F |
6.3.3 Oman Interactive Tables Market Revenues & Volume, By Education, 2022-2032F |
6.3.4 Oman Interactive Tables Market Revenues & Volume, By Retail, 2022-2032F |
6.3.5 Oman Interactive Tables Market Revenues & Volume, By Control Room, 2022-2032F |
6.3.6 Oman Interactive Tables Market Revenues & Volume, By Hospitality, 2022-2032F |
6.3.7 Oman Interactive Tables Market Revenues & Volume, By Transportation, 2022-2032F |
7 Oman Interactive Tables Market Import-Export Trade Statistics |
7.1 Oman Interactive Tables Market Export to Major Countries |
7.2 Oman Interactive Tables Market Imports from Major Countries |
8 Oman Interactive Tables Market Key Performance Indicators |
8.1 Average session duration on interactive tables |
8.2 Number of repeat customers using interactive tables |
8.3 Percentage increase in user engagement with interactive table content |
8.4 Average time spent per session on interactive tables |
8.5 Number of interactive table installations in educational institutions and corporate offices |
9 Oman Interactive Tables Market - Opportunity Assessment |
9.1 Oman Interactive Tables Market Opportunity Assessment, By Technology, 2022 & 2032F |
9.2 Oman Interactive Tables Market Opportunity Assessment, By Screen Size, 2022 & 2032F |
9.3 Oman Interactive Tables Market Opportunity Assessment, By Application, 2022 & 2032F |
10 Oman Interactive Tables Market - Competitive Landscape |
10.1 Oman Interactive Tables Market Revenue Share, By Companies, 2025 |
10.2 Oman Interactive Tables Market Competitive Benchmarking, By Operating and Technical Parameters |
11 Company Profiles |
12 Recommendations |
13 Disclaimer |
Global Go To Market Strategy - 2030
Export potential enables firms to identify high-growth global markets with greater confidence by combining advanced trade intelligence with a structured quantitative methodology. The framework analyzes emerging demand trends and country-level import patterns while integrating macroeconomic and trade datasets such as GDP and population forecasts, bilateral import–export flows, tariff structures, elasticity differentials between developed and developing economies, geographic distance, and import demand projections. Using weighted trade values from 2020–2024 as the base period to project country-to-country export potential for 2030, these inputs are operationalized through calculated drivers such as gravity model parameters, tariff impact factors, and projected GDP per-capita growth. Through an analysis of hidden potentials, demand hotspots, and market conditions that are most favorable to success, this method enables firms to focus on target countries, maximize returns, and global expansion with data, backed by accuracy.
By factoring in the projected importer demand gap that is currently unmet and could be potential opportunity, it identifies the potential for the Exporter (Country) among 190 countries, against the general trade analysis, which identifies the biggest importer or exporter.
To discover high-growth global markets and optimize your business strategy:
Click Here
Pricing
- Single User License$ 1,995
- Department License$ 2,400
- Site License$ 3,120
- Global License$ 3,795

Leadership Perspectives from Industry Events
Search
Thought Leadership and Analyst Meet


Our Clients
6WResearch In News
- India Air Conditioner Market Set for Strong Rebound in 2026 After Weather-Led Correction and GST-Driven Recovery: 6Wresearch
- ADAS in India: How Automatic Emergency Braking, Blind Spot Detection & Driver Monitoring are Transforming Road Safety
- Doha a strategic location for EV manufacturing hub: IPA Qatar
- Demand for luxury TVs surging in the GCC, says Samsung
- Empowering Growth: The Thriving Journey of Bangladesh’s Cable Industry
- Demand for luxury TVs surging in the GCC, says Samsung
Latest Reports
- Nicaragua RPG Gaming Market (2026-2032)
- New Zealand RPG Gaming Market (2026-2032)
- Netherlands RPG Gaming Market (2026-2032)
- Nauru RPG Gaming Market (2026-2032)
- Namibia RPG Gaming Market (2026-2032)
- Mozambique RPG Gaming Market (2026-2032)
- Montenegro RPG Gaming Market (2026-2032)
- Mongolia RPG Gaming Market (2026-2032)
- Monaco RPG Gaming Market (2026-2032)
- Micronesia RPG Gaming Market (2026-2032)
Industry Events and Analyst Meet

EV India Expo 2026

HIMTEX 2026

India Refining Summit 2026

India EV Show 2026

EV tech India Expo 2026
Whitepaper
- Middle East & Africa Commercial Security Market Click here to view more.
- Middle East & Africa Fire Safety Systems & Equipment Market Click here to view more.
- GCC Drone Market Click here to view more.
- Middle East Lighting Fixture Market Click here to view more.
- GCC Physical & Perimeter Security Market Click here to view more.