Pakistan Electromagnetic NDT Market (2025-2031) Outlook | Share, Companies, Value, Analysis, Size, Revenue, Forecast, Trends, Industry & Growth
Market Forecast By Method (Eddy Current Testing, Remote Field Testing, Magnetic Flux Leakage Testing), By Vertical (Oil & Gas, Power Generation, Automotive, Aerospace) And Competitive Landscape
| Product Code: ETC4591598 | Publication Date: Jul 2023 | Updated Date: Mar 2026 | Product Type: Report | |
| Publisher: 6Wresearch | Author: Ravi Bhandari | No. of Pages: 85 | No. of Figures: 45 | No. of Tables: 25 |
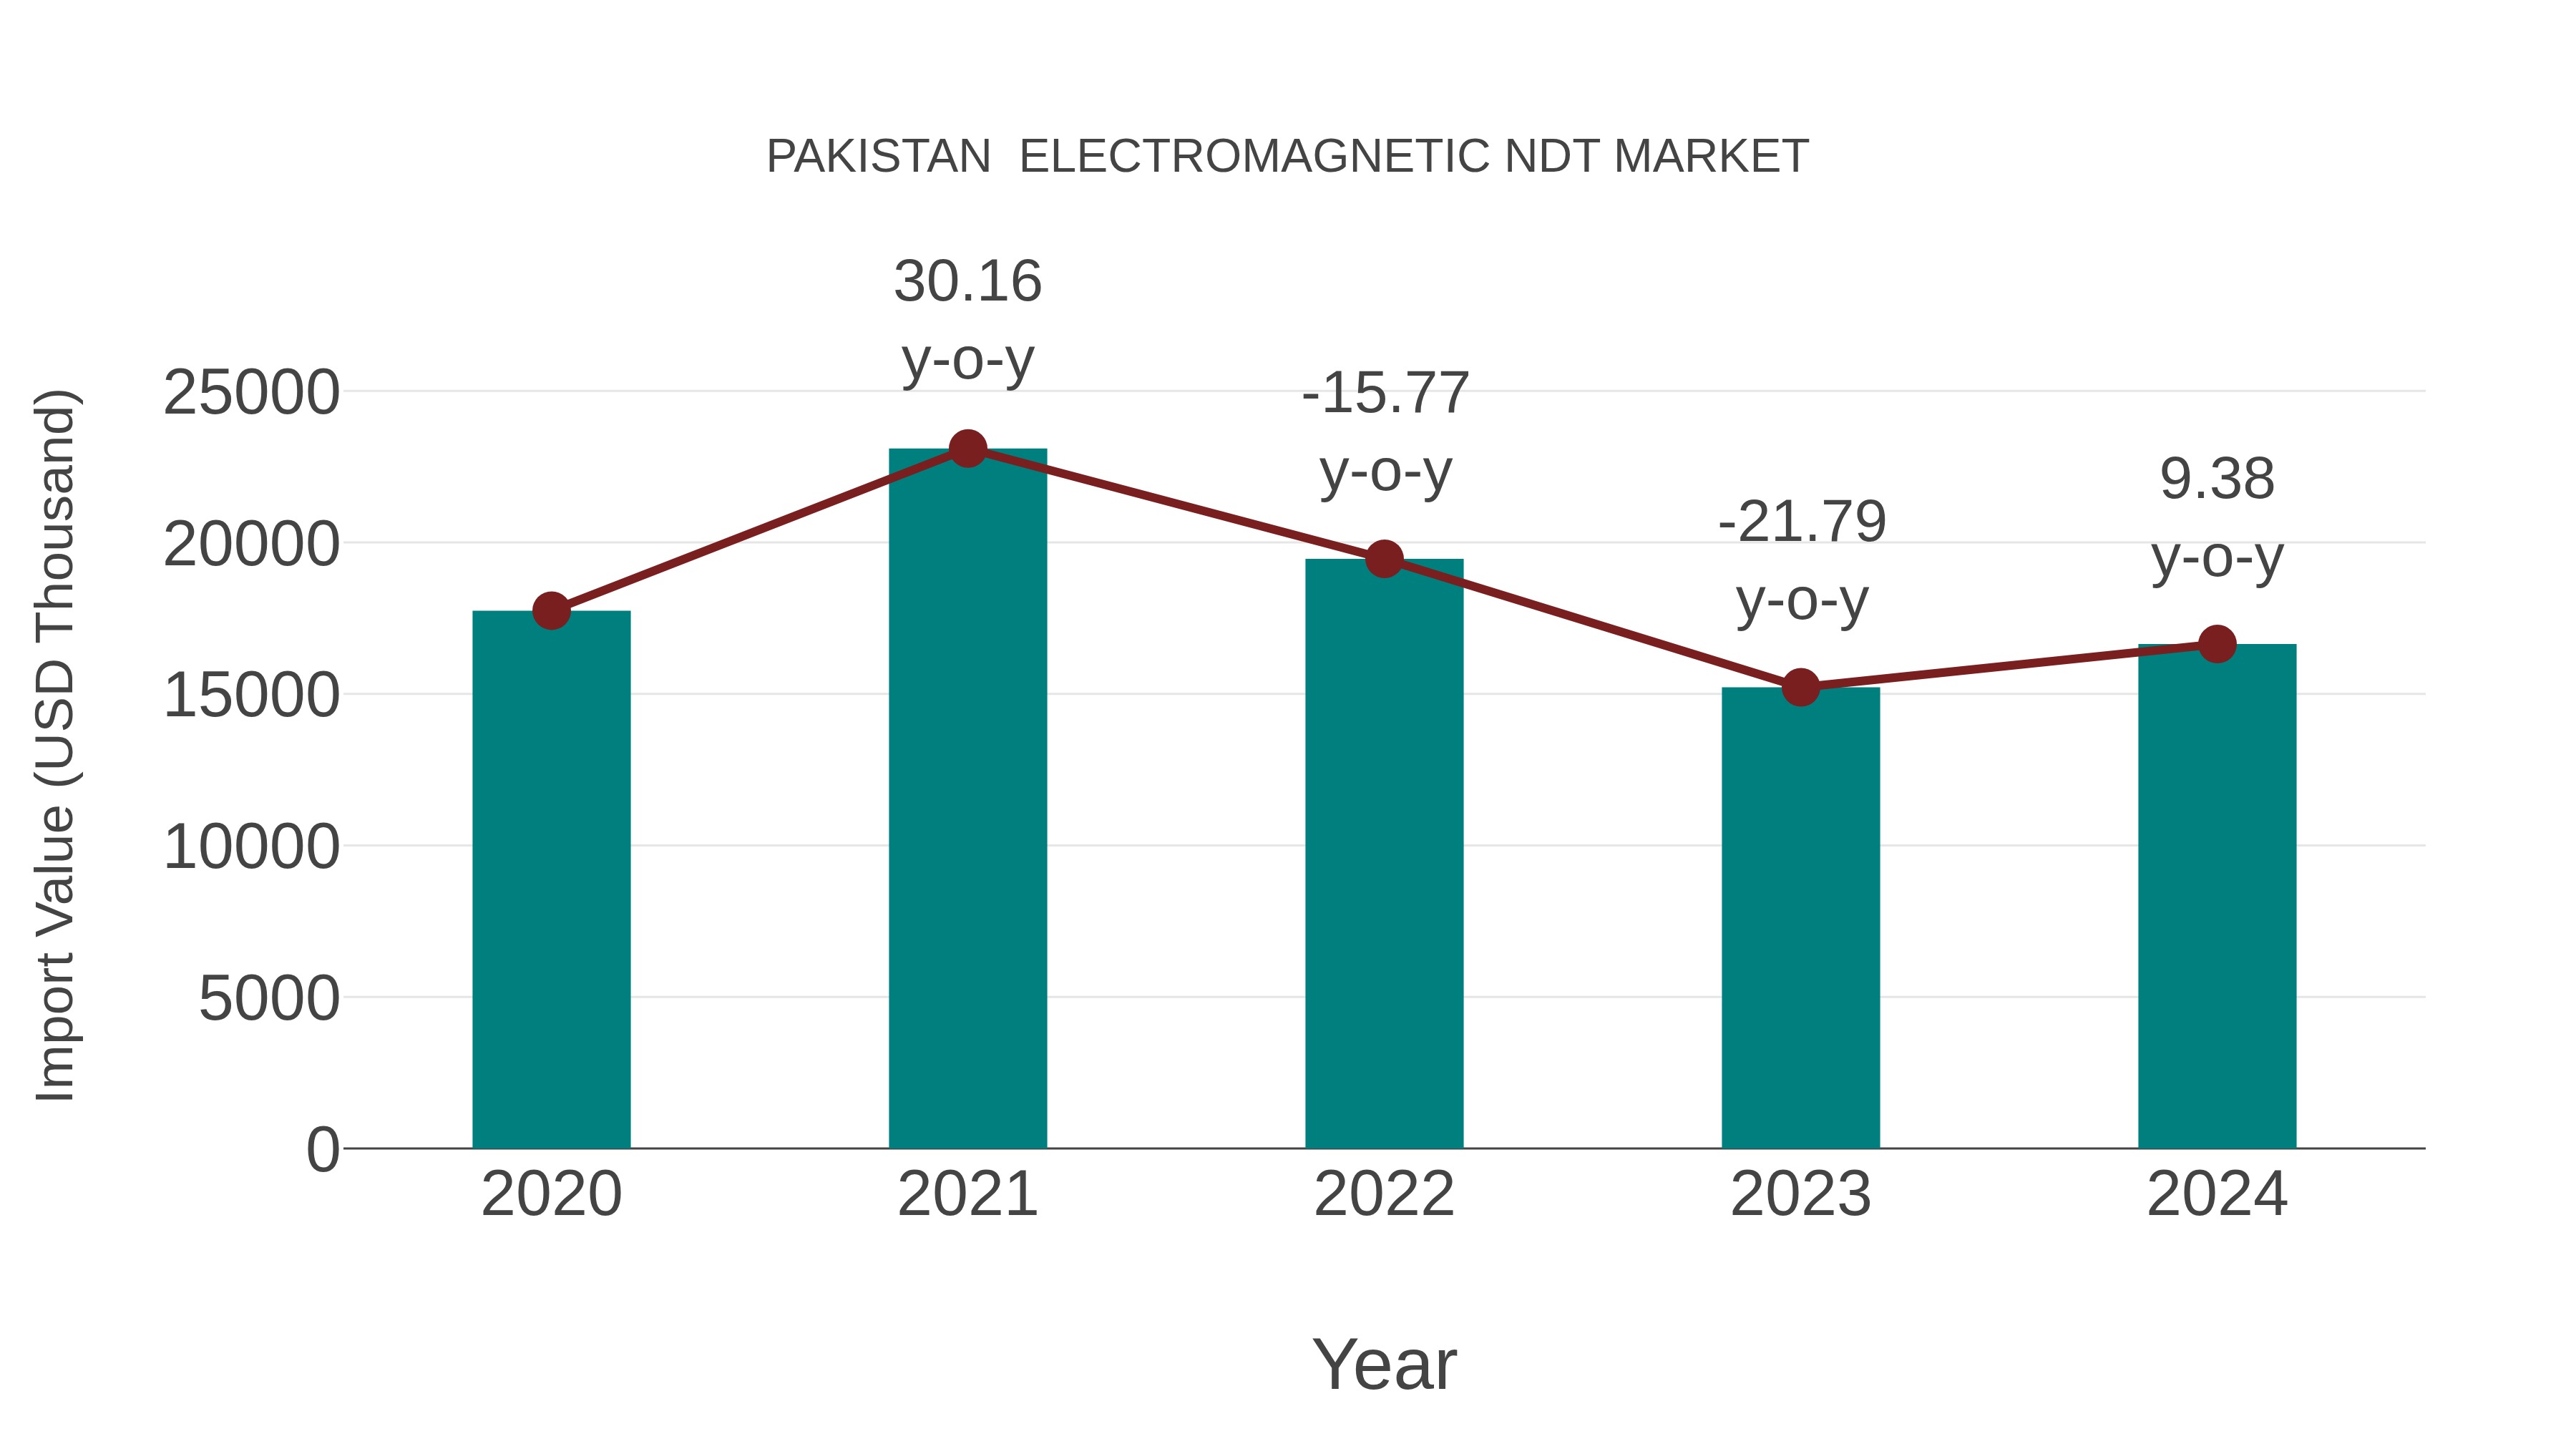
Pakistan Electromagnetic Ndt Market: Import Trend Analysis
In 2024, Pakistan import trend for the electromagnetic NDT market showed a growth rate of 9.38%, contrasting with a -1.59% compound annual growth rate (CAGR) from 2020 to 2023. This shift may be attributed to increased demand for advanced NDT technologies or changes in trade policies impacting market stability.
Key Highlights of the Report:
- Pakistan Electromagnetic NDT Market Outlook
- Market Size of Pakistan Electromagnetic NDT Market, 2024
- Forecast of Pakistan Electromagnetic NDT Market, 2031
- Historical Data and Forecast of Pakistan Electromagnetic NDT Revenues & Volume for the Period 2021 - 2031
- Pakistan Electromagnetic NDT Market Trend Evolution
- Pakistan Electromagnetic NDT Market Drivers and Challenges
- Pakistan Electromagnetic NDT Price Trends
- Pakistan Electromagnetic NDT Porter's Five Forces
- Pakistan Electromagnetic NDT Industry Life Cycle
- Historical Data and Forecast of Pakistan Electromagnetic NDT Market Revenues & Volume By Method for the Period 2021 - 2031
- Historical Data and Forecast of Pakistan Electromagnetic NDT Market Revenues & Volume By Eddy Current Testing for the Period 2021 - 2031
- Historical Data and Forecast of Pakistan Electromagnetic NDT Market Revenues & Volume By Remote Field Testing for the Period 2021 - 2031
- Historical Data and Forecast of Pakistan Electromagnetic NDT Market Revenues & Volume By Magnetic Flux Leakage Testing for the Period 2021 - 2031
- Historical Data and Forecast of Pakistan Electromagnetic NDT Market Revenues & Volume By Vertical for the Period 2021 - 2031
- Historical Data and Forecast of Pakistan Electromagnetic NDT Market Revenues & Volume By Oil & Gas for the Period 2021 - 2031
- Historical Data and Forecast of Pakistan Electromagnetic NDT Market Revenues & Volume By Power Generation for the Period 2021 - 2031
- Historical Data and Forecast of Pakistan Electromagnetic NDT Market Revenues & Volume By Automotive for the Period 2021 - 2031
- Historical Data and Forecast of Pakistan Electromagnetic NDT Market Revenues & Volume By Aerospace for the Period 2021 - 2031
- Pakistan Electromagnetic NDT Import Export Trade Statistics
- Market Opportunity Assessment By Method
- Market Opportunity Assessment By Vertical
- Pakistan Electromagnetic NDT Top Companies Market Share
- Pakistan Electromagnetic NDT Competitive Benchmarking By Technical and Operational Parameters
- Pakistan Electromagnetic NDT Company Profiles
- Pakistan Electromagnetic NDT Key Strategic Recommendations
Pakistan Electromagnetic NDT Market (2025-2031): FAQs
Key competitors in the Pakistan electromagnetic NDT market include Olympus Corporation, GE Inspection Technologies, and Zetec Inc. These companies are known for their advanced technologies, extensive product portfolios, and strong customer service, positioning themselves as leaders in the market.
Companies like GE Inspection Technologies, Olympus Corporation, and Zetec Inc. have been expanding their operations in Pakistan, presenting opportunities for new entrants to offer advanced electromagnetic NDT solutions and services to industries such as oil and gas, power generation, and manufacturing.
Customers in the Pakistan electromagnetic NDT market are increasingly leaning towards portable and handheld devices, such as the GE Eddyfi Lyft and Olympus EPOCH series, for their ease of use and convenience in conducting inspections in various industries. Additionally, there is a growing demand for advanced software solutions like Zetec's UltraVision software, which provide enhanced data analysis and reporting capabilities, allowing customers to make more informed decisions based on inspection results.
In Pakistan's electromagnetic NDT market, there is a growing consumer preference for non-destructive testing solutions offered by companies like TÜV Rheinland and Bureau Veritas due to their reputation for accuracy and efficiency. Technology trends include the adoption of advanced electromagnetic NDT equipment such as the Eddyfi Lyft system, known for its high-resolution imaging capabilities. In terms of policies, the government of Pakistan has been emphasizing the importance of quality control and safety standards, driving the demand for electromagnetic NDT services across industries like oil & gas and manufacturing.
As technology continues to advance, the Pakistan electromagnetic NDT market is likely to see a shift towards more portable and user-friendly inspection devices. Companies like GE Inspection Technologies and Olympus Corporation are investing in developing innovative solutions that offer enhanced accuracy and efficiency in non-destructive testing. Additionally, there is a growing emphasis on integrating AI and machine learning capabilities into electromagnetic NDT systems to improve defect detection and predictive maintenance strategies. These trends indicate a promising future direction for the market, characterized by increased automation, data-driven decision-making, and improved inspection processes.
6Wresearch actively monitors the Pakistan Electromagnetic NDT Market and publishes its comprehensive annual report, highlighting emerging trends, growth drivers, revenue analysis, and forecast outlook. Our insights help businesses to make data-backed strategic decisions with ongoing market dynamics. Our analysts track relevent industries related to the Pakistan Electromagnetic NDT Market, allowing our clients with actionable intelligence and reliable forecasts tailored to emerging regional needs.
Yes, we provide customisation as per your requirements. To learn more, feel free to contact us on sales@6wresearch.com
1 Executive Summary |
2 Introduction |
2.1 Key Highlights of the Report |
2.2 Report Description |
2.3 Market Scope & Segmentation |
2.4 Research Methodology |
2.5 Assumptions |
3 Pakistan Electromagnetic NDT Market Overview |
3.1 Pakistan Country Macro Economic Indicators |
3.2 Pakistan Electromagnetic NDT Market Revenues & Volume, 2021 & 2031F |
3.3 Pakistan Electromagnetic NDT Market - Industry Life Cycle |
3.4 Pakistan Electromagnetic NDT Market - Porter's Five Forces |
3.5 Pakistan Electromagnetic NDT Market Revenues & Volume Share, By Method, 2021 & 2031F |
3.6 Pakistan Electromagnetic NDT Market Revenues & Volume Share, By Vertical, 2021 & 2031F |
4 Pakistan Electromagnetic NDT Market Dynamics |
4.1 Impact Analysis |
4.2 Market Drivers |
4.2.1 Technological advancements in electromagnetic NDT equipment and techniques |
4.2.2 Increasing adoption of non-destructive testing methods in various industries in Pakistan |
4.2.3 Growing focus on quality control and assurance measures in manufacturing and construction sectors |
4.3 Market Restraints |
4.3.1 High initial investment and maintenance costs associated with electromagnetic NDT equipment |
4.3.2 Lack of skilled professionals and expertise in operating advanced NDT technologies in Pakistan |
4.3.3 Regulatory challenges and compliance requirements affecting the adoption of electromagnetic NDT solutions |
5 Pakistan Electromagnetic NDT Market Trends |
6 Pakistan Electromagnetic NDT Market, By Types |
6.1 Pakistan Electromagnetic NDT Market, By Method |
6.1.1 Overview and Analysis |
6.1.2 Pakistan Electromagnetic NDT Market Revenues & Volume, By Method, 2021 - 2031F |
6.1.3 Pakistan Electromagnetic NDT Market Revenues & Volume, By Eddy Current Testing, 2021 - 2031F |
6.1.4 Pakistan Electromagnetic NDT Market Revenues & Volume, By Remote Field Testing, 2021 - 2031F |
6.1.5 Pakistan Electromagnetic NDT Market Revenues & Volume, By Magnetic Flux Leakage Testing, 2021 - 2031F |
6.2 Pakistan Electromagnetic NDT Market, By Vertical |
6.2.1 Overview and Analysis |
6.2.2 Pakistan Electromagnetic NDT Market Revenues & Volume, By Oil & Gas, 2021 - 2031F |
6.2.3 Pakistan Electromagnetic NDT Market Revenues & Volume, By Power Generation, 2021 - 2031F |
6.2.4 Pakistan Electromagnetic NDT Market Revenues & Volume, By Automotive, 2021 - 2031F |
6.2.5 Pakistan Electromagnetic NDT Market Revenues & Volume, By Aerospace, 2021 - 2031F |
7 Pakistan Electromagnetic NDT Market Import-Export Trade Statistics |
7.1 Pakistan Electromagnetic NDT Market Export to Major Countries |
7.2 Pakistan Electromagnetic NDT Market Imports from Major Countries |
8 Pakistan Electromagnetic NDT Market Key Performance Indicators |
8.1 Rate of adoption of electromagnetic NDT technologies in key industries |
8.2 Training and certification levels of professionals in electromagnetic NDT in Pakistan |
8.3 Number of research and development initiatives focused on enhancing electromagnetic NDT capabilities in the country |
9 Pakistan Electromagnetic NDT Market - Opportunity Assessment |
9.1 Pakistan Electromagnetic NDT Market Opportunity Assessment, By Method, 2021 & 2031F |
9.2 Pakistan Electromagnetic NDT Market Opportunity Assessment, By Vertical, 2021 & 2031F |
10 Pakistan Electromagnetic NDT Market - Competitive Landscape |
10.1 Pakistan Electromagnetic NDT Market Revenue Share, By Companies, 2024 |
10.2 Pakistan Electromagnetic NDT Market Competitive Benchmarking, By Operating and Technical Parameters |
11 Company Profiles |
12 Recommendations |
13 Disclaimer |
Global Go To Market Strategy - 2030
Export potential enables firms to identify high-growth global markets with greater confidence by combining advanced trade intelligence with a structured quantitative methodology. The framework analyzes emerging demand trends and country-level import patterns while integrating macroeconomic and trade datasets such as GDP and population forecasts, bilateral import–export flows, tariff structures, elasticity differentials between developed and developing economies, geographic distance, and import demand projections. Using weighted trade values from 2020–2024 as the base period to project country-to-country export potential for 2030, these inputs are operationalized through calculated drivers such as gravity model parameters, tariff impact factors, and projected GDP per-capita growth. Through an analysis of hidden potentials, demand hotspots, and market conditions that are most favorable to success, this method enables firms to focus on target countries, maximize returns, and global expansion with data, backed by accuracy.
By factoring in the projected importer demand gap that is currently unmet and could be potential opportunity, it identifies the potential for the Exporter (Country) among 190 countries, against the general trade analysis, which identifies the biggest importer or exporter.
To discover high-growth global markets and optimize your business strategy:
Click Here
Pricing
- Single User License$ 1,995
- Department License$ 2,400
- Site License$ 3,120
- Global License$ 3,795

Leadership Perspectives from Industry Events
Search
Thought Leadership and Analyst Meet


Our Clients
6WResearch In News
- India Export Attractiveness Tracker 2026
- India Air Conditioner Market Set for Strong Rebound in 2026 After Weather-Led Correction and GST-Driven Recovery: 6Wresearch
- ADAS in India: How Automatic Emergency Braking, Blind Spot Detection & Driver Monitoring are Transforming Road Safety
- Doha a strategic location for EV manufacturing hub: IPA Qatar
- Demand for luxury TVs surging in the GCC, says Samsung
- Empowering Growth: The Thriving Journey of Bangladesh’s Cable Industry
Latest Reports
- Nicaragua RPG Gaming Market (2026-2032)
- New Zealand RPG Gaming Market (2026-2032)
- Netherlands RPG Gaming Market (2026-2032)
- Nauru RPG Gaming Market (2026-2032)
- Namibia RPG Gaming Market (2026-2032)
- Mozambique RPG Gaming Market (2026-2032)
- Montenegro RPG Gaming Market (2026-2032)
- Mongolia RPG Gaming Market (2026-2032)
- Monaco RPG Gaming Market (2026-2032)
- Micronesia RPG Gaming Market (2026-2032)
Industry Events and Analyst Meet

EV India Expo 2026

HIMTEX 2026

India Refining Summit 2026

India EV Show 2026

EV tech India Expo 2026
Whitepaper
- Middle East & Africa Commercial Security Market Click here to view more.
- Middle East & Africa Fire Safety Systems & Equipment Market Click here to view more.
- GCC Drone Market Click here to view more.
- Middle East Lighting Fixture Market Click here to view more.
- GCC Physical & Perimeter Security Market Click here to view more.