Armenia Chloromethane Market (2026-2032) | Forecast, Trends, Analysis, Companies, Value, Industry, Size, Segmentation, Revenue, Growth, Share & Outlook
Market Forecast By Product (Methylene Chloride, Methyl Chloride, Carbon Tetrachloride, Chloroform, Others), By Application (Refrigerant, Industrial Solvent, Silicone Polymers, Laboratory Chemicals, Chemical Intermediates, Methylating & Chlorinating Agent, Propellant & Blowing Agent, Catalyst Carrier), By End-use (Pharmaceutical, Agrochemicals, Textile, Automotive, Construction, Paints & Coatings, Personal Care Products, Plastics & Rubber) And Competitive Landscape
| Product Code: ETC5363489 | Publication Date: Nov 2023 | Updated Date: Mar 2026 | Product Type: Market Research Report | |
| Publisher: 6Wresearch | Author: Bhawna Singh | No. of Pages: 60 | No. of Figures: 30 | No. of Tables: 5 |
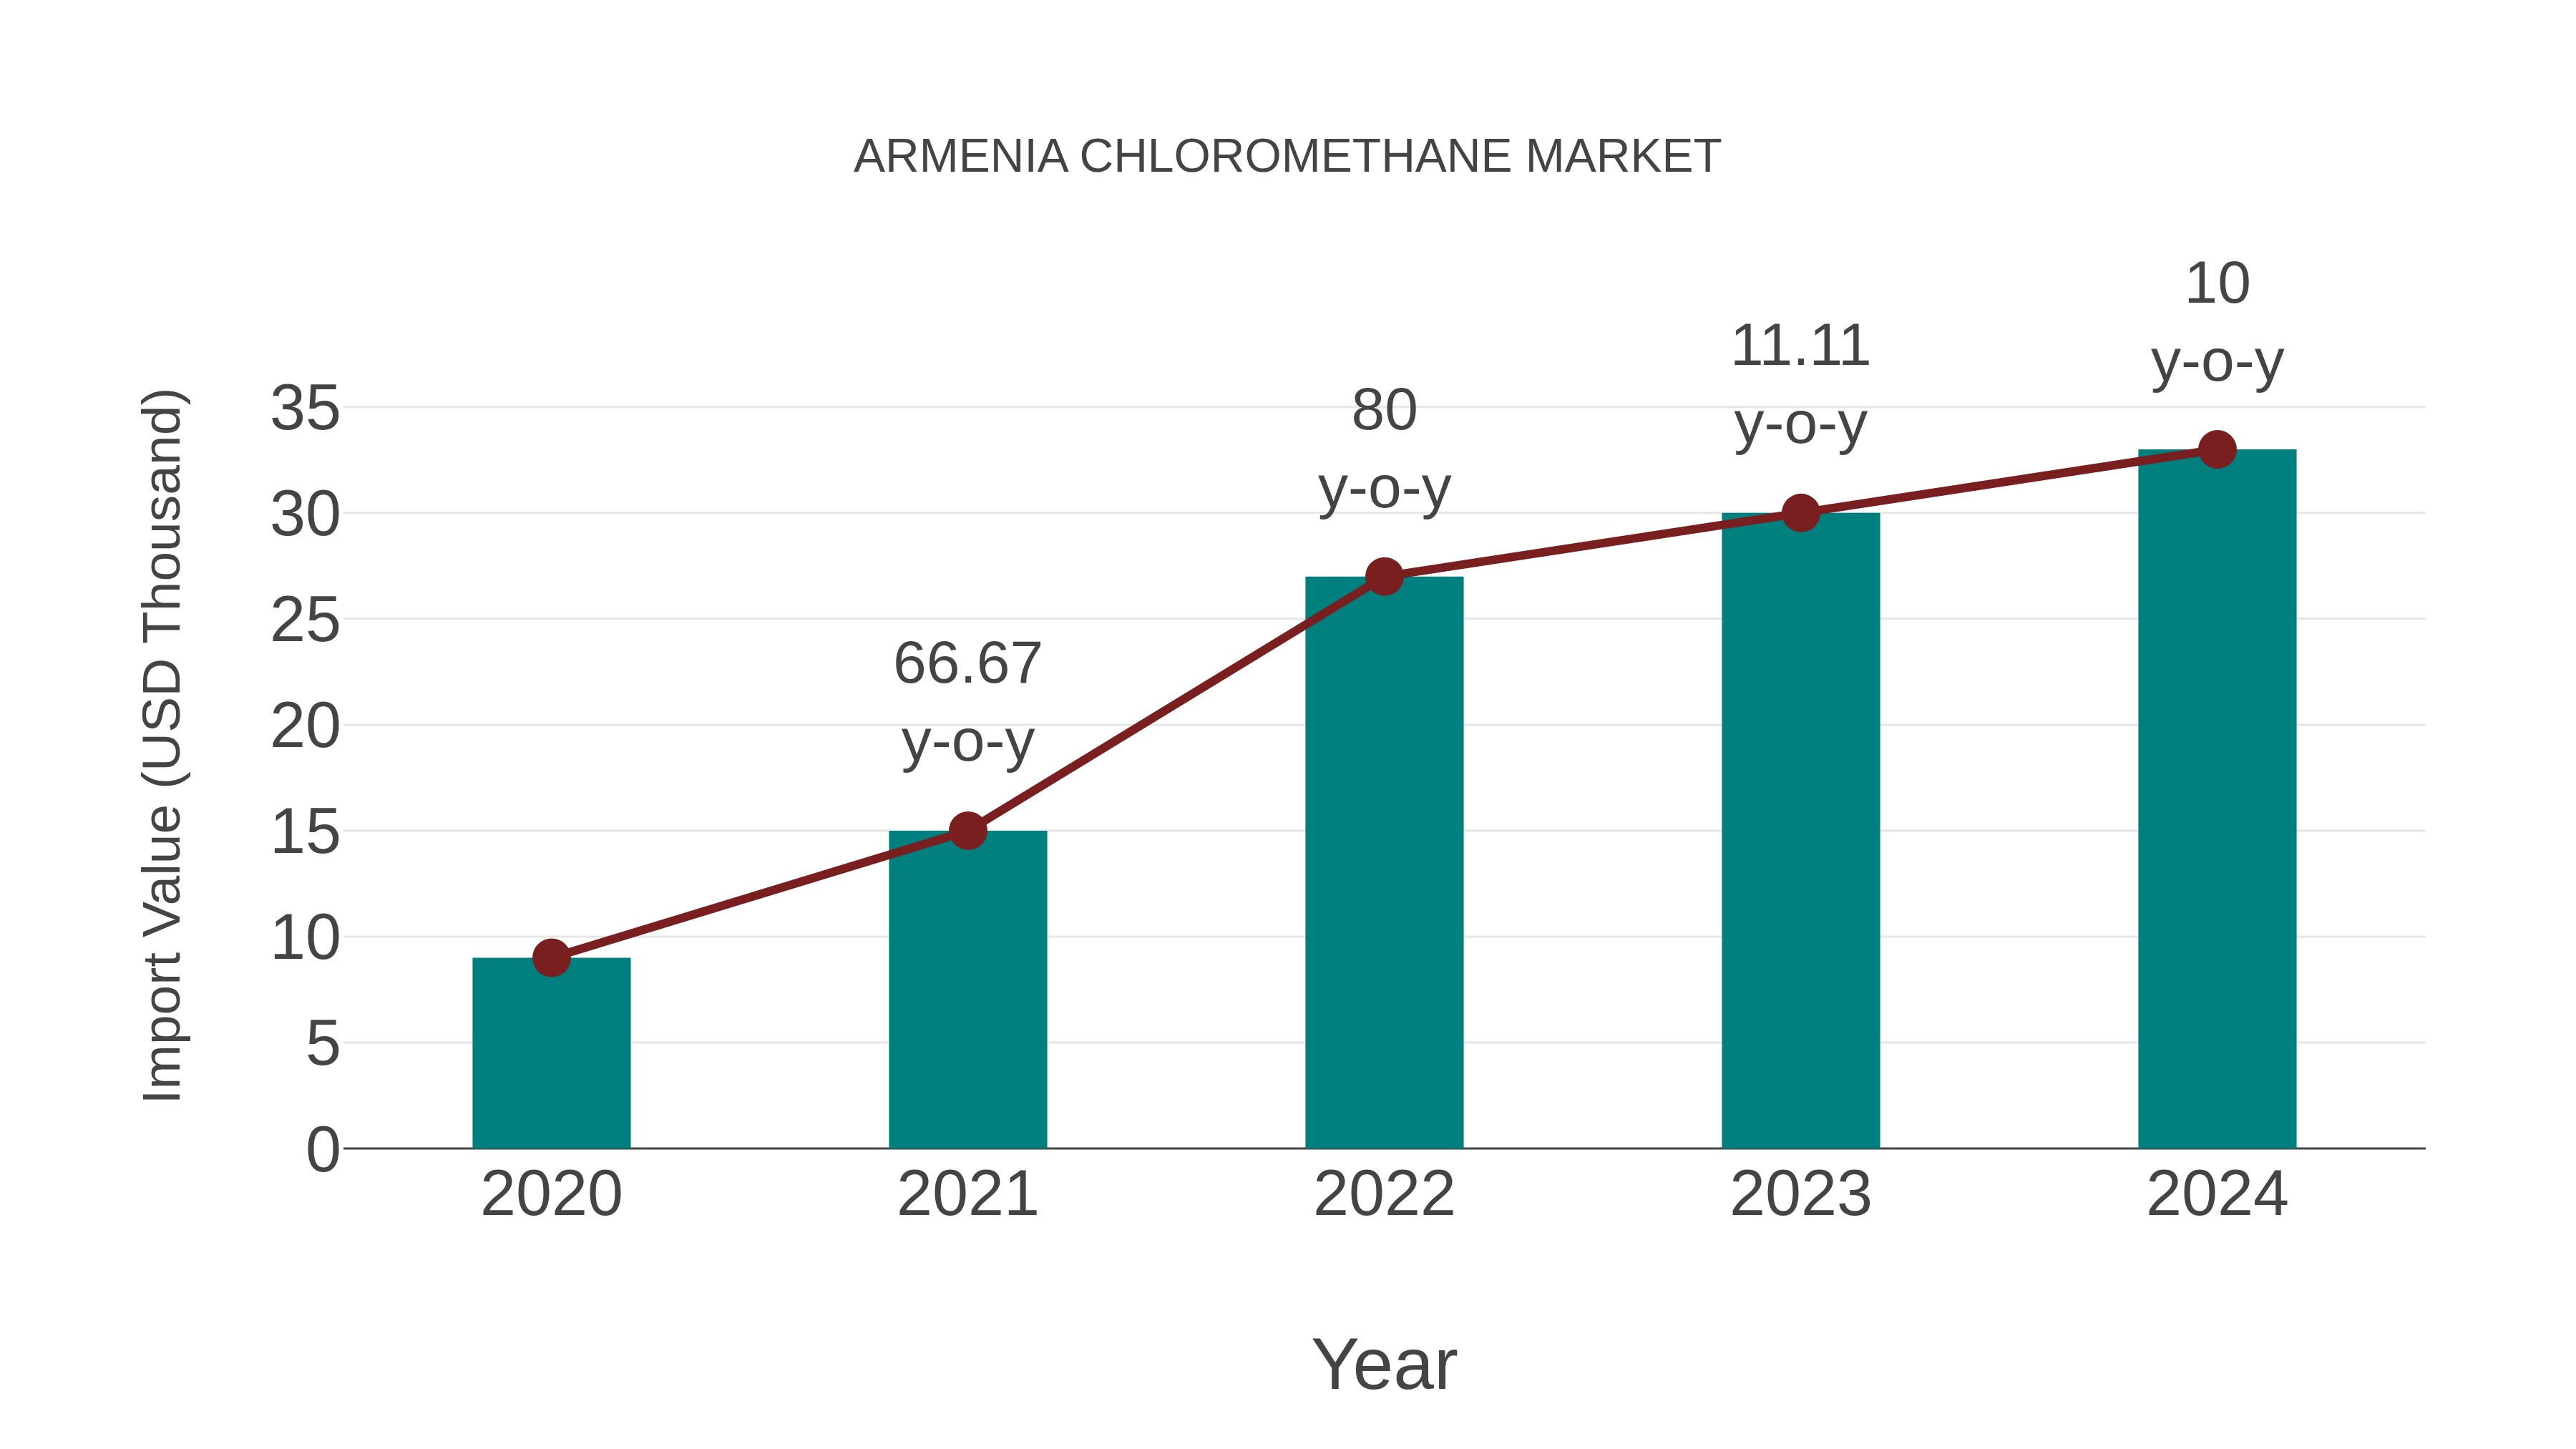
Armenia Chloromethane Market: Import Trend Analysis
Armenia import trend for chloromethane in 2024 showed a growth rate of 10.0% compared to the previous year. The compound annual growth rate (CAGR) for imports from 2020 to 2024 stood at 38.38%. This significant increase in import momentum can be attributed to a notable demand shift in the market, indicating a growing need for chloromethane within Armenia during this period.
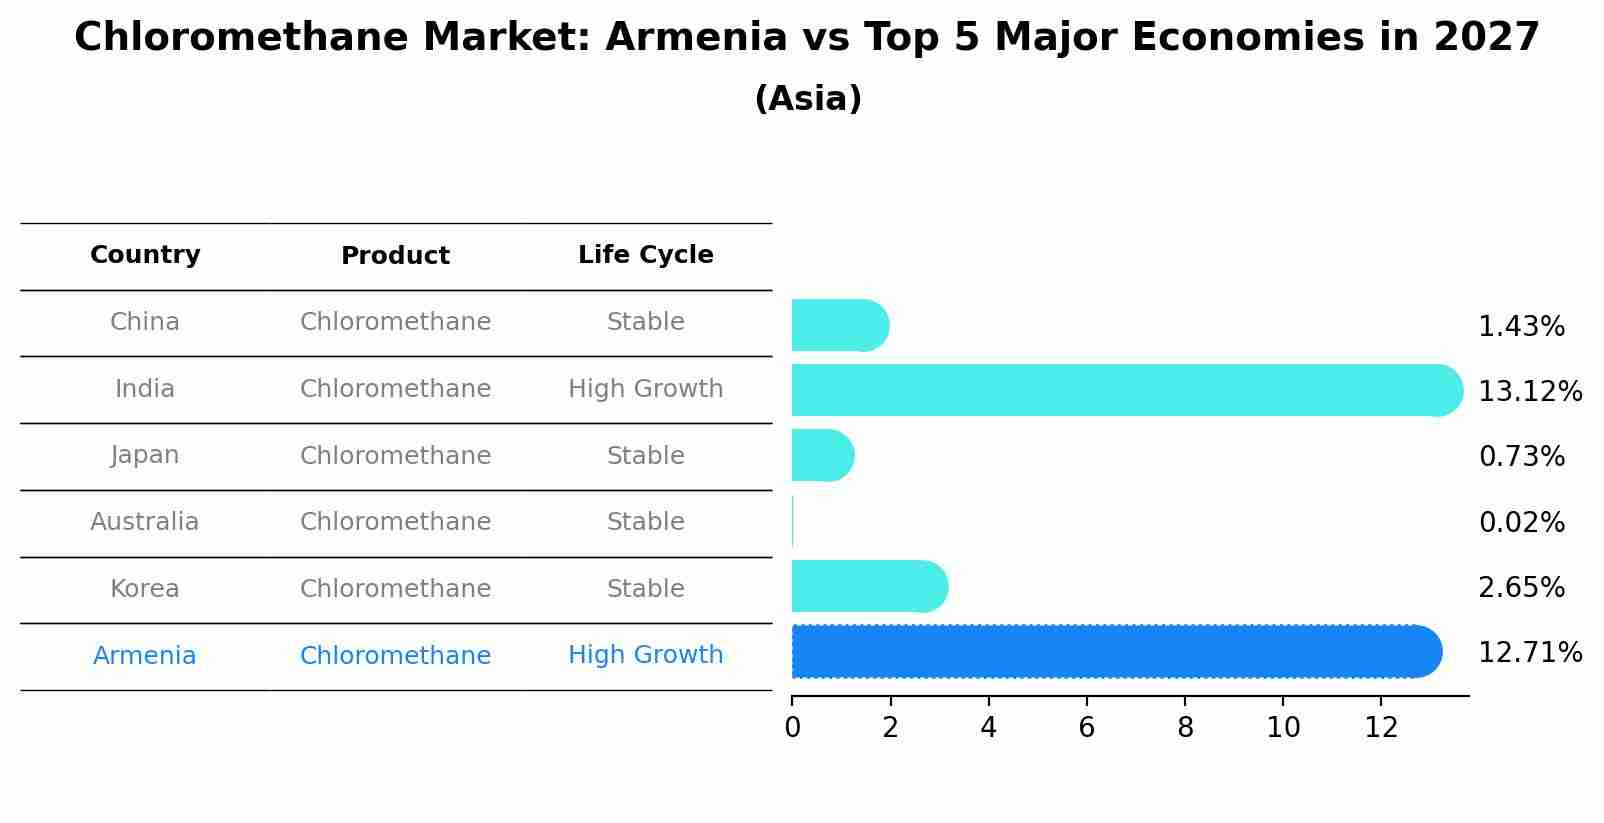
Chloromethane Market: Armenia vs Top 5 Major Economies in 2027 (Asia)
The Chloromethane market in Armenia is projected to grow at a high growth rate of 12.71% by 2027, highlighting the country's increasing focus on advanced technologies within the Asia region, where China holds the dominant position, followed closely by India, Japan, Australia and South Korea, shaping overall regional demand.
Armenia Chloromethane Market Overview
The Armenia chloromethane market pertains to the production, consumption, and trade of chloromethane within Armenia. This market involves chemical manufacturers, suppliers, and end-users involved in various applications such as solvents, methylating agents, and chemical intermediates.
Drivers of the market
The Armenia chloromethane market is influenced significantly by its applications across various industries, including pharmaceuticals, agrochemicals, and chemical synthesis. Chloromethane, also known as methyl chloride, serves as a crucial intermediate in the production of silicones, methyl cellulose, and various pharmaceutical compounds. The market growth is primarily driven by increasing demand for these end-use products, coupled with advancements in chemical manufacturing processes aimed at improving efficiency and reducing environmental impact.
Challenges of the market
The Armenia chloromethane market faces several challenges despite its niche demand in chemical synthesis and pharmaceutical industries. One of the primary challenges is regulatory compliance and environmental concerns related to the production and use of chloromethane. Strict regulations on emissions and waste disposal impact production costs and operational feasibility for manufacturers in Armenia. Additionally, fluctuations in raw material prices and the availability of feedstocks pose challenges for market stability. Market players must navigate these regulatory and economic challenges while ensuring product quality and meeting consumer demands in Armenia and potentially broader international markets.
Government Policy of the market
The Armenia chloromethane market is influenced by government policies aimed at regulating chemical production, ensuring environmental safety, and promoting sustainable industrial practices. Policies focus on monitoring chemical emissions, waste disposal regulations, and promoting safer handling practices in manufacturing facilities. Government initiatives also support research and development efforts to improve production efficiency and reduce environmental impact. Challenges include compliance with stringent regulatory standards and adapting to evolving environmental policies affecting chemical manufacturing processes.
Key Highlights of the Report:
- Armenia Chloromethane Market Outlook
- Market Size of Armenia Chloromethane Market, 2025
- Forecast of Armenia Chloromethane Market, 2032
- Historical Data and Forecast of Armenia Chloromethane Revenues & Volume for the Period 2022-2032F
- Armenia Chloromethane Market Trend Evolution
- Armenia Chloromethane Market Drivers and Challenges
- Armenia Chloromethane Price Trends
- Armenia Chloromethane Porter`s Five Forces
- Armenia Chloromethane Industry Life Cycle
- Historical Data and Forecast of Armenia Chloromethane Market Revenues & Volume By Product for the Period 2022-2032F
- Historical Data and Forecast of Armenia Chloromethane Market Revenues & Volume By Methylene Chloride for the Period 2022-2032F
- Historical Data and Forecast of Armenia Chloromethane Market Revenues & Volume By Methyl Chloride for the Period 2022-2032F
- Historical Data and Forecast of Armenia Chloromethane Market Revenues & Volume By Carbon Tetrachloride for the Period 2022-2032F
- Historical Data and Forecast of Armenia Chloromethane Market Revenues & Volume By Chloroform for the Period 2022-2032F
- Historical Data and Forecast of Armenia Chloromethane Market Revenues & Volume By Others for the Period 2022-2032F
- Historical Data and Forecast of Armenia Chloromethane Market Revenues & Volume By Application for the Period 2022-2032F
- Historical Data and Forecast of Armenia Chloromethane Market Revenues & Volume By Refrigerant for the Period 2022-2032F
- Historical Data and Forecast of Armenia Chloromethane Market Revenues & Volume By Industrial Solvent for the Period 2022-2032F
- Historical Data and Forecast of Armenia Chloromethane Market Revenues & Volume By Silicone Polymers for the Period 2022-2032F
- Historical Data and Forecast of Armenia Chloromethane Market Revenues & Volume By Laboratory Chemicals for the Period 2022-2032F
- Historical Data and Forecast of Armenia Chloromethane Market Revenues & Volume By Chemical Intermediates for the Period 2022-2032F
- Historical Data and Forecast of Armenia Chloromethane Market Revenues & Volume By Methylating & Chlorinating Agent for the Period 2022-2032F
- Historical Data and Forecast of Armenia Chloromethane Market Revenues & Volume By Propellant & Blowing Agent for the Period 2022-2032F
- Historical Data and Forecast of Armenia Chloromethane Market Revenues & Volume By Catalyst Carrier for the Period 2022-2032F
- Historical Data and Forecast of Armenia Chloromethane Market Revenues & Volume By End-use for the Period 2022-2032F
- Historical Data and Forecast of Armenia Chloromethane Market Revenues & Volume By Pharmaceutical for the Period 2022-2032F
- Historical Data and Forecast of Armenia Chloromethane Market Revenues & Volume By Agrochemicals for the Period 2022-2032F
- Historical Data and Forecast of Armenia Chloromethane Market Revenues & Volume By Textile for the Period 2022-2032F
- Historical Data and Forecast of Armenia Chloromethane Market Revenues & Volume By Automotive for the Period 2022-2032F
- Historical Data and Forecast of Armenia Chloromethane Market Revenues & Volume By Construction for the Period 2022-2032F
- Historical Data and Forecast of Armenia Chloromethane Market Revenues & Volume By Paints & Coatings for the Period 2022-2032F
- Historical Data and Forecast of Armenia Chloromethane Market Revenues & Volume By Personal Care Products for the Period 2022-2032F
- Historical Data and Forecast of Armenia Chloromethane Market Revenues & Volume By Plastics & Rubber for the Period 2022-2032F
- Armenia Chloromethane Import Export Trade Statistics
- Market Opportunity Assessment By Product
- Market Opportunity Assessment By Application
- Market Opportunity Assessment By End-use
- Armenia Chloromethane Top Companies Market Share
- Armenia Chloromethane Competitive Benchmarking By Technical and Operational Parameters
- Armenia Chloromethane Company Profiles
- Armenia Chloromethane Key Strategic Recommendations
Armenia Chloromethane Market (2026-2032): FAQs
6Wresearch actively monitors the Armenia Chloromethane Market and publishes its comprehensive annual report, highlighting emerging trends, growth drivers, revenue analysis, and forecast outlook. Our insights help businesses to make data-backed strategic decisions with ongoing market dynamics. Our analysts track relevent industries related to the Armenia Chloromethane Market, allowing our clients with actionable intelligence and reliable forecasts tailored to emerging regional needs.
Yes, we provide customisation as per your requirements. To learn more, feel free to contact us on sales@6wresearch.com
1 Executive Summary |
2 Introduction |
2.1 Key Highlights of the Report |
2.2 Report Description |
2.3 Market Scope & Segmentation |
2.4 Research Methodology |
2.5 Assumptions |
3 Armenia Chloromethane Market Overview |
3.1 Armenia Country Macro Economic Indicators |
3.2 Armenia Chloromethane Market Revenues & Volume, 2022 & 2032F |
3.3 Armenia Chloromethane Market - Industry Life Cycle |
3.4 Armenia Chloromethane Market - Porter's Five Forces |
3.5 Armenia Chloromethane Market Revenues & Volume Share, By Product, 2022 & 2032F |
3.6 Armenia Chloromethane Market Revenues & Volume Share, By Application, 2022 & 2032F |
3.7 Armenia Chloromethane Market Revenues & Volume Share, By End-use, 2022 & 2032F |
4 Armenia Chloromethane Market Dynamics |
4.1 Impact Analysis |
4.2 Market Drivers |
4.2.1 Growing demand for chloromethane in various industries such as pharmaceuticals, agrochemicals, and plastics due to its versatile applications. |
4.2.2 Increasing investments in industrial infrastructure and manufacturing facilities in Armenia, driving the demand for chloromethane as a key chemical input. |
4.2.3 Favorable government regulations and policies supporting the growth of the chemical industry in Armenia. |
4.3 Market Restraints |
4.3.1 Fluctuating raw material prices impacting the production cost of chloromethane. |
4.3.2 Competition from substitutes and alternative chemicals affecting the market share of chloromethane. |
4.3.3 Environmental concerns and regulations regarding the use and disposal of chloromethane impacting its market growth. |
5 Armenia Chloromethane Market Trends |
6 Armenia Chloromethane Market Segmentations |
6.1 Armenia Chloromethane Market, By Product |
6.1.1 Overview and Analysis |
6.1.2 Armenia Chloromethane Market Revenues & Volume, By Methylene Chloride, 2022-2032F |
6.1.3 Armenia Chloromethane Market Revenues & Volume, By Methyl Chloride, 2022-2032F |
6.1.4 Armenia Chloromethane Market Revenues & Volume, By Carbon Tetrachloride, 2022-2032F |
6.1.5 Armenia Chloromethane Market Revenues & Volume, By Chloroform, 2022-2032F |
6.1.6 Armenia Chloromethane Market Revenues & Volume, By Others, 2022-2032F |
6.2 Armenia Chloromethane Market, By Application |
6.2.1 Overview and Analysis |
6.2.2 Armenia Chloromethane Market Revenues & Volume, By Refrigerant, 2022-2032F |
6.2.3 Armenia Chloromethane Market Revenues & Volume, By Industrial Solvent, 2022-2032F |
6.2.4 Armenia Chloromethane Market Revenues & Volume, By Silicone Polymers, 2022-2032F |
6.2.5 Armenia Chloromethane Market Revenues & Volume, By Laboratory Chemicals, 2022-2032F |
6.2.6 Armenia Chloromethane Market Revenues & Volume, By Chemical Intermediates, 2022-2032F |
6.2.7 Armenia Chloromethane Market Revenues & Volume, By Methylating & Chlorinating Agent, 2022-2032F |
6.2.8 Armenia Chloromethane Market Revenues & Volume, By Catalyst Carrier, 2022-2032F |
6.2.9 Armenia Chloromethane Market Revenues & Volume, By Catalyst Carrier, 2022-2032F |
6.3 Armenia Chloromethane Market, By End-use |
6.3.1 Overview and Analysis |
6.3.2 Armenia Chloromethane Market Revenues & Volume, By Pharmaceutical, 2022-2032F |
6.3.3 Armenia Chloromethane Market Revenues & Volume, By Agrochemicals, 2022-2032F |
6.3.4 Armenia Chloromethane Market Revenues & Volume, By Textile, 2022-2032F |
6.3.5 Armenia Chloromethane Market Revenues & Volume, By Automotive, 2022-2032F |
6.3.6 Armenia Chloromethane Market Revenues & Volume, By Construction, 2022-2032F |
6.3.7 Armenia Chloromethane Market Revenues & Volume, By Paints & Coatings, 2022-2032F |
6.3.8 Armenia Chloromethane Market Revenues & Volume, By Plastics & Rubber, 2022-2032F |
6.3.9 Armenia Chloromethane Market Revenues & Volume, By Plastics & Rubber, 2022-2032F |
7 Armenia Chloromethane Market Import-Export Trade Statistics |
7.1 Armenia Chloromethane Market Export to Major Countries |
7.2 Armenia Chloromethane Market Imports from Major Countries |
8 Armenia Chloromethane Market Key Performance Indicators |
8.1 Capacity utilization rate of chloromethane production facilities in Armenia. |
8.2 Average selling price of chloromethane in the Armenian market. |
8.3 Rate of adoption of chloromethane in new applications or industries in Armenia. |
8.4 Number of research and development projects focused on improving chloromethane production processes or developing new applications. |
9 Armenia Chloromethane Market - Opportunity Assessment |
9.1 Armenia Chloromethane Market Opportunity Assessment, By Product, 2022 & 2032F |
9.2 Armenia Chloromethane Market Opportunity Assessment, By Application, 2022 & 2032F |
9.3 Armenia Chloromethane Market Opportunity Assessment, By End-use, 2022 & 2032F |
10 Armenia Chloromethane Market - Competitive Landscape |
10.1 Armenia Chloromethane Market Revenue Share, By Companies, 2025 |
10.2 Armenia Chloromethane Market Competitive Benchmarking, By Operating and Technical Parameters |
11 Company Profiles |
12 Recommendations | 13 Disclaimer |
Global Go To Market Strategy - 2030
Export potential enables firms to identify high-growth global markets with greater confidence by combining advanced trade intelligence with a structured quantitative methodology. The framework analyzes emerging demand trends and country-level import patterns while integrating macroeconomic and trade datasets such as GDP and population forecasts, bilateral import–export flows, tariff structures, elasticity differentials between developed and developing economies, geographic distance, and import demand projections. Using weighted trade values from 2020–2024 as the base period to project country-to-country export potential for 2030, these inputs are operationalized through calculated drivers such as gravity model parameters, tariff impact factors, and projected GDP per-capita growth. Through an analysis of hidden potentials, demand hotspots, and market conditions that are most favorable to success, this method enables firms to focus on target countries, maximize returns, and global expansion with data, backed by accuracy.
By factoring in the projected importer demand gap that is currently unmet and could be potential opportunity, it identifies the potential for the Exporter (Country) among 190 countries, against the general trade analysis, which identifies the biggest importer or exporter.
To discover high-growth global markets and optimize your business strategy:
Click Here
Pricing
- Single User License$ 1,995
- Department License$ 2,400
- Site License$ 3,120
- Global License$ 3,795

Leadership Perspectives from Industry Events
Search
Thought Leadership and Analyst Meet


Our Clients
6WResearch In News
- India Export Attractiveness Tracker 2026
- India Air Conditioner Market Set for Strong Rebound in 2026 After Weather-Led Correction and GST-Driven Recovery: 6Wresearch
- ADAS in India: How Automatic Emergency Braking, Blind Spot Detection & Driver Monitoring are Transforming Road Safety
- Doha a strategic location for EV manufacturing hub: IPA Qatar
- Demand for luxury TVs surging in the GCC, says Samsung
- Empowering Growth: The Thriving Journey of Bangladesh’s Cable Industry
Latest Reports
- Nicaragua RPG Gaming Market (2026-2032)
- New Zealand RPG Gaming Market (2026-2032)
- Netherlands RPG Gaming Market (2026-2032)
- Nauru RPG Gaming Market (2026-2032)
- Namibia RPG Gaming Market (2026-2032)
- Mozambique RPG Gaming Market (2026-2032)
- Montenegro RPG Gaming Market (2026-2032)
- Mongolia RPG Gaming Market (2026-2032)
- Monaco RPG Gaming Market (2026-2032)
- Micronesia RPG Gaming Market (2026-2032)
Industry Events and Analyst Meet

EV India Expo 2026

HIMTEX 2026

India Refining Summit 2026

India EV Show 2026

EV tech India Expo 2026
Whitepaper
- Middle East & Africa Commercial Security Market Click here to view more.
- Middle East & Africa Fire Safety Systems & Equipment Market Click here to view more.
- GCC Drone Market Click here to view more.
- Middle East Lighting Fixture Market Click here to view more.
- GCC Physical & Perimeter Security Market Click here to view more.