Armenia Construction Sealants Market (2026-2032) | Size, Trends, Segmentation, Industry, Forecast, Companies, Outlook, Revenue, Growth, Analysis, Value & Share
Market Forecast By Resin Type (Silicone, Polyurethane, Polysulfide), By Application (Glazing, Flooring & Joining, Sanitary & Kitchen) And Competitive Landscape
| Product Code: ETC5732944 | Publication Date: Nov 2023 | Updated Date: Mar 2026 | Product Type: Market Research Report | |
| Publisher: 6Wresearch | Author: Sumit Sagar | No. of Pages: 60 | No. of Figures: 30 | No. of Tables: 5 |
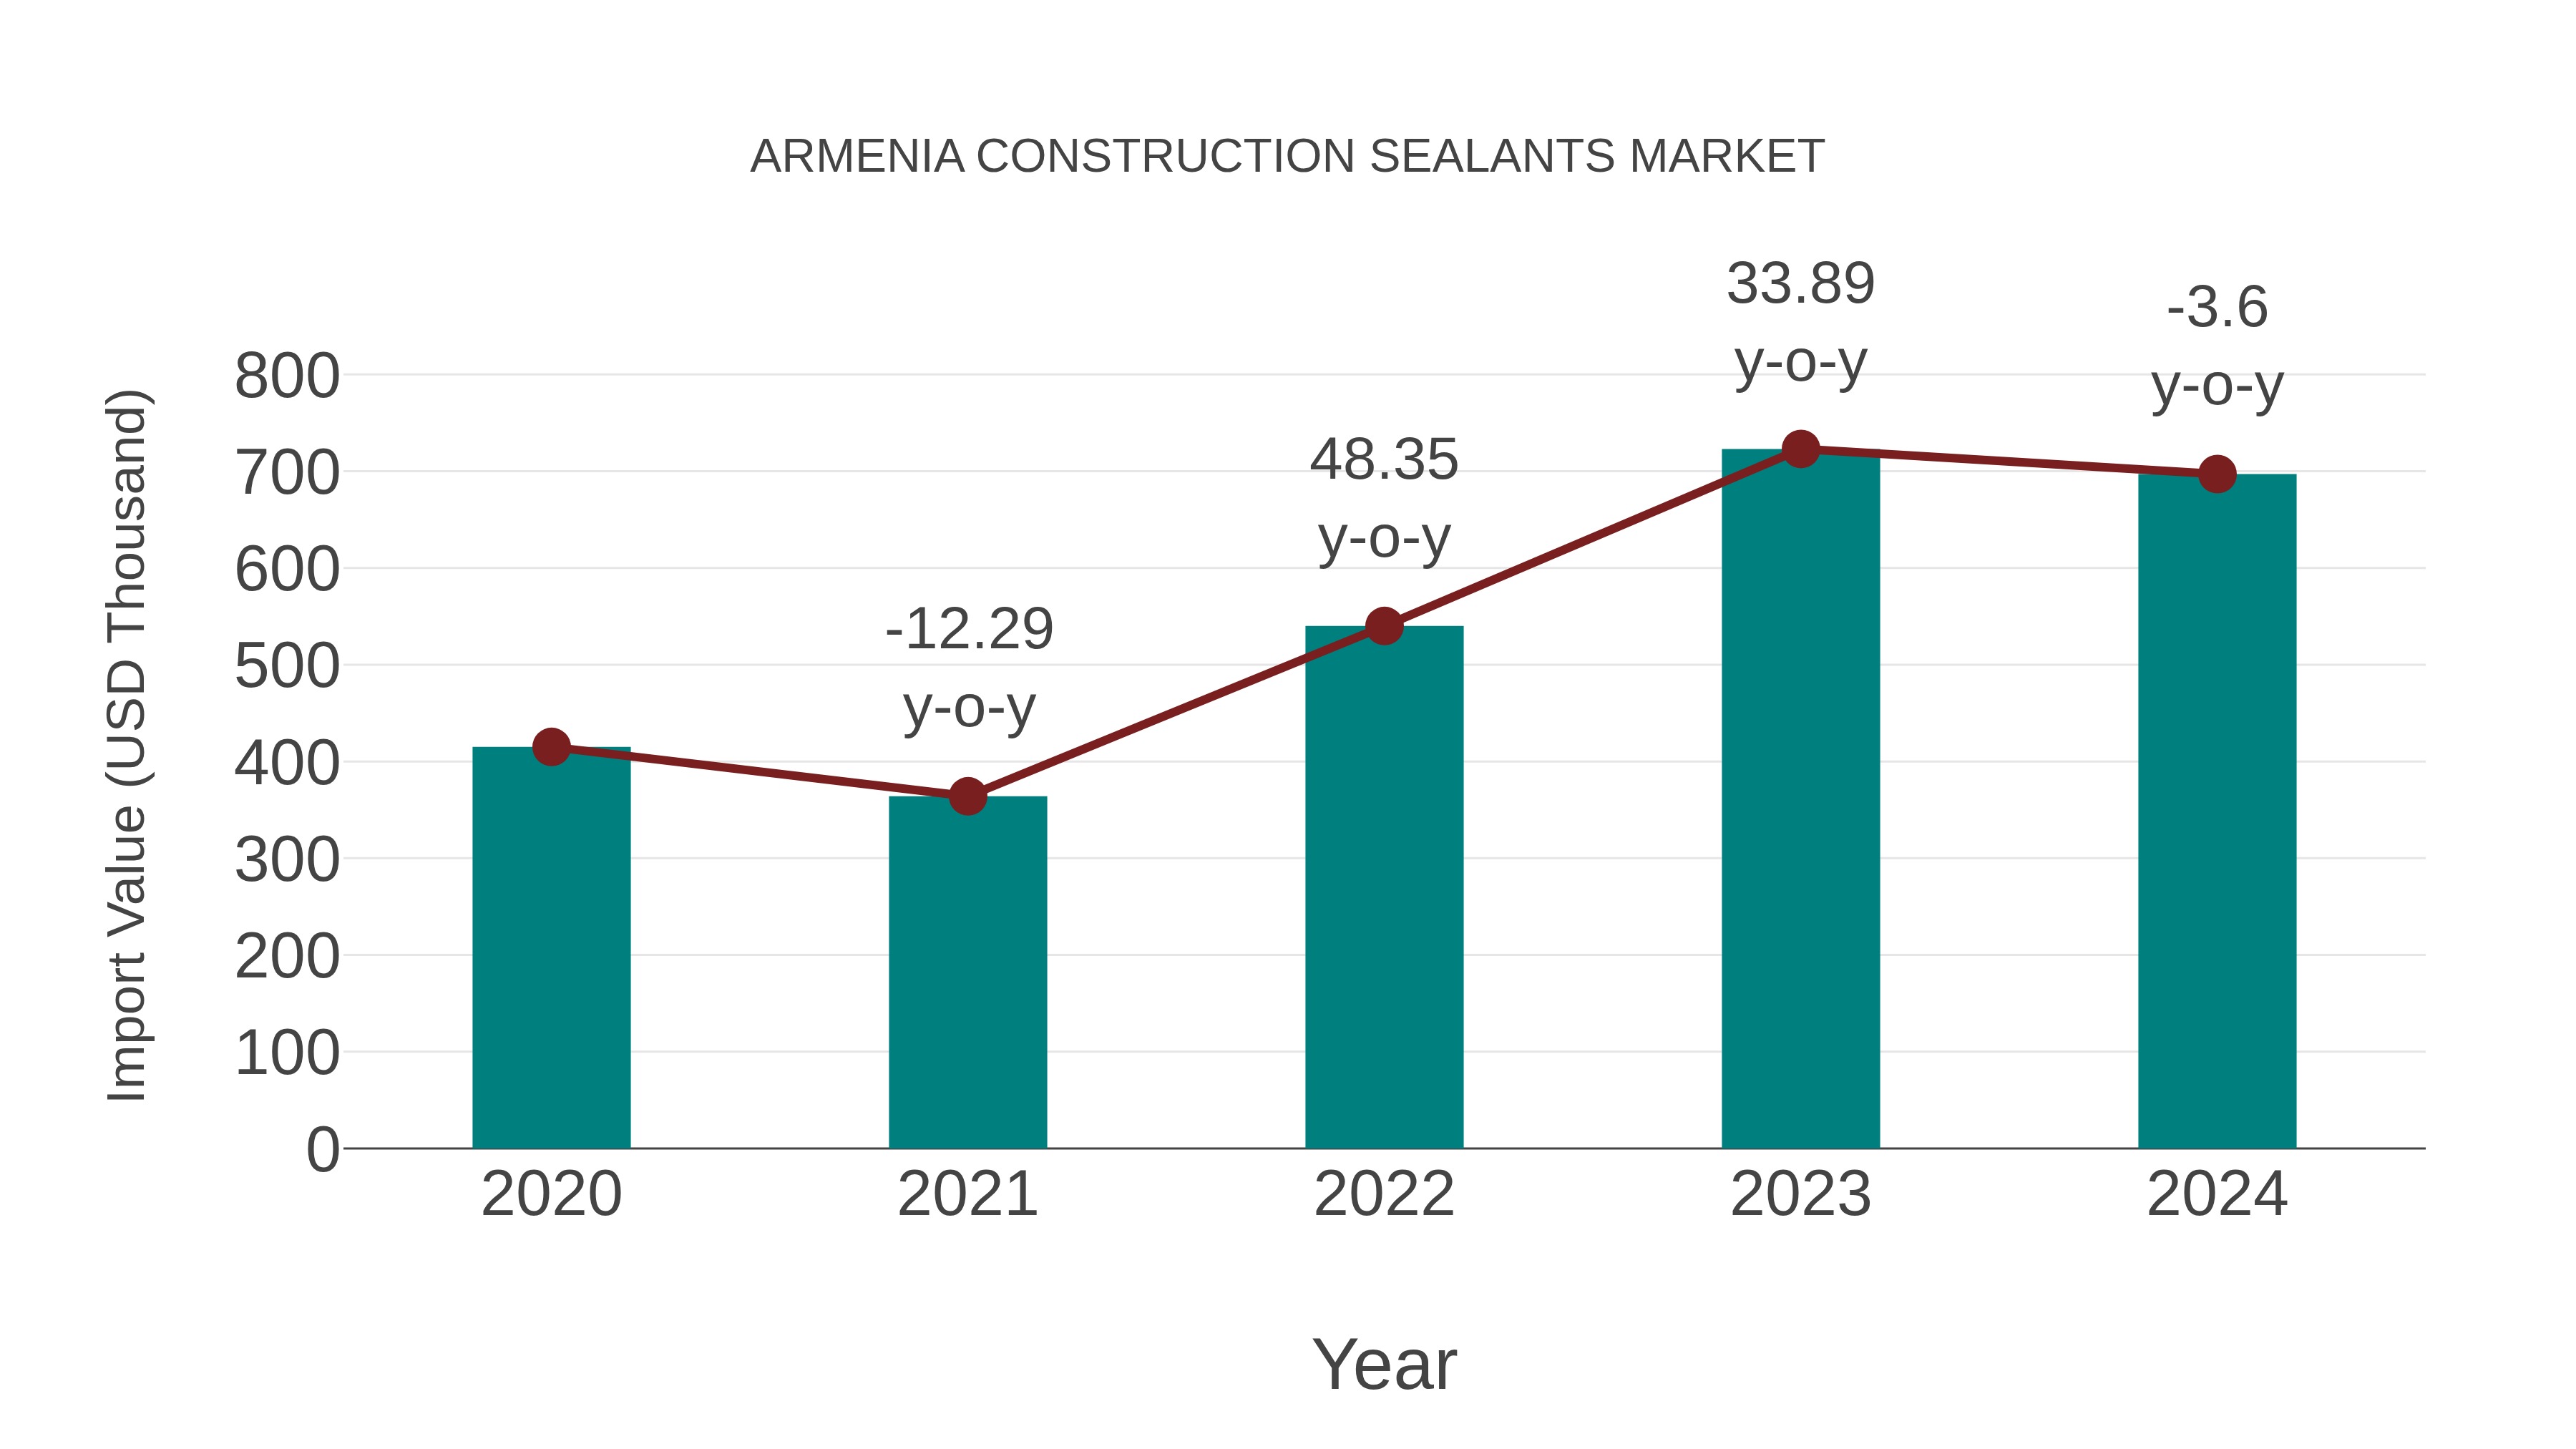
Armenia Construction Sealants Market: Import Trend Analysis
Armenia import trend for construction sealants in 2024 experienced a -3.6% decline from 2023, yet the compound annual growth rate (CAGR) for 2020-2024 stood at a robust 13.84%. This dip in import momentum could be attributed to shifting demand patterns within the construction sector or alterations in trade policies affecting the market stability.
Armenia Construction Sealants Market Overview
The Armenia construction sealants market includes products like silicone sealants, polyurethane sealants, and other specialty sealants used for sealing joints and gaps in construction materials. Market growth is influenced by construction activity levels, weatherproofing requirements, and advancements in sealant technology.
Drivers of the market
In Armenia, the Construction Sealants Market is driven by the growing demand for sealants in waterproofing and weatherproofing applications. Key drivers include the increasing construction of residential and commercial buildings, which necessitates effective sealing solutions to enhance structural integrity and energy efficiency.
Challenges of the market
The Armenia construction sealants market faces challenges related to product differentiation and innovation. With a growing emphasis on sustainability and energy efficiency in building construction, there is an increasing demand for eco-friendly sealants that meet stringent environmental standards. However, the development of such products requires substantial investment in research and development, posing a challenge for smaller manufacturers. Moreover, competitive pricing pressures and the presence of well-established international brands in the market intensify competition, limiting the market share of local sealant producers.
Government Policy of the market
In Armenia, government policies for the construction sealants market prioritize building safety and energy efficiency. Regulations enforce standards for sealant performance, durability, and resistance to environmental factors. The government promotes the use of sealants that contribute to energy conservation and reduce heat loss in buildings. Policies may include subsidies for energy-efficient sealants and tax incentives for manufacturers adopting sustainable production practices. Additionally, regulatory bodies monitor compliance with health and safety standards in the application and disposal of sealants to minimize environmental impact.
Key Highlights of the Report:
- Armenia Construction Sealants Market Outlook
- Market Size of Armenia Construction Sealants Market, 2025
- Forecast of Armenia Construction Sealants Market, 2032
- Historical Data and Forecast of Armenia Construction Sealants Revenues & Volume for the Period 2022-2032F
- Armenia Construction Sealants Market Trend Evolution
- Armenia Construction Sealants Market Drivers and Challenges
- Armenia Construction Sealants Price Trends
- Armenia Construction Sealants Porter`s Five Forces
- Armenia Construction Sealants Industry Life Cycle
- Historical Data and Forecast of Armenia Construction Sealants Market Revenues & Volume By Resin Type for the Period 2022-2032F
- Historical Data and Forecast of Armenia Construction Sealants Market Revenues & Volume By Silicone for the Period 2022-2032F
- Historical Data and Forecast of Armenia Construction Sealants Market Revenues & Volume By Polyurethane for the Period 2022-2032F
- Historical Data and Forecast of Armenia Construction Sealants Market Revenues & Volume By Polysulfide for the Period 2022-2032F
- Historical Data and Forecast of Armenia Construction Sealants Market Revenues & Volume By Application for the Period 2022-2032F
- Historical Data and Forecast of Armenia Construction Sealants Market Revenues & Volume By Glazing for the Period 2022-2032F
- Historical Data and Forecast of Armenia Construction Sealants Market Revenues & Volume By Flooring & Joining for the Period 2022-2032F
- Historical Data and Forecast of Armenia Construction Sealants Market Revenues & Volume By Sanitary & Kitchen for the Period 2022-2032F
- Armenia Construction Sealants Import Export Trade Statistics
- Market Opportunity Assessment By Resin Type
- Market Opportunity Assessment By Application
- Armenia Construction Sealants Top Companies Market Share
- Armenia Construction Sealants Competitive Benchmarking By Technical and Operational Parameters
- Armenia Construction Sealants Company Profiles
- Armenia Construction Sealants Key Strategic Recommendations
Armenia Construction Sealants Market (2026-2032): FAQs
6Wresearch actively monitors the Armenia Construction Sealants Market and publishes its comprehensive annual report, highlighting emerging trends, growth drivers, revenue analysis, and forecast outlook. Our insights help businesses to make data-backed strategic decisions with ongoing market dynamics. Our analysts track relevent industries related to the Armenia Construction Sealants Market, allowing our clients with actionable intelligence and reliable forecasts tailored to emerging regional needs.
Yes, we provide customisation as per your requirements. To learn more, feel free to contact us on sales@6wresearch.com
1 Executive Summary |
2 Introduction |
2.1 Key Highlights of the Report |
2.2 Report Description |
2.3 Market Scope & Segmentation |
2.4 Research Methodology |
2.5 Assumptions |
3 Armenia Construction Sealants Market Overview |
3.1 Armenia Country Macro Economic Indicators |
3.2 Armenia Construction Sealants Market Revenues & Volume, 2022 & 2032F |
3.3 Armenia Construction Sealants Market - Industry Life Cycle |
3.4 Armenia Construction Sealants Market - Porter's Five Forces |
3.5 Armenia Construction Sealants Market Revenues & Volume Share, By Resin Type, 2022 & 2032F |
3.6 Armenia Construction Sealants Market Revenues & Volume Share, By Application, 2022 & 2032F |
4 Armenia Construction Sealants Market Dynamics |
4.1 Impact Analysis |
4.2 Market Drivers |
4.2.1 Growth in the construction industry in Armenia |
4.2.2 Increasing demand for sustainable and energy-efficient construction solutions |
4.2.3 Technological advancements leading to the development of innovative sealant products |
4.3 Market Restraints |
4.3.1 Fluctuating raw material prices impacting production costs |
4.3.2 Regulatory challenges in the construction sector |
4.3.3 Competition from substitute products like mechanical fasteners |
5 Armenia Construction Sealants Market Trends |
6 Armenia Construction Sealants Market Segmentations |
6.1 Armenia Construction Sealants Market, By Resin Type |
6.1.1 Overview and Analysis |
6.1.2 Armenia Construction Sealants Market Revenues & Volume, By Silicone, 2022-2032F |
6.1.3 Armenia Construction Sealants Market Revenues & Volume, By Polyurethane, 2022-2032F |
6.1.4 Armenia Construction Sealants Market Revenues & Volume, By Polysulfide, 2022-2032F |
6.2 Armenia Construction Sealants Market, By Application |
6.2.1 Overview and Analysis |
6.2.2 Armenia Construction Sealants Market Revenues & Volume, By Glazing, 2022-2032F |
6.2.3 Armenia Construction Sealants Market Revenues & Volume, By Flooring & Joining, 2022-2032F |
6.2.4 Armenia Construction Sealants Market Revenues & Volume, By Sanitary & Kitchen, 2022-2032F |
7 Armenia Construction Sealants Market Import-Export Trade Statistics |
7.1 Armenia Construction Sealants Market Export to Major Countries |
7.2 Armenia Construction Sealants Market Imports from Major Countries |
8 Armenia Construction Sealants Market Key Performance Indicators |
8.1 Number of new construction projects in Armenia utilizing sealants |
8.2 Adoption rate of eco-friendly sealant products in the market |
8.3 Investment in research and development for sealant innovations |
8.4 Customer satisfaction levels with the performance of sealant products |
8.5 Rate of adherence to industry standards and regulations in the sealants market |
9 Armenia Construction Sealants Market - Opportunity Assessment |
9.1 Armenia Construction Sealants Market Opportunity Assessment, By Resin Type, 2022 & 2032F |
9.2 Armenia Construction Sealants Market Opportunity Assessment, By Application, 2022 & 2032F |
10 Armenia Construction Sealants Market - Competitive Landscape |
10.1 Armenia Construction Sealants Market Revenue Share, By Companies, 2025 |
10.2 Armenia Construction Sealants Market Competitive Benchmarking, By Operating and Technical Parameters |
11 Company Profiles |
12 Recommendations | 13 Disclaimer |
Global Go To Market Strategy - 2030
Export potential enables firms to identify high-growth global markets with greater confidence by combining advanced trade intelligence with a structured quantitative methodology. The framework analyzes emerging demand trends and country-level import patterns while integrating macroeconomic and trade datasets such as GDP and population forecasts, bilateral import–export flows, tariff structures, elasticity differentials between developed and developing economies, geographic distance, and import demand projections. Using weighted trade values from 2020–2024 as the base period to project country-to-country export potential for 2030, these inputs are operationalized through calculated drivers such as gravity model parameters, tariff impact factors, and projected GDP per-capita growth. Through an analysis of hidden potentials, demand hotspots, and market conditions that are most favorable to success, this method enables firms to focus on target countries, maximize returns, and global expansion with data, backed by accuracy.
By factoring in the projected importer demand gap that is currently unmet and could be potential opportunity, it identifies the potential for the Exporter (Country) among 190 countries, against the general trade analysis, which identifies the biggest importer or exporter.
To discover high-growth global markets and optimize your business strategy:
Click Here
Pricing
- Single User License$ 1,995
- Department License$ 2,400
- Site License$ 3,120
- Global License$ 3,795

Leadership Perspectives from Industry Events
Search
Thought Leadership and Analyst Meet


Our Clients
6WResearch In News
- Doha a strategic location for EV manufacturing hub: IPA Qatar
- Demand for luxury TVs surging in the GCC, says Samsung
- Empowering Growth: The Thriving Journey of Bangladesh’s Cable Industry
- Demand for luxury TVs surging in the GCC, says Samsung
- Video call with a traditional healer? Once unthinkable, it’s now common in South Africa
- Intelligent Buildings To Smooth GCC’s Path To Net Zero
Latest Reports
- New Zealand Aseptic Manufacturing Market (2026-2032)
- Netherlands Aseptic Manufacturing Market (2026-2032)
- Nauru Aseptic Manufacturing Market (2026-2032)
- Namibia Aseptic Manufacturing Market (2026-2032)
- Mozambique Aseptic Manufacturing Market (2026-2032)
- Montenegro Aseptic Manufacturing Market (2026-2032)
- Mongolia Aseptic Manufacturing Market (2026-2032)
- Monaco Aseptic Manufacturing Market (2026-2032)
- Micronesia Aseptic Manufacturing Market (2026-2032)
- Mauritius Aseptic Manufacturing Market (2026-2032)
Industry Events and Analyst Meet

HIMTEX 2026

India Refining Summit 2026

India EV Show 2026

EV tech India Expo 2026

Auto Tech Asia 2026
Whitepaper
- Middle East & Africa Commercial Security Market Click here to view more.
- Middle East & Africa Fire Safety Systems & Equipment Market Click here to view more.
- GCC Drone Market Click here to view more.
- Middle East Lighting Fixture Market Click here to view more.
- GCC Physical & Perimeter Security Market Click here to view more.