Armenia Potassium sulphate Market (2026-2032) | Trends, Revenue, Analysis, Size, Share, Companies, Industry, Outlook, Forecast, Growth, Value & Segmentation
Market Forecast By Form (Solid, Liquid), By Process (Mannheim Process, Sulphate Salts Reaction, Brine Processing, Others), By End-users (Agriculture, Industrial, Pharmaceuticals, Cosmetics, Food & Beverages, Others) And Competitive Landscape
| Product Code: ETC4703942 | Publication Date: Nov 2023 | Updated Date: Mar 2026 | Product Type: Market Research Report | |
| Publisher: 6Wresearch | Author: Shubham Deep | No. of Pages: 60 | No. of Figures: 30 | No. of Tables: 5 |
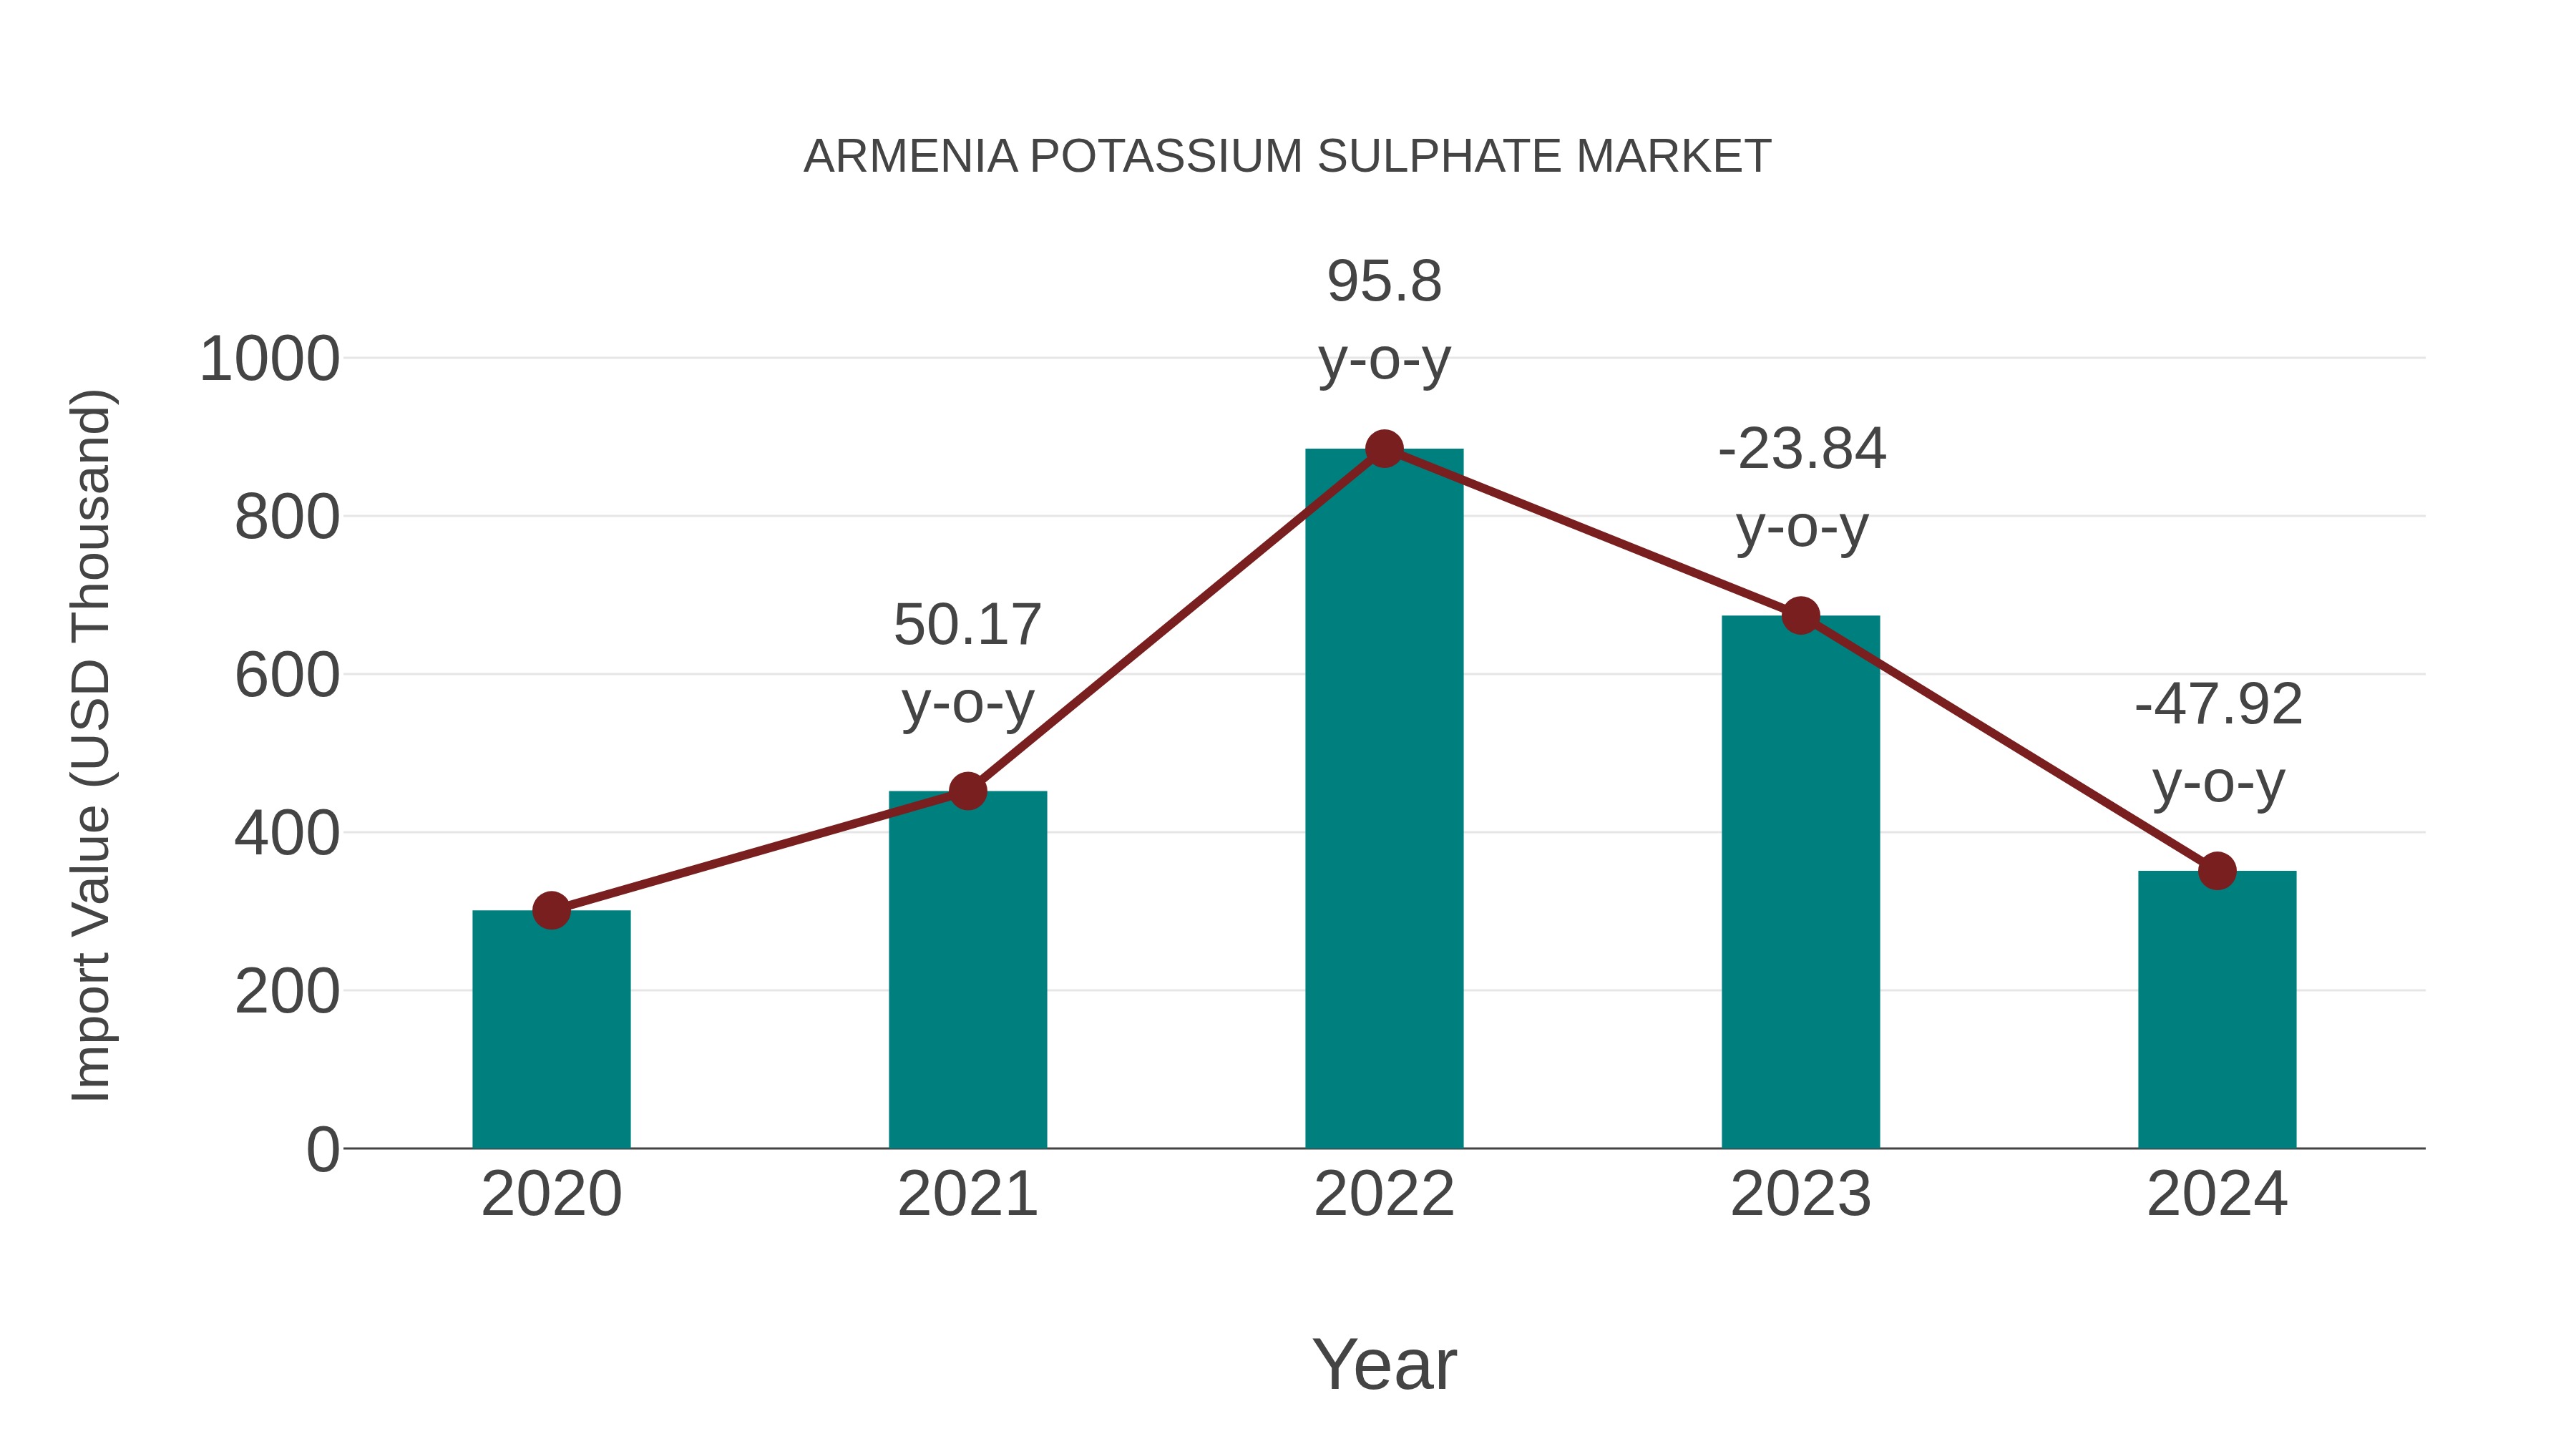
Armenia Potassium Sulphate Market: Import Trend Analysis
Armenia import trend for potassium sulphate in 2024 experienced a significant decline, with a growth rate of -47.92% compared to the previous year. However, the compound annual growth rate (CAGR) for the period 2020-2024 stood at 3.92%. This substantial decrease in import momentum in 2024 may be attributed to shifts in demand dynamics or changes in trade policies impacting the market stability.
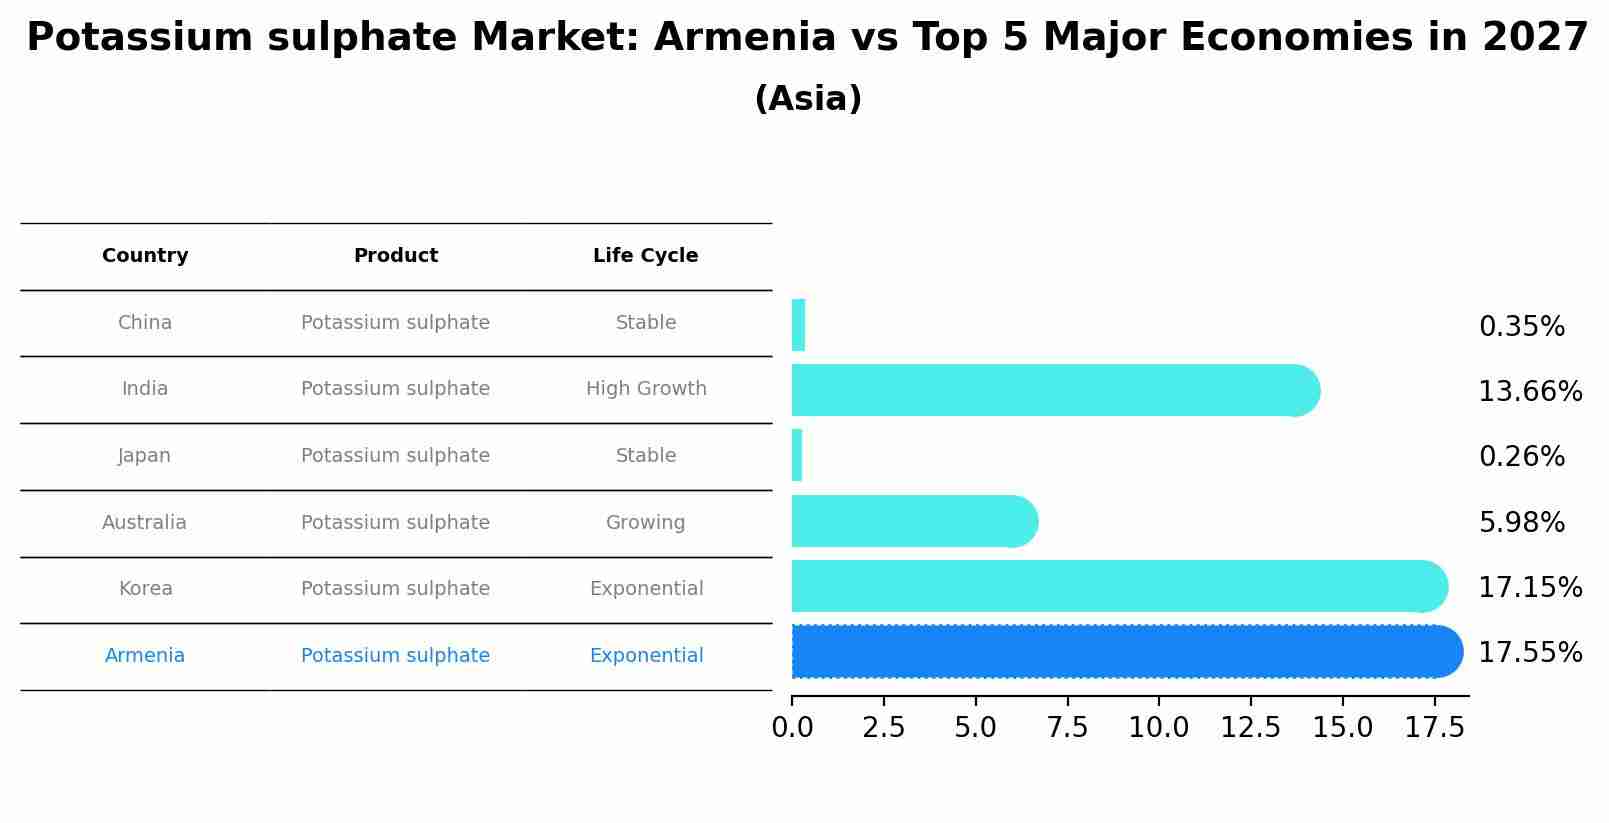
Potassium sulphate Market: Armenia vs Top 5 Major Economies in 2027 (Asia)
The Potassium sulphate market in Armenia is projected to grow at a exponential growth rate of 17.55% by 2027, within the Asia region led by China, along with other countries like India, Japan, Australia and South Korea, collectively shaping a dynamic and evolving market environment driven by innovation and increasing adoption of emerging technologies.
Armenia Potassium sulphate Market Overview
Armenia`s potassium sulfate market offers soluble fertilizer for supplying potassium and sulfur nutrients to crops in agriculture. Potassium sulfate improves soil fertility, nutrient uptake, and plant growth, supporting sustainable agricultural practices and crop productivity.
Drivers of the market
The drivers for the potassium sulphate market in Armenia include its applications in agriculture as a fertilizer and in the chemical industry. Potassium sulphate provides essential nutrients that promote plant growth and improve crop yield, particularly in chloride-sensitive crops. The increasing focus on enhancing agricultural productivity and the rising demand for food due to population growth fuel the market. Additionally, the use of potassium sulphate in various industrial processes and the development of more efficient and environmentally friendly products further support market growth.
Challenges of the market
The Potassium Sulphate market in Armenia encounters challenges such as optimizing sulfate content and nutrient balance in potassium sulfate fertilizers, ensuring compatibility with soil pH levels and crop nutrient uptake rates, and addressing market competition from alternative potassium sources. Innovating in dual-nutrient fertilizers and developing specialty sulfate formulations are essential for enhancing agricultural productivity and promoting sustainable farming practices in Armenia.
Government Policy of the market
In Armenia, government policies for the potassium sulfate market focus on supporting agricultural productivity through regulated fertilizer use. Policies aim to enhance domestic manufacturing capacities and ensure compliance with international standards for chemical production and distribution.
Key Highlights of the Report:
- Armenia Potassium sulphate Market Outlook
- Market Size of Armenia Potassium sulphate Market, 2025
- Forecast of Armenia Potassium sulphate Market, 2032
- Historical Data and Forecast of Armenia Potassium sulphate Revenues & Volume for the Period 2022-2032F
- Armenia Potassium sulphate Market Trend Evolution
- Armenia Potassium sulphate Market Drivers and Challenges
- Armenia Potassium sulphate Price Trends
- Armenia Potassium sulphate Porter`s Five Forces
- Armenia Potassium sulphate Industry Life Cycle
- Historical Data and Forecast of Armenia Potassium sulphate Market Revenues & Volume By Form for the Period 2022-2032F
- Historical Data and Forecast of Armenia Potassium sulphate Market Revenues & Volume By Solidfor the Period 2022-2032F
- Historical Data and Forecast of Armenia Potassium sulphate Market Revenues & Volume By Liquidfor the Period 2022-2032F
- Historical Data and Forecast of Armenia Potassium sulphate Market Revenues & Volume By Process for the Period 2022-2032F
- Historical Data and Forecast of Armenia Potassium sulphate Market Revenues & Volume By Mannheim Process for the Period 2022-2032F
- Historical Data and Forecast of Armenia Potassium sulphate Market Revenues & Volume By Sulphate Salts Reaction for the Period 2022-2032F
- Historical Data and Forecast of Armenia Potassium sulphate Market Revenues & Volume By Brine Processing for the Period 2022-2032F
- Historical Data and Forecast of Armenia Potassium sulphate Market Revenues & Volume By Others for the Period 2022-2032F
- Historical Data and Forecast of Armenia Potassium sulphate Market Revenues & Volume By End-users for the Period 2022-2032F
- Historical Data and Forecast of Armenia Potassium sulphate Market Revenues & Volume By Agriculture for the Period 2022-2032F
- Historical Data and Forecast of Armenia Potassium sulphate Market Revenues & Volume By Industrial for the Period 2022-2032F
- Historical Data and Forecast of Armenia Potassium sulphate Market Revenues & Volume By Pharmaceuticals for the Period 2022-2032F
- Historical Data and Forecast of Armenia Potassium sulphate Market Revenues & Volume By Cosmetics for the Period 2022-2032F
- Historical Data and Forecast of Armenia Potassium sulphate Market Revenues & Volume By Food & Beverages for the Period 2022-2032F
- Historical Data and Forecast of Armenia Potassium sulphate Market Revenues & Volume By Others for the Period 2022-2032F
- Armenia Potassium sulphate Import Export Trade Statistics
- Market Opportunity Assessment By Form
- Market Opportunity Assessment By Process
- Market Opportunity Assessment By End-users
- Armenia Potassium sulphate Top Companies Market Share
- Armenia Potassium sulphate Competitive Benchmarking By Technical and Operational Parameters
- Armenia Potassium sulphate Company Profiles
- Armenia Potassium sulphate Key Strategic Recommendations
Armenia Potassium sulphate Market (2026-2032): FAQs
6Wresearch actively monitors the Armenia Potassium sulphate Market and publishes its comprehensive annual report, highlighting emerging trends, growth drivers, revenue analysis, and forecast outlook. Our insights help businesses to make data-backed strategic decisions with ongoing market dynamics. Our analysts track relevent industries related to the Armenia Potassium sulphate Market, allowing our clients with actionable intelligence and reliable forecasts tailored to emerging regional needs.
Yes, we provide customisation as per your requirements. To learn more, feel free to contact us on sales@6wresearch.com
1 Executive Summary |
2 Introduction |
2.1 Key Highlights of the Report |
2.2 Report Description |
2.3 Market Scope & Segmentation |
2.4 Research Methodology |
2.5 Assumptions |
3 Armenia Potassium sulphate Market Overview |
3.1 Armenia Country Macro Economic Indicators |
3.2 Armenia Potassium sulphate Market Revenues & Volume, 2022 & 2032F |
3.3 Armenia Potassium sulphate Market - Industry Life Cycle |
3.4 Armenia Potassium sulphate Market - Porter's Five Forces |
3.5 Armenia Potassium sulphate Market Revenues & Volume Share, By Form, 2022 & 2032F |
3.6 Armenia Potassium sulphate Market Revenues & Volume Share, By Process, 2022 & 2032F |
3.7 Armenia Potassium sulphate Market Revenues & Volume Share, By End-users, 2022 & 2032F |
4 Armenia Potassium sulphate Market Dynamics |
4.1 Impact Analysis |
4.2 Market Drivers |
4.3 Market Restraints |
5 Armenia Potassium sulphate Market Trends |
6 Armenia Potassium sulphate Market Segmentations |
6.1 Armenia Potassium sulphate Market, By Form |
6.1.1 Overview and Analysis |
6.1.2 Armenia Potassium sulphate Market Revenues & Volume, By Solid? , 2022-2032F |
6.1.3 Armenia Potassium sulphate Market Revenues & Volume, By Liquid? , 2022-2032F |
6.2 Armenia Potassium sulphate Market, By Process |
6.2.1 Overview and Analysis |
6.2.2 Armenia Potassium sulphate Market Revenues & Volume, By Mannheim Process, 2022-2032F |
6.2.3 Armenia Potassium sulphate Market Revenues & Volume, By Sulphate Salts Reaction, 2022-2032F |
6.2.4 Armenia Potassium sulphate Market Revenues & Volume, By Brine Processing, 2022-2032F |
6.2.5 Armenia Potassium sulphate Market Revenues & Volume, By Others, 2022-2032F |
6.3 Armenia Potassium sulphate Market, By End-users |
6.3.1 Overview and Analysis |
6.3.2 Armenia Potassium sulphate Market Revenues & Volume, By Agriculture, 2022-2032F |
6.3.3 Armenia Potassium sulphate Market Revenues & Volume, By Industrial, 2022-2032F |
6.3.4 Armenia Potassium sulphate Market Revenues & Volume, By Pharmaceuticals, 2022-2032F |
6.3.5 Armenia Potassium sulphate Market Revenues & Volume, By Cosmetics, 2022-2032F |
6.3.6 Armenia Potassium sulphate Market Revenues & Volume, By Food & Beverages, 2022-2032F |
6.3.7 Armenia Potassium sulphate Market Revenues & Volume, By Others, 2022-2032F |
7 Armenia Potassium sulphate Market Import-Export Trade Statistics |
7.1 Armenia Potassium sulphate Market Export to Major Countries |
7.2 Armenia Potassium sulphate Market Imports from Major Countries |
8 Armenia Potassium sulphate Market Key Performance Indicators |
9 Armenia Potassium sulphate Market - Opportunity Assessment |
9.1 Armenia Potassium sulphate Market Opportunity Assessment, By Form, 2022 & 2032F |
9.2 Armenia Potassium sulphate Market Opportunity Assessment, By Process, 2022 & 2032F |
9.3 Armenia Potassium sulphate Market Opportunity Assessment, By End-users, 2022 & 2032F |
10 Armenia Potassium sulphate Market - Competitive Landscape |
10.1 Armenia Potassium sulphate Market Revenue Share, By Companies, 2025 |
10.2 Armenia Potassium sulphate Market Competitive Benchmarking, By Operating and Technical Parameters |
11 Company Profiles |
12 Recommendations | 13 Disclaimer |
Global Go To Market Strategy - 2030
Export potential enables firms to identify high-growth global markets with greater confidence by combining advanced trade intelligence with a structured quantitative methodology. The framework analyzes emerging demand trends and country-level import patterns while integrating macroeconomic and trade datasets such as GDP and population forecasts, bilateral import–export flows, tariff structures, elasticity differentials between developed and developing economies, geographic distance, and import demand projections. Using weighted trade values from 2020–2024 as the base period to project country-to-country export potential for 2030, these inputs are operationalized through calculated drivers such as gravity model parameters, tariff impact factors, and projected GDP per-capita growth. Through an analysis of hidden potentials, demand hotspots, and market conditions that are most favorable to success, this method enables firms to focus on target countries, maximize returns, and global expansion with data, backed by accuracy.
By factoring in the projected importer demand gap that is currently unmet and could be potential opportunity, it identifies the potential for the Exporter (Country) among 190 countries, against the general trade analysis, which identifies the biggest importer or exporter.
To discover high-growth global markets and optimize your business strategy:
Click Here
Pricing
- Single User License$ 1,995
- Department License$ 2,400
- Site License$ 3,120
- Global License$ 3,795

Leadership Perspectives from Industry Events
Search
Thought Leadership and Analyst Meet


Our Clients
6WResearch In News
- India Air Conditioner Market Set for Strong Rebound in 2026 After Weather-Led Correction and GST-Driven Recovery: 6Wresearch
- ADAS in India: How Automatic Emergency Braking, Blind Spot Detection & Driver Monitoring are Transforming Road Safety
- Doha a strategic location for EV manufacturing hub: IPA Qatar
- Demand for luxury TVs surging in the GCC, says Samsung
- Empowering Growth: The Thriving Journey of Bangladesh’s Cable Industry
- Demand for luxury TVs surging in the GCC, says Samsung
Latest Reports
- Nicaragua RPG Gaming Market (2026-2032)
- New Zealand RPG Gaming Market (2026-2032)
- Netherlands RPG Gaming Market (2026-2032)
- Nauru RPG Gaming Market (2026-2032)
- Namibia RPG Gaming Market (2026-2032)
- Mozambique RPG Gaming Market (2026-2032)
- Montenegro RPG Gaming Market (2026-2032)
- Mongolia RPG Gaming Market (2026-2032)
- Monaco RPG Gaming Market (2026-2032)
- Micronesia RPG Gaming Market (2026-2032)
Industry Events and Analyst Meet

EV India Expo 2026

HIMTEX 2026

India Refining Summit 2026

India EV Show 2026

EV tech India Expo 2026
Whitepaper
- Middle East & Africa Commercial Security Market Click here to view more.
- Middle East & Africa Fire Safety Systems & Equipment Market Click here to view more.
- GCC Drone Market Click here to view more.
- Middle East Lighting Fixture Market Click here to view more.
- GCC Physical & Perimeter Security Market Click here to view more.