Asia Pacific Bus Duct Trunking System Market Outlook (2020-2025) | Revenue, Trends, Forecast, Industry, Analysis, Share, Value, Companies, COVID-19 IMPACT, Size & Growth
Market Forecast By Insulation (Air And Sandwich), By Power Range (Lighting Power Range, Low Power Range, Medium Power Range And High Power Range), By Conductor (Copper And Aluminium), By Applications (Commercial, Industrial, Residential, Transportation And Others Including Power Utilities, Argo-Industries, And Civil Buildings) By Countries (India, China, and Others) And Competitive Landscape
| Product Code: ETC150368 | Publication Date: Feb 2022 | Product Type: Market Research Report | ||
| Publisher: 6Wresearch | Author: Ravi Bhandari | No. of Pages: 120 | No. of Figures: 20 | No. of Tables: 5 |
Asia Pacific Bus Duct Trunking System Market report comprehensively covers the market by insulation, power rating, conductor, and applications. The Asia Pacific bus duct trunking system market outlook report provides an unbiased and detailed analysis of the Asia Pacific bus duct trunking system market trends, opportunities, high growth areas, and market drivers which would help the stakeholders to devise and align their market strategies according to the current and future market dynamics.
Asia Pacific Bus Duct Trunking System Market Synopsis
The Asia Pacific bus duct trunking market is amongst the fastest-growing markets, by region, in the world. This fast growth may be attributed to infrastructure development, surging foreign investments, and rapidly growing urbanization and population growth. As the majority of the countries in the Asia Pacific region are still developing, a major chunk of the market revenues are being generated from them. However, the Covid-19 pandemic had slowed down the market in terms of the supply of the product during 2020. While on the other hand, the demand-side also fell victim to the slowdown due to the market being closed during the lockdown period. Currently, the market has recovered gradually and is likely to witness growth over the coming years.
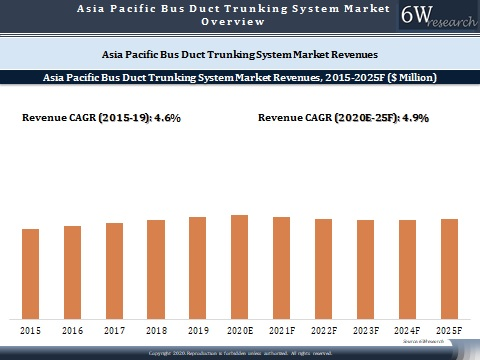
According to 6Wresearch, Asia Pacific Bus Duct Trunking System Market size is expected to grow at a CAGR of 4.9% during 2020-2025. The renovation and expansion of existing and development of new power grids, railway links, airports, schools, hotels, hospitals and other buildings are part of the governments’ immediate plans which, in turn, would act as a catalyst for the demand for bus duct trunking system in the years to come.
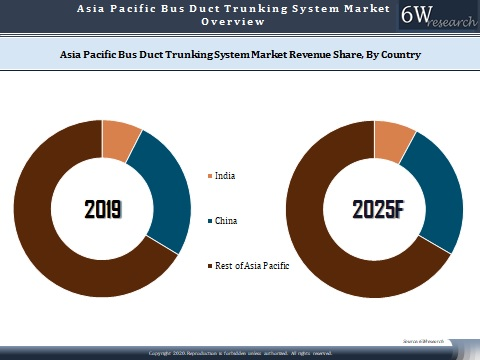
Market Analysis By Countries
In terms of countries, China dominates the overall Asia Pacific bus duct trunking system market in 2019. Further, India also held the majority of the market revenue share in 2019.
Key Attractiveness of the Report
- COVID-19 Impact on the Market.
- 10 Years Market Numbers.
- Historical Data Starting from 2015 to 2019.
- Base Year: 2019
- Forecast Data until 2025.
- Key Performance Indicators Impacting the Market.
- Major Upcoming Developments and Projects.
Key Highlights of the Report:
- Asia Pacific Bus Duct Market Overview
- Asia Pacific Bus Duct Market Outlook
- Asia Pacific Bus Duct Market Forecast
- Historical Data of Asia Pacific Bus Duct Trunking System Market Revenues for the Period 2015-2019
- Market Size & Forecast of Asia Pacific Bus Duct Trunking System Market Revenues, Until 2025F
- Historical Data of Asia Pacific Bus Duct Trunking System Market Revenues, by Insulation, for the Period 2015-2019
- Market Size & Forecast of ASIA PACIFIC Bus Duct Trunking System Market Revenues, by Insulation, Until 2025F
- Historical Data of ASIA PACIFIC Bus Duct Trunking System Market Revenues, by Power Rating, for the Period 2015-2019
- Market Size & Forecast of ASIA PACIFIC Bus Duct Trunking System Market Revenues, by Power Rating, Until 2025F
- Historical Data of ASIA PACIFIC Bus Duct Trunking System Market Revenues, by Conductor, for the Period 2015-2019
- Market Size & Forecast of ASIA PACIFIC Bus Duct Trunking System Market Revenues, by Conductor, Until 2025F
- Historical Data of ASIA PACIFIC Bus Duct Trunking System Market Revenues, By Applications, for the Period 2015-2019
- Market Size & Forecast of ASIA PACIFIC Bus Duct Trunking System Market Revenues, By Applications, Until 2025F
- Market Drivers and Restraints
- Market Trends and Industry Life Cycle
- Porter’s Five Force Analysis
- Market Opportunity Assessment
- Asia Pacific Bus Duct Market Revenue Share, By Players
- Asia Pacific Bus Duct Market Overview Market on Competitive Benchmarking
- Company Profiles
- Key Strategic Recommendations
Market Scope and Segmentation
Thereport provides a detailed analysis of the following market segments:
By Insulation
- Air
- Sandwich
By Power Range
- Lighting Power Range
- Low Power Range
- Medium Power Range
- High Power Range
By Conductor
- Copper
- Aluminum
By Applications
- Commercial
- Industrial
- Residential
- Transportation
- Others (Power Utilities, Argo-industries, and Civil Buildings)
By Countries
- India
- China
- Others
Frequently Asked Questions About the Market Study (FAQs):
6Wresearch actively monitors the Asia Pacific Bus Duct Trunking System Market and publishes its comprehensive annual report, highlighting emerging trends, growth drivers, revenue analysis, and forecast outlook. Our insights help businesses to make data-backed strategic decisions with ongoing market dynamics. Our analysts track relevent industries related to the Asia Pacific Bus Duct Trunking System Market, allowing our clients with actionable intelligence and reliable forecasts tailored to emerging regional needs.
Yes, we provide customisation as per your requirements. To learn more, feel free to contact us on sales@6wresearch.com
| 1. Executive Summary |
| 2. Introduction |
| 2.1. Report Description |
| 2.2. Key Highlights of the Report |
| 2.3. Market Scope & Segmentation |
| 2.4. Research Methodology |
| 2.5. Assumptions |
| 3. Asia Pacific Bus Duct Trunking System Market Overview |
| 3.1. Asia Pacific Bus Duct Trunking System Market Revenues, 2015-2025F |
| 3.2. Asia Pacific Bus Duct Trunking System Market - Industry Life Cycle, 2019 |
| 3.3. Asia Pacific Bus Duct Trunking System Market - Porter’s Five Forces |
| 3.4. Asia Pacific Bus Duct Trunking System Market Revenue Share, By Insulation, 2019 & 2025F |
| 3.5. Asia Pacific Bus Duct Trunking System Market Revenue Share, By Power Rating, 2019 & 2025F |
| 3.6. Asia Pacific Bus Duct Trunking System Market Revenue Share, By Conductor, 2019 & 2025F |
| 3.7. Asia Pacific Bus Duct Trunking System Market Revenue Share, By Application, 2019 & 2025F |
| 3.8. Asia Pacific Bus Duct Trunking System Market Revenue Share, By Region, 2019 & 2025F |
| 4. Asia Pacific Bus Duct Trunking System Market Dynamics |
| 4.1. Impact Analysis |
| 4.2. Market Drivers |
| 4.3. Market Restraints |
| 5. Asia Pacific Bus Duct Trunking System Market Trends |
| 6. the Asia Pacific Bus Duct Trunking System Market Overview |
| 6.1. the Asia Pacific Bus Duct Trunking System Market Revenues, 2015-2025F |
| 6.2. the Asia Pacific Bus Duct Trunking System Market Revenue Share, By Country, 2019 & 2025F |
| 6.3. India Bus Duct Trunking System Market Overview |
| 6.3.1. India Key Country Indicators |
| 6.3.2. India Bus Duct Trunking System Market Revenues, 2015-2025F |
| 6.3.3. India Bus Duct Trunking System Market Overview, By Insulation |
| 6.3.3.1. India Bus Duct Trunking System Market Revenue Share, By Insulation, 2019 & 2025F |
| 6.3.3.2. India Bus Duct Trunking System Market Revenues, By Air Insulation, 2015-2025F |
| 6.3.3.3. India Bus Duct Trunking System Market Revenues, By Sandwich Insulation, 2015-2025F |
| 6.3.4. India Bus Duct Trunking System Market Overview, By Power Rating |
| 6.3.4.1. India Bus Duct Trunking System Market Revenue Share, By Power Rating, 2019 & 2025F |
| 6.3.4.2. India Lighting Power Rating Bus Duct Trunking System Market Revenues, 2015-2025F |
| 6.3.4.3. India Low Power Rating Bus Duct Trunking System Market Revenues, 2015-2025F |
| 6.3.4.4. India Medium Power Rating Bus Duct Trunking System Market Revenues, 2015-2025F |
| 6.3.4.5. India High Power Rating Bus Duct Trunking System Market Revenues, 2015-2025F |
| 6.3.5. India Bus Duct Trunking System Market Overview, By Conductor |
| 6.3.5.1. India Bus Duct Trunking System Market Revenue Share, By Conductor, 2019 & 2025F |
| 6.3.5.2. India Copper Conductor Bus Duct Trunking System Market Revenues, 2015-2025F |
| 6.3.5.3. India Aluminium Conductor Bus Duct Trunking System Market Revenues, 2015-2025F |
| 6.3.6. India Bus Duct Trunking System Market Overview, By Application |
| 6.3.6.1. India Bus Duct Trunking System Market Revenue Share, By Application, 2019 & 2025F |
| 6.3.6.2. India Bus Duct Trunking System Market Revenues, By Commercial Application, 2015-2025F |
| 6.3.6.3. India Bus Duct Trunking System Market Revenues, By Industrial Application, 2015-2025F |
| 6.3.6.4. India Bus Duct Trunking System Market Revenues, By Residential Application, 2015-2025F |
| 6.3.6.5. India Bus Duct Trunking System Market Revenues, By Transportation Application, 2015-2025F |
| 6.3.6.6. India Bus Duct Trunking System Market Revenues, By Other Application, 2015-2025F |
| 6.3.7. India Bus Duct Trunking System Market - Key Performance Indicators |
| 6.4. CHINA Bus Duct Trunking System Market Overview |
| 6.4.1. CHINA Key Country Indicators |
| 6.4.2. CHINA Bus Duct Trunking System Market Revenues, 2015-2025F |
| 6.4.3. CHINA Bus Duct Trunking System Market Overview, By Insulation |
| 6.4.3.1. CHINA Bus Duct Trunking System Market Revenue Share, By Insulation, 2019 & 2025F |
| 6.4.3.2. CHINA Bus Duct Trunking System Market Revenues, By Air Insulation, 2015-2025F |
| 6.4.3.3. CHINA Bus Duct Trunking System Market Revenues, By Sandwich Insulation, 2015-2025F |
| 6.4.4. CHINA Bus Duct Trunking System Market Overview, By Power Rating |
| 6.4.4.1. CHINA Bus Duct Trunking System Market Revenue Share, By Power Rating, 2019 & 2025F |
| 6.4.4.2. CHINA Lighting Power Rating Bus Duct Trunking System Market Revenues, 2015-2025F |
| 6.4.4.3. CHINA Low Power Rating Bus Duct Trunking System Market Revenues, 2015-2025F |
| 6.4.4.4. CHINA Medium Power Rating Bus Duct Trunking System Market Revenues, 2015-2025F |
| 6.4.4.5. CHINA High Power Rating Bus Duct Trunking System Market Revenues, 2015-2025F |
| 6.4.5. CHINA Bus Duct Trunking System Market Overview, By Conductor |
| 6.4.5.1. CHINA Bus Duct Trunking System Market Revenue Share, By Conductor, 2019 & 2025F |
| 6.4.5.2. CHINA Copper Conductor Bus Duct Trunking System Market Revenues, 2015-2025F |
| 6.4.5.3. CHINA Aluminium Conductor Bus Duct Trunking System Market Revenues, 2015-2025F |
| 6.4.6. CHINA Bus Duct Trunking System Market Overview, By Application |
| 6.4.6.1. CHINA Bus Duct Trunking System Market Revenue Share, By Application, 2019 & 2025F |
| 6.4.6.2. CHINA Bus Duct Trunking System Market Revenues, By Commercial Application, 2015-2025F |
| 6.4.6.3. CHINA Bus Duct Trunking System Market Revenues, By Industrial Application, 2015-2025F |
| 6.4.6.4. CHINA Bus Duct Trunking System Market Revenues, By Residential Application, 2015-2025F |
| 6.4.6.5. CHINA Bus Duct Trunking System Market Revenues, By Transportation Application, 2015-2025F |
| 6.4.6.6. CHINA Bus Duct Trunking System Market Revenues, By Other Application, 2015-2025F |
| 6.4.6.1. Asia Pacific Bus Duct Trunking System Market Revenue Share, By Application, 2019 & 2025F |
| 6.4.6.2. Asia Pacific Bus Duct Trunking System Market Revenues, By Commercial Application, |
| 2015-2025F |
| 6.4.6.3. Asia Pacific Bus Duct Trunking System Market Revenues, By Industrial Application, 2015-2025F |
| 6.4.6.4. Asia Pacific Bus Duct Trunking System Market Revenues, By Residential Application, 2015-2025F |
| 6.4.6.5. Asia Pacific Bus Duct Trunking System Market Revenues, By Transportation Application, |
| 2015-2025F |
| 6.4.6.6. Asia Pacific Bus Duct Trunking System Market Revenues, By Other Application, 2015-2025F |
| 6.4.7. Asia Pacific Bus Duct Trunking System Market - Key Performance Indicators |
| 7. Asia Pacific Bus Duct Trunking System Market Competitive Landscape |
| 7.1 Asia Pacific Bus Duct Trunking System Market Competitive Benchmarking, By Operating Parameters |
| 7.2 Asia Pacific Bus Duct Trunking System Market Revenue Share/Ranking, By Country |
| 7.2.1. India Bus Duct Trunking System Market Revenue Share/Ranking, By Company, 2019 |
| 7.2.2. China Bus Duct Trunking System Market Revenue Share/Ranking, By Company, 2019 |
| 8. Company Profiles |
| 8.1 Schneider Electric SE |
| 8.2 Siemens AG |
| 8.3 ABB Ltd. |
| 8.4 General Electric Company |
| 8.5 Larsen & Toubro Limited |
| 8.6 Eaton Corporation Plc |
| 8.7 Legrand |
| 8.8 C&S Electric Limited |
| 8.9 Godrej & Boyce Manufacturing Company Limited |
| 8.10 Mersen |
| 13. Key Strategic Recommendations |
| 14. Disclaimer |
| List of Figures |
| Figure 1. Asia Pacific Bus Duct Trunking System Market Revenues, 2015-2025F ($ Million) |
| Figure 2. Asia Pacific Bus Duct Trunking System Market - Industry Life Cycle, 2019 |
| Figure 3. Asia Pacific Bus Duct Trunking System Market Revenue Share, By Insulation, 2019 & 2025F |
| Figure 4. Asia Pacific Bus Duct Trunking System Market Revenue Share, By Power Range, 2019 & 2025F |
| Figure 5. Asia Pacific Bus Duct Trunking System Market Revenue Share, By Conductor, 2019 & 2025F |
| Figure 6. Asia Pacific Bus Duct Trunking System Market Revenue Share, By Application, 2019 & 2025F |
| Figure 7. Asia Pacific Bus Duct Trunking System Market Revenue Share, By Region, 2019 & 2025F |
| Figure 8. Asia Pacific Upcoming Mall Supply, 2017-2020E (Million sq.ft.) |
| Figure 9. Asia Pacific Healthcare Spending as a Percentage of GDP, 2017 - 2025F |
| Figure 10. Asia Pacific Projected Infrastructure Investment in Railways, 2013 - 2032 (INR Thousand Crore) |
| Figure 7. Asia Pacific Planned Metro Network Expansion - New Lines (km) |
| Figure 8. Asia Pacific Infrastructure Investment Forecast, 2019-2039 (INR Lakh Crore) |
| Figure 13. Asia Pacific Sector-wise Infrastructure Investment Forecast, 2019-2039 (INR Lakh Crore) |
| Figure 14. International Copper Prices, 2019 ($/metric ton) |
| Figure 15. Asia Pacific Bus Duct Trunking System Market Revenues, By Commercial Application, |
| 2015-2025F ($ Million) |
| Figure 16. Asia Pacific Bus Duct Trunking System Market Revenues, By Industrial Application, |
| 2015-2025F ($ Million) |
| Figure 17. Asia Pacific Bus Duct Trunking System Market Revenues, By Residential Application, |
| 2015-2025F ($ Million) |
| Figure 18. Asia Pacific Bus Duct Trunking System Market Revenues, By Transportation Application, |
| 2015-2025F ($ Million) |
| Figure 19. Asia Pacific Bus Duct Trunking System Market Revenues, By Other Application, |
| 2015-2025F ($ Million) |
| Figure 20. Asia Pacific Bus Duct Trunking System Market Revenues, By Northern Region, |
| 2015-2025F ($ Million) |
| Figure 21. Asia Pacific Bus Duct Trunking System Market Revenues, By Southern Region, |
| 2015-2025F ($ Million) |
| Figure 22. Asia Pacific Bus Duct Trunking System Market Revenues, By Eastern Region, |
| 2015-2025F ($ Million) |
| Figure 23. Asia Pacific Bus Duct Trunking System Market Revenues, By Western Region, |
| 2015-2025F ($ Million) |
| Figure 24. Asia Pacific Actual Government Spending Vs Actual Government Revenues, |
| 2015-2024F (INR Trillion) |
| Figure 25. Asia Pacific New Office Supply in Major Asia Pacific Cities, 2019–2020E |
| (Million sq. ft.) |
| Figure 26. Asia Pacific Organized Retail Space Completions, 2017-2020E (Million Sq. Ft.) |
| Figure 27. Asia Pacific Foreign Tourist Arrivals, 2016 – 2018 (Lakhs) |
| Figure 28. Asia Pacific Travel & Tourism Total Contribution to Asia Pacific’s GDP, |
| 2013-2029F (INR Billion) |
| Figure 29. Growth of Hotel Rooms Supply in Asia Pacific, FY2018 & FY2023F (No. of Rooms) |
| Figure 30. Asia Pacific Branded Hotel Rooms Supply Across Major Cities in Asia Pacific, |
| FY2018 & FY2023F (No. of Rooms) |
| Figure 31. Asia Pacific Technology Wise Contribution Towards Renewable Energy Targets, |
| Asia Pacific(2022) |
| Figure 32. Asia Pacific Renewable Energy Capacity Target, 2019-2022F (MW) |
| Figure 33. Asia Pacific Total Renewable Energy Capacity Addition Share in 2019, MW |
| Figure 34. Asia Pacific Solar Tenders and Auctions in 2019 (MW) |
| Figure 35. Asia Pacific Top Ten States in Solar Installation Capacity (MW), Till March 2019 |
| Figure 36. Asia Pacific Rooftop PV Installation Target till March 2022 (MW) |
| Figure 37. Asia Pacific Bus Duct Trunking System Market Opportunity Assessment, By Conductor (2025F) |
| Figure 38. Asia Pacific Bus Duct Trunking System Market Opportunity Assessment, By Application (2025F) |
| Figure 39. Asia Pacific Bus Duct Trunking System Market Opportunity Assessment, By Region (2025F) |
| Figure 40. Asia Pacific Bus Duct Trunking System Market Revenue Share, By Company, 2019 |
| List of Tables |
| Table 1. Asia Pacific Bus Duct Trunking System Market Revenues, By Insulation, 2015-2025F ($ Million) |
| Table 2. Asia Pacific Bus Duct Trunking System Market Revenues, By Power Rating, 2015-2025F ($ Million) |
| Table 3. Asia Pacific Bus Duct Trunking System Market Revenues, By Conductor, 2015-2025F ($ Million) |
| Table 4. Asia Pacific Proposed Branded New Hotel Room Supply, FY2021 (Number of Rooms) |
| Table 5. Asia Pacific Tourism Sector Key Indicators, 2028F |
| Table 6. Asia Pacific Upcoming Airport Projects |
| Table 7. Asia Pacific Solar Capacity Target (GW), By Segments, 2018-2022F |
| Table 8. Asia Pacific Proposed Plans Under Green Corridor Phase II, By States |
| Table 9. Upcoming Retail Sector Projects in Asia Pacific |
| Table 10. Upcoming Metro Projects in Asia Pacific |
Export potential assessment - trade Analytics for 2030
Export potential enables firms to identify high-growth global markets with greater confidence by combining advanced trade intelligence with a structured quantitative methodology. The framework analyzes emerging demand trends and country-level import patterns while integrating macroeconomic and trade datasets such as GDP and population forecasts, bilateral import–export flows, tariff structures, elasticity differentials between developed and developing economies, geographic distance, and import demand projections. Using weighted trade values from 2020–2024 as the base period to project country-to-country export potential for 2030, these inputs are operationalized through calculated drivers such as gravity model parameters, tariff impact factors, and projected GDP per-capita growth. Through an analysis of hidden potentials, demand hotspots, and market conditions that are most favorable to success, this method enables firms to focus on target countries, maximize returns, and global expansion with data, backed by accuracy.
By factoring in the projected importer demand gap that is currently unmet and could be potential opportunity, it identifies the potential for the Exporter (Country) among 190 countries, against the general trade analysis, which identifies the biggest importer or exporter.
To discover high-growth global markets and optimize your business strategy:
Click Here
Pricing
- Single User License$ 4,560
- Department License$ 5,055
- Site License$ 5,595
- Global License$ 6,000

Search
Thought Leadership and Analyst Meet


Our Clients
Latest Reports
- United Kingdom (UK) Long-term Care Insurance Market (2026-2032) | Growth, Share, Consumer Insights, Drivers, Opportunities, Competition, Pricing Analysis, Segments, Restraints, Companies, Competitive, Value, Outlook, Size, Demand, Analysis, Challenges, Strategic Insights, Investment Trends, Revenue, Trends, Supply, Forecast
- United Kingdom (UK) Long Term Care Market (2026-2032) | Companies, Outlook, Analysis, Trends, Value, Revenue, Segmentation, Share, Forecast, Competitive Landscape, Growth, Size & Forecast
- Iraq Insulation and Waterproofing Market (2026-2032) | Outlook, Drivers, Growth, Size, Share, Industry, Revenue, Trends, Demand, Competitive, Strategic Insights, Opportunities, Segments, Companies, Challenges, Strategy, Consumer Insights, Analysis, Investment Trends, Value, Segmentation, Forecast, Restraints
- India Switchgear Market Outlook (2026 - 2032) | Size, Share, Trends, Growth, Revenue, Forecast, Analysis, Value, Outlook
- Pakistan Contraceptive Implants Market (2025-2031) | Demand, Growth, Size, Share, Industry, Pricing Analysis, Competitive, Strategic Insights, Strategy, Consumer Insights, Analysis, Investment Trends, Opportunities, Revenue, Segments, Value, Segmentation, Supply, Forecast, Restraints, Outlook, Competition, Drivers, Trends, Companies, Challenges
- Sri Lanka Packaging Market (2026-2032) | Outlook, Competition, Drivers, Trends, Demand, Pricing Analysis, Competitive, Strategic Insights, Companies, Challenges, Strategy, Consumer Insights, Analysis, Investment Trends, Opportunities, Growth, Size, Share, Industry, Revenue, Segments, Value, Segmentation, Supply, Forecast, Restraints
- India Kids Watches Market (2026-2032) | Strategy, Consumer Insights, Analysis, Investment Trends, Opportunities, Growth, Size, Share, Industry, Revenue, Segments, Value, Segmentation, Supply, Forecast, Restraints, Outlook, Competition, Drivers, Trends, Demand, Pricing Analysis, Competitive, Strategic Insights, Companies, Challenges
- Saudi Arabia Core Assurance Service Market (2025-2031) | Strategy, Consumer Insights, Analysis, Investment Trends, Opportunities, Growth, Size, Share, Industry, Revenue, Segments, Value, Segmentation, Supply, Forecast, Restraints, Outlook, Competition, Drivers, Trends, Demand, Pricing Analysis, Competitive, Strategic Insights, Companies, Challenges
- Romania Uninterruptible Power Supply (UPS) Market (2026-2032) | Industry, Analysis, Revenue, Size, Forecast, Outlook, Value, Trends, Share, Growth & Companies
- Saudi Arabia Car Window Tinting Film, Paint Protection Film (PPF), and Ceramic Coating Market (2025-2031) | Strategy, Consumer Insights, Analysis, Investment Trends, Opportunities, Growth, Size, Share, Industry, Revenue, Segments, Value, Segmentation, Supply, Forecast, Restraints, Outlook, Competition, Drivers, Trends, Demand, Pricing Analysis, Competitive, Strategic Insights, Companies, Challenges
Industry Events and Analyst Meet

India EV Show 2026

EV tech India Expo 2026

Auto Tech Asia 2026

Battery Tech India 2026

Smart Production Solutions Guangzhou 2026
Whitepaper
- Middle East & Africa Commercial Security Market Click here to view more.
- Middle East & Africa Fire Safety Systems & Equipment Market Click here to view more.
- GCC Drone Market Click here to view more.
- Middle East Lighting Fixture Market Click here to view more.
- GCC Physical & Perimeter Security Market Click here to view more.
6WResearch In News
- Doha a strategic location for EV manufacturing hub: IPA Qatar
- Demand for luxury TVs surging in the GCC, says Samsung
- Empowering Growth: The Thriving Journey of Bangladesh’s Cable Industry
- Demand for luxury TVs surging in the GCC, says Samsung
- Video call with a traditional healer? Once unthinkable, it’s now common in South Africa
- Intelligent Buildings To Smooth GCC’s Path To Net Zero