United States Bus Duct Trunking System Market (2025-2031) | Analysis, Share, Forecast, Companies, Revenue, Trends, Value, Size, Outlook, Industry & Growth
Market Forecast By Insulation (Air And Sandwich), By Power Range (Lighting Power Range, Low Power Range, Medium Power Range And High Power Range), By Conductor (Copper And Aluminium), By Applications (Commercial, Industrial, Residential, Transportation And Others Including Power Utilities, Argo-Industries, And Civil Buildings) And Competitive Landscape
| Product Code: ETC150360 | Publication Date: Jan 2025 | Updated Date: Aug 2025 | Product Type: Report | |
| Publisher: 6Wresearch | Author: Ravi Bhandari | No. of Pages: 70 | No. of Figures: 35 | No. of Tables: 5 |
United States Bus Duct Trunking System Market Highlights
| Report Name | United States Bus Duct Trunking System Market |
| CAGR | 7.5% |
| Growing Sector | Data center |
| Forecast Period | 2025-2031 |
Topics Covered in United States Bus Duct Trunking System Market Report
The United States Bus Duct Trunking System Market report thoroughly covers the market by insulation, by power range, by conductor, and by application. The market report provides an unbiased and detailed analysis of the ongoing market trends, opportunities/high growth areas, and market drivers which would help the stakeholders to devise and align their market strategies according to the current and future market dynamics.
United States Bus Duct Trunking System Market Synopsis
The United States Bus Duct Trunking System Market is experiencing significant growth driven by rapid industrialization and increasing demand for efficient power distribution solutions. These systems offer a reliable and flexible method for distributing electrical power in commercial and industrial environments. Factors such as the rise in construction activities, technological advancements, and the need for energy-efficient infrastructure contribute to the market's expansion. Key players in the industry focus on innovation and strategic partnerships to expand their market presence and cater to diverse customer demands. With the ongoing trend of smart cities and sustainable development, the bus duct trunking system market in the United States is poised for continued growth.
According to 6Wresearch, United States Bus Duct Trunking System Market size is projected to witness a CAGR of 7.5% during the forecast period of 2025-2031. The United States bus duct trunking system market is primarily driven by the increasing demand for efficient and reliable power distribution systems in industrial and commercial sectors. The rising focus on energy efficiency and the need for systems that minimize power losses have made bus duct trunking systems a popular choice over traditional cabling methods. Additionally, the rapid industrialization and urbanization across the country have spurred the demand for advanced electrical infrastructure, further propelling market growth.
the high initial cost associated with the installation of bus duct systems, which can deter small and medium-sized enterprises from adopting these solutions. Additionally, the market must navigate regulatory and compliance issues related to safety standards, which can vary significantly across different states. This requires manufacturers to consistently update and align their products with evolving legislation, adding to operational complexities.
United States Bus Duct Trunking System Market: Leading Players
The United States bus duct trunking system market is characterized by several key players who contribute significantly to its growth and development. Industry leaders such as Schneider Electric, Siemens AG, and Eaton Corporation continue to dominate the market with their innovative solutions and extensive product portfolios. Schneider Electric is known for its sustainable and energy-efficient solutions, catering to a wide range of industrial needs. Siemens AG leverages its technological expertise to offer robust and flexible bus duct systems that are adaptable to various applications. Eaton Corporation provides reliable and cost-effective solutions, focusing on improving power distribution efficiency.
United States Bus Duct Trunking System Market: Government Initiatives
The United States Bus Duct Trunking System Market has been significantly influenced by various government initiatives aimed at promoting energy efficiency and modernization of infrastructure. Federal programs and policies have been established to support the development of smart grids and the enhancement of electrical distribution networks, which include the implementation of advanced bus duct systems. These initiatives are designed to stimulate economic growth, increase energy security, and reduce carbon emissions by encouraging the adoption of efficient and reliable power distribution technologies. By providing funding, tax incentives, and regulatory support, the government is playing a pivotal role in driving innovation and investment in the bus duct trunking system market, thereby facilitating a more sustainable energy future for the nation.
Future Insights of United States Bus Duct Trunking System Market
The future of the United States bus duct trunking system market is poised for significant growth, driven by increasing urbanization and the evolution of smart infrastructure. As cities expand and modernize, there is a growing need for efficient and reliable electrical distribution systems. Bus duct trunking systems offer a compact, flexible, and cost-effective solution, making them an attractive choice for new constructions and renovations. Technological advancements and the integration of IoT capabilities are expected to enhance the functionality and monitoring of these systems, providing real-time data that can lead to improved energy efficiency and reduced operational costs. Moreover, as sustainability becomes a focal point for industries and governments, the demand for eco-friendly and energy-efficient electrical solutions is projected to rise, further propelling the market forward.
United States Bus Duct Trunking System Market trends
- Growing Demand for Energy Efficiency – As industries and commercial facilities strive to reduce energy consumption, there is an increasing demand for energy-efficient power distribution systems. Bus duct trunking systems, known for their efficiency and reduced energy loss, are becoming a favorable choice.
- Rapid Urbanization and Industrialization – The expansion of urban areas and industrial sectors requires robust infrastructure to support energy distribution. The bus duct trunking system market is capitalizing on this trend as it provides a reliable solution for heavy power loads.
- Technological Advancements - Innovations in materials and design are improving the efficiency and safety of bus duct trunking systems. Technologies such as smart sensors and real-time monitoring capabilities are being integrated, enhancing system management and performance.
Investment opportunities in United States Bus Duct Trunking System Market
- Infrastructure Development – The US government's investment in infrastructure projects, including commercial and residential buildings, bridges, and transport networks, necessitates the implementation of robust power distribution systems, thereby driving the growth of the bus duct trunking market.
- Collaborations and Partnerships – Collaborations between key players in the bus duct trunking market, as well as partnerships with government agencies and utility providers, can open up new opportunities for investment in this sector.
- Emerging Markets Driving Growth - The Asia-Pacific region, particularly countries like China and India, are investing heavily in their power infrastructure to meet growing energy demands. This creates a significant market for bus duct trunking manufacturers and suppliers.
Air to dominate the market - By Insulation
According to Ravi Bhandari, Research Head, 6Wresearch, the air type bus duct trunking system is a significant component in the United States market, distinguished by its superior thermal efficiency and adaptability. This system uses air as a cooling medium, which contributes to efficient heat dissipation and ensures reliable performance even under high load conditions. Its design accommodates easy installation and maintenance, making it a preferred choice for industrial and commercial applications. The growing emphasis on energy efficiency and sustainability is also driving the adoption of air type systems, as they provide an effective solution for modern electrical infrastructure.
Medium power range to dominate the market – By power range
The medium power range in the United States bus duct trunking system market occupies a vital segment, bridging the gap between lower-capacity and high-power installations. These systems are tailored to meet the needs of facilities with moderate power requirements, such as mid-sized industrial plants, commercial complexes, and educational institutions. The demand for medium power systems is driven by their ability to provide reliable and efficient power distribution while maintaining cost-effectiveness. They offer flexibility in terms of installation and configuration, often featuring modular designs that accommodate future expansions or modifications.
Copper to dominate the market – By conductor
Copper plays a pivotal role in the United States bus duct trunking system market, renowned for its excellent conductivity and thermal management properties. As a preferred material in bus duct systems, copper enhances the system's overall performance by ensuring minimal energy loss and efficient power distribution. Its resilience and long-lasting nature make copper an ideal choice for both medium and high-power applications, particularly in sectors that demand consistent and robust electrical delivery. The procurement of high-quality copper, combined with advancements in manufacturing technology, contributes to the durability and reliability of bus duct systems.
Industrial to dominate the market – By applications
The industrial sector in the United States significantly contributes to the demand for bus duct trunking systems, driven by the need for reliable and efficient power distribution within factories and manufacturing facilities. These systems are particularly valued in industrial settings for their capacity to handle high power loads and their ability to streamline electrical infrastructure. As industries increasingly adopt automation and advanced manufacturing techniques, the demand for robust and scalable bus duct systems has intensified. These systems provide the flexibility needed to support complex industrial processes, maximize operational efficiency, and minimize downtime.
Key Attractiveness of the Report
- 10 Years Market Numbers.
- Historical Data Starting from 2021 to 2024.
- Base Year: 2024
- Forecast Data until 2031.
- Key Performance Indicators Impacting the Market.
- Major Upcoming Developments and Projects.
Key Highlights of the Report:
- United States Bus Duct Trunking System Market Outlook
- Market Size of United States Bus Duct Trunking System Market, 2024
- Forecast of United States Bus Duct Trunking System Market, 2031
- Historical Data and Forecast of United States Bus Duct Trunking System Revenues & Volume for the Period 2021 - 2031
- United States Bus Duct Trunking System Market Trend Evolution
- United States Bus Duct Trunking System Market Drivers and Challenges
- United States Bus Duct Trunking System Price Trends
- United States Bus Duct Trunking System Porter's Five Forces
- United States Bus Duct Trunking System Industry Life Cycle
- Historical Data and Forecast of United States Bus Duct Trunking System Market Revenues & Volume By product type for the Period 2021 - 2031
- Historical Data and Forecast of United States Bus Duct Trunking System Market Revenues & Volume by Construction aggregates, for the Period 2021 - 2031
- Historical Data and Forecast of United States Bus Duct Trunking System Market Revenues & Volume by insulation, for the Period 2021 - 2031
- Historical Data and Forecast of United States Bus Duct Trunking System Market Revenues & Volume by Air for the Period 2021 - 2031
- Historical Data and Forecast of United States Bus Duct Trunking System Market Revenues & Volume by Sandwich for the Period 2021 - 2031
- Historical Data and Forecast of United States Bus Duct Trunking System Market Revenues & Volume By power range for the Period 2021 - 2031
- Historical Data and Forecast of United States Bus Duct Trunking System Market Revenues & Volume by Lightning power range, for the Period 2021 - 2031
- Historical Data and Forecast of United States Bus Duct Trunking System Market Revenues & Volume by Low power range for the Period 2021 - 2031
- Historical Data and Forecast of United States Bus Duct Trunking System Market Revenues & Volume by Medium Power range for the Period 2021 – 2031
- Historical Data and Forecast of United States Bus Duct Trunking System Market Revenues & Volume by High Power range for the Period 2021 – 2031
- Historical Data and Forecast of United States Bus Duct Trunking System Market Revenues & Volume by conductor for the Period 2021 – 2031
- Historical Data and Forecast of United States Bus Duct Trunking System Market Revenues & Volume by Copper for the Period 2021 – 2031
- Historical Data and Forecast of United States Bus Duct Trunking System Market Revenues & Volume by Aluminium for the Period 2021 – 2031
- Historical Data and Forecast of United States Bus Duct Trunking System Market Revenues & Volume by application for the Period 2021 – 2031
- Historical Data and Forecast of United States Bus Duct Trunking System Market Revenues & Volume by Commercial for the Period 2021 – 2031
- Historical Data and Forecast of United States Bus Duct Trunking System Market Revenues & Volume by Industrial for the Period 2021 – 2031
- Historical Data and Forecast of United States Bus Duct Trunking System Market Revenues & Volume by Residential for the Period 2021 – 2031
- Historical Data and Forecast of United States Bus Duct Trunking System Market Revenues & Volume by Transportation for the Period 2021 – 2031
- Historical Data and Forecast of United States Bus Duct Trunking System Market Revenues & Volume by Others for the Period 2021 – 2031
- United States Bus Duct Trunking System Import Export Trade Statistics
- Market Opportunity Assessment By application
- Market Opportunity Assessment by Product Type
- United States Bus Duct Trunking System Top Companies Market Share
- United States Bus Duct Trunking System Competitive Benchmarking by Technical and Operational Parameters
- United States Bus Duct Trunking System Company Profiles
- United States Bus Duct Trunking System Key Strategic Recommendations
Market Covered
The report offers a comprehensive study of the subsequent market segments:
By Insulation
- Air
- Sandwich
By Power Range
- Lighting Power Range
- Low Power Range
- Medium Power Range
- High Power Range
By Conductor
- Copper
- Aluminium
By Applications
- Commercial
- Industrial
- Residential
- Transportation
- Others (Power Utilities, Argo-industries, and Civil Buildings)
United States Bus Duct Trunking System Market (2025-2031): FAQs
Several factors are influencing the market's growth, including the rising demand for reliable and efficient power distribution systems.
Yes, challenges such as high initial installation costs and the availability of alternative power distribution solutions may hinder the market size growth to some extent.
The market is witnessing a growing demand for smart bus duct trunking systems that offer remote monitoring and control capabilities.
Some of the key players in the United States bus duct trunking system market include Schneider Electric, Siemens AG, ABB Ltd., Eaton Corporation, and General Electric Company.
| 1. Executive Summary |
| 2. Introduction |
| 2.1. Report Description |
| 2.2. Key Highlights of the Report |
| 2.3. Market Scope & Segmentation |
| 2.4. Research Methodology |
| 2.5. Assumptions |
| 3. United States Bus Duct Trunking System Market Overview |
| 3.1. United States Bus Duct Trunking System Market Revenues, 2021-2031F |
| 3.2. United States Bus Duct Trunking System Market - Industry Life Cycle, 2021 |
| 3.3. United States Bus Duct Trunking System Market - Porter’s Five Forces |
| 3.4. United States Bus Duct Trunking System Market Value Chain & Ecosystem |
| 3.5. United States Bus Duct Trunking System Market Revenue Share, By Insulation, 2021 & 2031F |
| 3.6. United States Bus Duct Trunking System Market Revenue Share, By Power Rating, 2021 & 2031F |
| 3.7. United States Bus Duct Trunking System Market Revenue Share, By Conductor, 2021 & 2031F |
| 3.8. United States Bus Duct Trunking System Market Revenue Share, By Application, 2021 & 2031F |
| 3.9. United States Bus Duct Trunking System Market Revenue Share, By Region, 2021 & 2031F |
| 4. United States Bus Duct Trunking System Market Dynamics |
| 4.1. Impact Analysis |
| 4.2. Market Drivers |
| 4.2.1 Increasing demand for energy-efficient power distribution systems |
| 4.2.2 Growing focus on upgrading and modernizing infrastructure |
| 4.2.3 Rise in industrial and commercial construction projects |
| 4.3. Market Restraints |
| 4.3.1 High initial investment costs |
| 4.3.2 Lack of awareness about the benefits of bus duct trunking systems |
| 4.3.3 Regulatory challenges in the energy sector |
| 5. United States Bus Duct Trunking System Market Trends |
| 6. United States Bus Duct Trunking System Market Overview, By Insulation |
| 6.1. United States Bus Duct Trunking System Market Revenues, By Air Insulation, 2021-2031F |
| 6.2. United States Bus Duct Trunking System Market Revenues, By Sandwich insulation, 2021-2031F |
| 7. United States Bus Duct Trunking System Market Overview, By Power Rating |
| 7.1. United States Bus Duct Trunking System Market Revenues, By Lighting Power Range, 2021-2031F |
| 7.2. United States Bus Duct Trunking System Market Revenues, By Low Power Range, 2021-2031F |
| 7.3. United States Bus Duct Trunking System Market Revenues, By Medium Power Range, 2021-2031F |
| 7.4. United States Bus Duct Trunking System Market Revenues, By High Power Range, 2021-2031F |
| 8. United States Bus Duct Trunking System Market Overview, By Conductor |
| 8.1. United States Bus Duct Trunking System Market Revenues, By Copper, 2021-2031F |
| 8.2. United States Bus Duct Trunking System Market Revenues, By Aluminium, 2021-2031F |
| 9. United States Bus Duct Trunking System Market Overview, By Application |
| 9.1. United States Bus Duct Trunking System Market Revenues, By Commercial Application, 2021-2031F |
| 9.2. United States Bus Duct Trunking System Market Revenues, By Industrial Application, 2021-2031F |
| 9.3. United States Bus Duct Trunking System Market Revenues, By Residential Application, 2021-2031F |
| 9.4. United States Bus Duct Trunking System Market Revenues, By Transportation Application, 2021-2031F |
| 9.5. United States Bus Duct Trunking System Market Revenues, By Other Applications, 2021-2031F |
| 10. United States Bus Duct Trunking System Market Overview, By Region |
| 10.1. United States Bus Duct Trunking System Market Revenues, By Northern Region, 2021-2031F |
| 10.2. United States Bus Duct Trunking System Market Revenues, By Southern Region, 2021-2031F |
| 10.3. United States Bus Duct Trunking System Market Revenues, By Eastern Region, 2021-2031F |
| 10.4. United States Bus Duct Trunking System Market Revenues, By Western Region, 2021-2031F |
| 11. United States Bus Duct Trunking System Market - Government Standards, Certifications, and Regulations |
| 12. United States Bus Duct Trunking System Market - Identification of Test Facilities / Certifying Bodies in United States |
| 13. United States Bus Duct Trunking System Market - Manufacturing Analysis |
| 14. United States Bus Duct Trunking System Market - Key Performance Indicators |
| 14.1 Energy efficiency improvements in buildings using bus duct trunking systems |
| 14.2 Number of infrastructure upgrade projects utilizing bus duct trunking systems |
| 14.3 Adoption rate of bus duct trunking systems in key industries |
| 14.4 Number of new entrants offering bus duct trunking systems in the market |
| 14.5 Rate of technological advancements in bus duct trunking systems |
| 15. United States Bus Duct Trunking System Market - Opportunity Assessment |
| 15.1. United States Bus Duct Trunking System Market Opportunity Assessment, By Conductor, 2031F |
| 15.2. United States Bus Duct Trunking System Market Opportunity Assessment, By Application, 2031F |
| 15.3. United States Bus Duct Trunking System Market Opportunity Assessment, By Region, 2031F |
| 16. United States Bus Duct Trunking System Market Competitive Landscape |
| 16.1. United States Bus Duct Trunking System Market Revenue Share, By Company, 2021 |
| 16.2. United States Bus Duct Trunking System Market Competitive Benchmarking, By Operating Parameters |
| 17. Company Profiles |
| 18. Key Strategic Recommendations |
| 19. Disclaimer |
| List of Figures |
| Figure 1. United States Bus Duct Trunking System Market Revenues, 2021-2031F ($ Million) |
| Figure 2. United States Bus Duct Trunking System Market - Industry Life Cycle, 2021 |
| Figure 3. United States Bus Duct Trunking System Market Revenue Share, By Insulation, 2021 & 2031F |
| Figure 4. United States Bus Duct Trunking System Market Revenue Share, By Power Range, 2021 & 2031F |
| Figure 5. United States Bus Duct Trunking System Market Revenue Share, By Conductor, 2021 & 2031F |
| Figure 6. United States Bus Duct Trunking System Market Revenue Share, By Application, 2021 & 2031F |
| Figure 7. United States Bus Duct Trunking System Market Revenue Share, By Region, 2021 & 2031F |
| Figure 8. United States Upcoming Mall Supply, 2021-2031E (Million sq.ft.) |
| Figure 9. United States Healthcare Spending as a Percentage of GDP, 2021 - 2031F |
| Figure 10. United States Projected Infrastructure Investment in Railways, 2021 - 2031 (INR Thousand Crore) |
| Figure 11. United States Planned Metro Network Expansion - New Lines (km) |
| Figure 12. United States Infrastructure Investment Forecast, 2021 -2031 (INR Lakh Crore) |
| Figure 13. United States Sector-wise Infrastructure Investment Forecast, 2021 -2031 (INR Lakh Crore) |
| Figure 14. International Copper Prices, 2021 ($/metric ton) |
| Figure 15. United States Bus Duct Trunking System Market Revenues, By Commercial Application, 2021-2031F ($ Million) |
| Figure 16. United States Bus Duct Trunking System Market Revenues, By Industrial Application, 2021-2031F ($ Million) |
| Figure 17. United States Bus Duct Trunking System Market Revenues, By Residential Application, 2021-2031F ($ Million) |
| Figure 18. United States Bus Duct Trunking System Market Revenues, By Transportation Application, 2021-2031F ($ Million) |
| Figure 19. United States Bus Duct Trunking System Market Revenues, By Other Application, 2021-2031F ($ Million) |
| Figure 20. United States Bus Duct Trunking System Market Revenues, By Northern Region, 2021-2031F ($ Million) |
| Figure 21. United States Bus Duct Trunking System Market Revenues, By Southern Region, 2021-2031F ($ Million) |
| Figure 22. United States Bus Duct Trunking System Market Revenues, By Eastern Region, 2021-2031F ($ Million) |
| Figure 23. United States Bus Duct Trunking System Market Revenues, By Western Region, 2021-2031F ($ Million) |
| Figure 24. United States Actual Government Spending Vs Actual Government Revenues, 2021-2024F (INR Trillion) |
| Figure 25. United States New Office Supply in Major United Statesn Cities, 2021 –2031E (Million sq. ft.) |
| Figure 26. United States Organized Retail Space Completions, 2021-2031E (Million Sq. Ft.) |
| Figure 27. United States Foreign Tourist Arrivals, 2021 – 2031 (Lakhs) |
| Figure 28. United StatesTravel & Tourism Total Contribution to United States’s GDP, 2021-2031F (INR Billion) |
| Figure 29. Growth of Hotel Rooms Supply in United States, FY2021 & FY2031F (No. of Rooms) |
| Figure 30. United States Branded Hotel Rooms Supply Across Major Cities in United States, FY2021 & FY2031F (No. of Rooms) |
| Figure 31. United States Technology Wise Contribution Towards Renewable Energy Targets, United States(2021) |
| Figure 32. United States Renewable Energy Capacity Target, 2021 -2031F (MW) |
| Figure 33. United States Total Renewable Energy Capacity Addition Share in 2021 , MW |
| Figure 34. United States Solar Tenders and Auctions in 2021 (MW) |
| Figure 35. United States Top Ten States in Solar Installation Capacity (MW), Till March 2021 |
| Figure 36. United States Rooftop PV Installation Target till March 2021 (MW) |
| Figure 37. United States Bus Duct Trunking System Market Opportunity Assessment, By Conductor (2031F) |
| Figure 38. United States Bus Duct Trunking System Market Opportunity Assessment, By Application (2031F) |
| Figure 39. United States Bus Duct Trunking System Market Opportunity Assessment, By Region (2031F) |
| Figure 40. The United States Bus Duct Trunking System Market Revenue Share, By Company, 2021 |
| List of Tables |
| Table 1. United States Bus Duct Trunking System Market Revenues, By Insulation, 2021-2031F ($ Million) |
| Table 2. United States Bus Duct Trunking System Market Revenues, By Power Rating, 2021-2031F ($ Million) |
| Table 3. United States Bus Duct Trunking System Market Revenues, By Conductor, 2021-2031F ($ Million) |
| Table 4. United States Proposed Branded New Hotel Room Supply, FY2021 (Number of Rooms) |
| Table 5. United States Tourism Sector Key Indicators, 2031F |
| Table 6. United States Upcoming Airport Projects |
| Table 7. United States Solar Capacity Target (GW), By Segments, 2021-2031F |
| Table 8. United States Proposed Plans Under Green Corridor Phase II, By States |
| Table 9. Upcoming Retail Sector Projects in the United States |
| Table 10. Upcoming Metro Projects in the United States |
Market Forecast By Insulation (Air And Sandwich), By Power Range (Lighting Power Range, Low Power Range, Medium Power Range And High Power Range), By Conductor (Copper And Aluminium), By Applications (Commercial, Industrial, Residential, Transportation And Others Including Power Utilities, Argo-Industries, And Civil Buildings) And Competitive Landscape
| Product Code: ETC150360 | Publication Date: Jan 2022 | Product Type: Market Research Report | |
| Publisher: 6Wresearch | No. of Pages: 80 | No. of Figures: 14 | No. of Tables: 4 |
United States Bus Duct Trunking System Market report comprehensively covers the market by insulation, power rating, conductor, and applications. The United States bus duct trunking system market outlook report provides an unbiased and detailed analysis of the United States bus duct trunking system market trends, opportunities, high growth areas, and market drivers which would help the stakeholders to devise and align their market strategies according to the current and future market dynamics.
United States Bus Duct Trunking System Market Synopsis
The construction industry in the US is witnessing a deceleration and the trend is likely to continue in the coming years as well on account of US- the China trade war and global economic slowdown. Further, a similar trend is expected to occur in the bus duct trunking market of the country, which is expected to grow at a modest and stable rate over the forecast period. Further, rising interest rates and material costs are also acting as a barrier to infrastructural development in the country. However, Covid-19 pandemic had slowed down the market in terms of supply of the product during 2020. While on the other hand, the demand-side also fell victim to the slowdown due to the market being closed during the lockdown period. Currently, the market has recovered gradually and is likely to witness growth over the coming years.
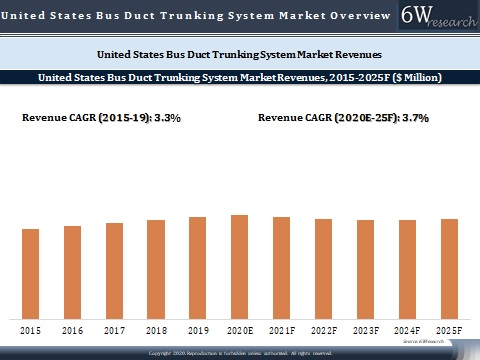
According to 6Wresearch, United States Bus Duct Trunking System Market size is expected to grow at a CAGR of 3.7% during 2020-2025. The construction industry is predicted to rebound in 2020, as a result of the expansion of the overall economy and increasing business investment. Additionally, the rising number of data centers and private investment such as Google’s data center investment of $13 billion in the country would open up new avenues in the colocation data center industry for bus duct trunking systems in the country.
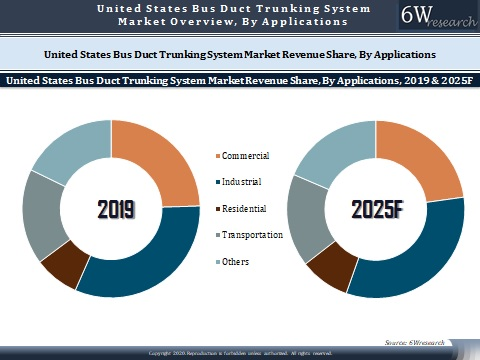
Market Analysis By Applications
In terms of applications, industrial application dominates the overall United States bus duct trunking system market. Further, the commercial application also held the majority of the market revenue share in 2019. Together the industrial and commercial applications held a major chunk of revenue share in 2019. Additionally, residential and transportation are the other major applications.
Key Attractiveness of the Report
- COVID-19 Impact on the Market.
- 10 Years Market Numbers.
- Historical Data Starting from 2015 to 2019.
- Base Year: 2019
- Forecast Data until 2025.
- Key Performance Indicators Impacting the Market.
- Major Upcoming Developments and Projects.
Key Highlights of the Report:
- United States Bus Duct Market Overview
- United States Bus Duct Market Outlook
- United States Bus Duct Market Forecast
- Historical Data of United States Bus Duct Trunking System Market Revenues for the Period 2015-2019
- Market Size & Forecast of United States Bus Duct Trunking System Market Revenues, Until 2025F
- Historical Data of UNITED STATES Bus Duct Trunking System Market Revenues, by Insulation, for the Period 2015-2019
- Market Size & Forecast of UNITED STATES Bus Duct Trunking System Market Revenues, by Insulation, Until 2025F
- Historical Data of UNITED STATES Bus Duct Trunking System Market Revenues, by Power Rating, for the Period 2015-2019
- Market Size & Forecast of UNITED STATES Bus Duct Trunking System Market Revenues, by Power Rating, Until 2025F
- Historical Data of UNITED STATES Bus Duct Trunking System Market Revenues, by Conductor, for the Period 2015-2019
- Market Size & Forecast of UNITED STATES Bus Duct Trunking System Market Revenues, by Conductor, Until 2025F
- Historical Data of UNITED STATES Bus Duct Trunking System Market Revenues, By Applications, for the Period 2015-2019
- Market Size & Forecast of UNITED STATES Bus Duct Trunking System Market Revenues, By Applications, Until 2025F
- Market Drivers and Restraints
- Market Trends and Industry Life Cycle
- Porter’s Five Force Analysis
- Market Opportunity Assessment
- UNITED STATES Bus Duct Market Revenue Share, By Players
- UNITED STATES Bus Duct Market Overview Market on Competitive Benchmarking
- Company Profiles
- Key Strategic Recommendations
Market Scope and Segmentation
The report provides a detailed analysis of the following market segments:
By Insulation
- Air
- Sandwich
By Power Range
- Lighting Power Range
- Low Power Range
- Medium Power Range
- High Power Range
By Conductor
- Copper
- Aluminum
By Applications
- Commercial
- Industrial
- Residential
- Transportation
- Others (Power Utilities, Argo-industries, and Civil Buildings)
Global Go To Market Strategy - 2030
Export potential enables firms to identify high-growth global markets with greater confidence by combining advanced trade intelligence with a structured quantitative methodology. The framework analyzes emerging demand trends and country-level import patterns while integrating macroeconomic and trade datasets such as GDP and population forecasts, bilateral import–export flows, tariff structures, elasticity differentials between developed and developing economies, geographic distance, and import demand projections. Using weighted trade values from 2020–2024 as the base period to project country-to-country export potential for 2030, these inputs are operationalized through calculated drivers such as gravity model parameters, tariff impact factors, and projected GDP per-capita growth. Through an analysis of hidden potentials, demand hotspots, and market conditions that are most favorable to success, this method enables firms to focus on target countries, maximize returns, and global expansion with data, backed by accuracy.
By factoring in the projected importer demand gap that is currently unmet and could be potential opportunity, it identifies the potential for the Exporter (Country) among 190 countries, against the general trade analysis, which identifies the biggest importer or exporter.
To discover high-growth global markets and optimize your business strategy:
Click Here
Pricing
- Single User License$ 1,995
- Department License$ 2,400
- Site License$ 3,120
- Global License$ 3,795

Leadership Perspectives from Industry Events
Search
Thought Leadership and Analyst Meet


Our Clients
6WResearch In News
- India Export Attractiveness Tracker 2026
- India Air Conditioner Market Set for Strong Rebound in 2026 After Weather-Led Correction and GST-Driven Recovery: 6Wresearch
- ADAS in India: How Automatic Emergency Braking, Blind Spot Detection & Driver Monitoring are Transforming Road Safety
- Doha a strategic location for EV manufacturing hub: IPA Qatar
- Demand for luxury TVs surging in the GCC, says Samsung
- Empowering Growth: The Thriving Journey of Bangladesh’s Cable Industry
Latest Reports
- Qatar Access and Home Network Market (2026-2032)
- Nicaragua RPG Gaming Market (2026-2032)
- New Zealand RPG Gaming Market (2026-2032)
- Netherlands RPG Gaming Market (2026-2032)
- Nauru RPG Gaming Market (2026-2032)
- Namibia RPG Gaming Market (2026-2032)
- Mozambique RPG Gaming Market (2026-2032)
- Montenegro RPG Gaming Market (2026-2032)
- Mongolia RPG Gaming Market (2026-2032)
- Monaco RPG Gaming Market (2026-2032)
Industry Events and Analyst Meet

EV India Expo 2026

HIMTEX 2026

India Refining Summit 2026

India EV Show 2026

EV tech India Expo 2026
Whitepaper
- Middle East & Africa Commercial Security Market Click here to view more.
- Middle East & Africa Fire Safety Systems & Equipment Market Click here to view more.
- GCC Drone Market Click here to view more.
- Middle East Lighting Fixture Market Click here to view more.
- GCC Physical & Perimeter Security Market Click here to view more.