South Africa Bus Duct Trunking System Market (2025-2031) | Industry, Companies, Analysis, Growth, Trends, Outlook, Forecast, Share, Size, Revenue & Value
Market Forecast By Insulation (Air And Sandwich), By Power Range (Lighting Power Range, Low Power Range, Medium Power Range And High Power Range), By Conductor (Copper And Aluminium), By Applications (Commercial, Industrial, Residential, Transportation And Others Including Power Utilities, Argo-Industries, And Civil Buildings) And Competitive Landscape
| Product Code: ETC150359 | Publication Date: Jan 2025 | Updated Date: Aug 2025 | Product Type: Report | |
| Publisher: 6Wresearch | Author: Ravi Bhandari | No. of Pages: 70 | No. of Figures: 35 | No. of Tables: 5 |
South Africa Bus Duct Trunking System Market Highlights
| Report Name | South Africa Bus Duct Trunking System Market |
| CAGR | 7% |
| Growing Sector | Industrial |
| Forecast Period | 2025-2031 |
Topics Covered in South Africa Bus Duct Trunking System Market Report
The South Africa Bus Duct Trunking System Market report thoroughly covers the market by insulation, by power range, by conductor, and by application. The market report provides an unbiased and detailed analysis of the ongoing market trends, opportunities/high growth areas, and market drivers which would help the stakeholders to devise and align their market strategies according to the current and future market dynamics.
South Africa Bus Duct Trunking System Market Synopsis
The South Africa Bus Duct Trunking System Market is experiencing steady growth driven by the increasing demand for efficient power transmission and distribution solutions in the region. This market encompasses the manufacturing and deployment of bus duct trunking systems, which offer a compact and flexible alternative to conventional cable systems. With urbanization and industrialization on the rise, there is a heightened focus on enhancing infrastructure to support burgeoning electrical demands. Key industries propelling this market include commercial buildings, data centers, and industrial facilities, where reliability and space-saving solutions are critical. As South Africa continues to modernize its power infrastructure, investments in smart grid projects and renewable energy sources are anticipated to further support the expansion of this market.
According to 6Wresearch, South Africa Bus Duct Trunking System Market size is projected to witness a CAGR of 7% during the forecast period of 2025-2031. the increasing demand for efficient and flexible power distribution solutions in commercial and industrial sectors. As businesses seek to upgrade their infrastructure to accommodate growing power needs and enhance operational efficiency, bus duct trunking systems offer a viable solution due to their modular nature and ease of installation. Additionally, the government's emphasis on infrastructure development and renewable energy projects further boosts the market, as these systems are integral to the electrical distribution networks of new installations.
The initial cost of bus duct trunking systems can be a barrier for some businesses, particularly small and medium-sized enterprises, which may favor less costly but less efficient alternatives. Furthermore, the market's growth is hindered by a lack of skilled professionals capable of installing and maintaining these systems, potentially leading to delays and increased operational costs. Environmental concerns and regulatory changes also pose challenges, as companies must adapt to evolving standards that aim to reduce environmental impact while ensuring safety and reliability.
South Africa Bus Duct Trunking System Market: Leading Players
The South Africa bus duct trunking system market features several key players who drive innovation and maintain competitive standards within the industry. Companies such as Schneider Electric, Siemens AG, and ABB Ltd. are prominent due to their comprehensive product offerings and strong presence in the market. Schneider Electric is renowned for its sustainable solutions and extensive distribution network. Siemens AG stands out with its advanced technological integrations and emphasis on energy efficiency. Meanwhile, ABB Ltd. focuses on delivering reliable and robust electrical infrastructure products. These leading players are instrumental in shaping the industry's future through continuous research, development, and strategic partnerships.
South Africa Bus Duct Trunking System Market: Government Initiatives
The South African government has been actively promoting infrastructure development, which significantly contributes to the growth of the bus duct trunking system market. Through various public sector projects and investments in key industries such as energy, transportation, and construction, the government aims to modernize and expand the country's infrastructure. These initiatives align with national development plans that focus on integrating efficient and sustainable technologies, where bus duct trunking systems play a crucial role. By encouraging innovative solutions and enhancing existing infrastructure, government efforts facilitate increased demand for advanced electrical distribution systems, paving the way for substantial market expansion in the bus duct sector.
Future Insights of South Africa Bus Duct Trunking System Market
The future of the South Africa Bus Duct Trunking System Market appears promising, driven by several key factors that are expected to influence its growth. As the country continues to focus on infrastructure development and urbanization, there is an increasing demand for efficient and reliable power distribution systems. This trend is likely to boost the adoption of bus duct trunking systems due to their advantages in flexibility, safety, and ease of installation compared to traditional cable systems. Additionally, the push towards renewable energy and sustainable practices is anticipated to further propel the market, as bus duct systems are known for their efficiency and minimal energy loss. Technological advancements and innovations in the field are also expected to contribute to the market's evolution, offering improved products with enhanced features that cater to various industrial and commercial needs.
South Africa Bus Duct Trunking System Market trends
- Rising Urbanization and Industrialization – The rapid urban growth and industrialization in South Africa are significant drivers for the bus duct trunking system market. As cities expand and industries scale up their operations, the demand for efficient power distribution solutions increases, paving the way for the growth of bus duct trunking systems.
- Energy Efficiency and Sustainability – There is a growing emphasis on energy efficiency and sustainable building practices. Bus duct trunking systems are preferred for their ability to reduce energy loss during transmission compared to traditional cabling systems, aligning well with green building standards and governmental regulations focused on reducing carbon footprints.
- Technological Advancements - Innovations in materials and technology have led to the development of more advanced bus duct trunking systems. These systems feature better insulation, increased fire resistance, and enhanced current carrying capacity, which makes them suitable for high-demand applications in commercial and industrial sectors.
Investment opportunities in South Africa Bus Duct Trunking System Market
- Expanding Industrial Sector – The industrial sector in South Africa is expanding, requiring robust and flexible power distribution solutions. Investing in bus duct trunking systems caters to this need by providing scalable power solutions suited for different industrial applications.
- Replacement and Upgrade Demand – Aging electrical infrastructure in many parts of South Africa necessitates replacement and upgrades. Investors can tap into this demand by providing modern bus duct trunking systems that enhance reliability and safety.
- Ease of Installation and Maintenance - Bus duct trunking systems are easy to install, reducing downtime and installation costs. They also require minimal maintenance, resulting in lower operational expenses for industrial and urban settings.
Air to dominate the market - By insulation
According to Ravi Bhandari, Research Head, 6Wresearch, The South Africa Bus Duct Trunking System Market is seeing significant developments in the utilization of air-type bus duct systems. These systems are increasingly favored for their efficient heat dissipation and cost-effectiveness. Air-type bus ducts offer a more reliable alternative for energy distribution within industrial and commercial buildings, reducing the likelihood of overheating and ensuring consistent performance. Their design facilitates easier installation and maintenance, which can result in further operational savings. As the demand for sustainable and energy-efficient solutions grows, air-type bus ducts are becoming a preferred choice in the South African market, aligning with the broader trend towards modernizing infrastructure with innovative technologies.
Medium power range to dominate the market – By power range
The medium power range in the South Africa Bus Duct Trunking System Market is gaining traction as businesses seek scalable and adaptable energy solutions. This range is specifically designed to cater to the demands of medium-sized industrial and commercial facilities, offering an ideal balance between performance and cost-efficiency. These systems are particularly valued for their flexibility in supporting diverse operations, which is crucial for businesses looking to optimize their energy distribution without incurring excessive costs.
Copper to dominate the market – By conductor
Copper plays a pivotal role in the South Africa Bus Duct Trunking System Market, renowned for its superior electrical conductivity, making it an indispensable material for efficient energy transmission. Its ability to handle high current loads with minimal energy loss is essential for ensuring the reliability and integrity of bus duct systems. Moreover, copper's durability and resistance to corrosion make it suitable for the diverse environmental conditions found in South Africa, further enhancing system longevity. With the increasing emphasis on sustainable practices, copper's recyclability adds another layer of advantage, aligning with global environmental goals.
Industrial to dominate the market – By applications
The industrial sector in the South Africa Bus Duct Trunking System Market is witnessing significant growth, driven by the surge in manufacturing and heavy industries. As South Africa continues to develop its infrastructure, the demand for reliable and efficient electrical distribution systems has never been higher. Industrial facilities require robust bus duct systems that can withstand harsh operating conditions while ensuring minimal downtime and maintenance. This need has propelled innovative solutions, often incorporating advanced materials and technology to enhance performance. The market is further bolstered by governmental initiatives aimed at boosting industrial productivity, leading to increased investments in state-of-the-art bus duct systems.
Key Attractiveness of the Report
- 10 Years Market Numbers.
- Historical Data Starting from 2021 to 2024.
- Base Year: 2024
- Forecast Data until 2031.
- Key Performance Indicators Impacting the Market.
- Major Upcoming Developments and Projects.
Key Highlights of the Report:
- South Africa Bus Duct Trunking System Market Outlook
- Market Size of South Africa Bus Duct Trunking System Market, 2024
- Forecast of South Africa Bus Duct Trunking System Market, 2031
- Historical Data and Forecast of South Africa Bus Duct Trunking System Revenues & Volume for the Period 2021 - 2031
- South Africa Bus Duct Trunking System Market Trend Evolution
- South Africa Bus Duct Trunking System Market Drivers and Challenges
- South Africa Bus Duct Trunking System Price Trends
- South Africa Bus Duct Trunking System Porter's Five Forces
- South Africa Bus Duct Trunking System Industry Life Cycle
- Historical Data and Forecast of South Africa Bus Duct Trunking System Market Revenues & Volume By product type for the Period 2021 - 2031
- Historical Data and Forecast of South Africa Bus Duct Trunking System Market Revenues & Volume by Construction aggregates, for the Period 2021 - 2031
- Historical Data and Forecast of South Africa Bus Duct Trunking System Market Revenues & Volume by insulation, for the Period 2021 - 2031
- Historical Data and Forecast of South Africa Bus Duct Trunking System Market Revenues & Volume by Air for the Period 2021 - 2031
- Historical Data and Forecast of South Africa Bus Duct Trunking System Market Revenues & Volume by Sandwich for the Period 2021 - 2031
- Historical Data and Forecast of South Africa Bus Duct Trunking System Market Revenues & Volume By power range for the Period 2021 - 2031
- Historical Data and Forecast of South Africa Bus Duct Trunking System Market Revenues & Volume by Lightning power range, for the Period 2021 - 2031
- Historical Data and Forecast of South Africa Bus Duct Trunking System Market Revenues & Volume by Low power range for the Period 2021 - 2031
- Historical Data and Forecast of South Africa Bus Duct Trunking System Market Revenues & Volume by Medium Power range for the Period 2021 – 2031
- Historical Data and Forecast of South Africa Bus Duct Trunking System Market Revenues & Volume by High Power range for the Period 2021 – 2031
- Historical Data and Forecast of South Africa Bus Duct Trunking System Market Revenues & Volume by conductor for the Period 2021 – 2031
- Historical Data and Forecast of South Africa Bus Duct Trunking System Market Revenues & Volume by Copper for the Period 2021 – 2031
- Historical Data and Forecast of South Africa Bus Duct Trunking System Market Revenues & Volume by Aluminium for the Period 2021 – 2031
- Historical Data and Forecast of South Africa Bus Duct Trunking System Market Revenues & Volume by application for the Period 2021 – 2031
- Historical Data and Forecast of South Africa Bus Duct Trunking System Market Revenues & Volume by Commercial for the Period 2021 – 2031
- Historical Data and Forecast of South Africa Bus Duct Trunking System Market Revenues & Volume by Industrial for the Period 2021 – 2031
- Historical Data and Forecast of South Africa Bus Duct Trunking System Market Revenues & Volume by Residential for the Period 2021 – 2031
- Historical Data and Forecast of South Africa Bus Duct Trunking System Market Revenues & Volume by Transportation for the Period 2021 – 2031
- Historical Data and Forecast of South Africa Bus Duct Trunking System Market Revenues & Volume by Others for the Period 2021 – 2031
- South Africa Bus Duct Trunking System Import Export Trade Statistics
- Market Opportunity Assessment By application
- Market Opportunity Assessment by Product Type
- South Africa Bus Duct Trunking System Top Companies Market Share
- South Africa Bus Duct Trunking System Competitive Benchmarking by Technical and Operational Parameters
- South Africa Bus Duct Trunking System Company Profiles
- South Africa Bus Duct Trunking System Key Strategic Recommendations
Market Covered
The report offers a comprehensive study of the subsequent market segments:
By Insulation
- Air
- Sandwich
By Power Range
- Lighting Power Range
- Low Power Range
- Medium Power Range
- High Power Range
By Conductor
- Copper
- Aluminium
By Applications
- Commercial
- Industrial
- Residential
- Transportation
- Others (Power Utilities, Argo-industries, and Civil Buildings)
South Africa Bus Duct Trunking System Market (2025-2031): FAQs
Key factors contributing to market growth include rapid urbanization, the development of smart cities, and the increasing investment in commercial and industrial construction projects.
Some challenges include fluctuating raw material prices, potential supply chain disruptions, and the need for skilled labor to install and maintain these complex systems.
Some of the major players operating in the South African market include ABB, Schneider Electric, Siemens, General Electric, Eaton Corporation, and Legrand SA.
Increasing awareness about energy efficiency and sustainability is driving the demand for more advanced and efficient electrical distribution solutions.
| 1. Executive Summary |
| 2. Introduction |
| 2.1. Report Description |
| 2.2. Key Highlights of the Report |
| 2.3. Market Scope & Segmentation |
| 2.4. Research Methodology |
| 2.5. Assumptions |
| 3. South Africa Bus Duct Trunking System Market Overview |
| 3.1. SOUTH AFRICA Bus Duct Trunking System Market Revenues, 2021-2031F |
| 3.2. SOUTH AFRICA Bus Duct Trunking System Market - Industry Life Cycle, 2021 |
| 3.3. SOUTH AFRICA Bus Duct Trunking System Market - Porter’s Five Forces |
| 3.4. SOUTH AFRICA Bus Duct Trunking System Market Value Chain & Ecosystem |
| 3.5. SOUTH AFRICA Bus Duct Trunking System Market Revenue Share, By Insulation, 2021 & 2031F |
| 3.6. SOUTH AFRICA Bus Duct Trunking System Market Revenue Share, By Power Rating, 2021 & 2031F |
| 3.7. SOUTH AFRICA Bus Duct Trunking System Market Revenue Share, By Conductor, 2021 & 2031F |
| 3.8. SOUTH AFRICA Bus Duct Trunking System Market Revenue Share, By Application, 2021 & 2031F |
| 3.9. SOUTH AFRICA Bus Duct Trunking System Market Revenue Share, By Region, 2021 & 2031F |
| 4. South Africa Bus Duct Trunking System Market Dynamics |
| 4.1. Impact Analysis |
| 4.2. Market Drivers |
| 4.2.1 Increasing urbanization and industrialization leading to higher demand for efficient power distribution systems. |
| 4.2.2 Government initiatives promoting infrastructure development and energy efficiency. |
| 4.2.3 Growing investments in renewable energy projects driving the need for reliable power distribution solutions. |
| 4.3. Market Restraints |
| 4.3.1 High initial investment costs associated with installing bus duct trunking systems. |
| 4.3.2 Lack of awareness among end-users about the benefits and applications of bus duct trunking systems. |
| 4.3.3 Limited availability of skilled labor for installation and maintenance of bus duct trunking systems. |
| 5. South Africa Bus Duct Trunking System Market Trends |
| 6. South Africa Bus Duct Trunking System Market Overview, By Insulation |
| 6.1. SOUTH AFRICA Bus Duct Trunking System Market Revenues, By Air Insulation, 2021-2031F |
| 6.2. SOUTH AFRICA Bus Duct Trunking System Market Revenues, By Sandwich insulation, 2021-2031F |
| 7. South Africa Bus Duct Trunking System Market Overview, By Power Rating |
| 7.1. SOUTH AFRICA Bus Duct Trunking System Market Revenues, By Lighting Power Range, 2021-2031F |
| 7.2. SOUTH AFRICA Bus Duct Trunking System Market Revenues, By Low Power Range, 2021-2031F |
| 7.3. SOUTH AFRICA Bus Duct Trunking System Market Revenues, By Medium Power Range, 2021-2031F |
| 7.4. SOUTH AFRICA Bus Duct Trunking System Market Revenues, By High Power Range, 2021-2031F |
| 8. South Africa Bus Duct Trunking System Market Overview, By Conductor |
| 8.1. SOUTH AFRICA Bus Duct Trunking System Market Revenues, By Copper, 2021-2031F |
| 8.2. SOUTH AFRICA Bus Duct Trunking System Market Revenues, By Aluminium, 2021-2031F |
| 9. South Africa Bus Duct Trunking System Market Overview, By Application |
| 9.1. SOUTH AFRICA Bus Duct Trunking System Market Revenues, By Commercial Application, 2021-2031F |
| 9.2. SOUTH AFRICA Bus Duct Trunking System Market Revenues, By Industrial Application, 2021-2031F |
| 9.3. SOUTH AFRICA Bus Duct Trunking System Market Revenues, By Residential Application, 2021-2031F |
| 9.4. SOUTH AFRICA Bus Duct Trunking System Market Revenues, By Transportation Application, 2021-2031F |
| 9.5. SOUTH AFRICA Bus Duct Trunking System Market Revenues, By Other Applications, 2021-2031F |
| 10. South Africa Bus Duct Trunking System Market Overview, By Region |
| 10.1. SOUTH AFRICA Bus Duct Trunking System Market Revenues, By Northern Region, 2021-2031F |
| 10.2. SOUTH AFRICA Bus Duct Trunking System Market Revenues, By Southern Region, 2021-2031F |
| 10.3. SOUTH AFRICA Bus Duct Trunking System Market Revenues, By Eastern Region, 2021-2031F |
| 10.4. SOUTH AFRICA Bus Duct Trunking System Market Revenues, By Western Region, 2021-2031F |
| 11. South Africa Bus Duct Trunking System Market - Government Standards, Certifications, and Regulations |
| 12. South Africa Bus Duct Trunking System Market - Identification of Test Facilities / Certifying Bodies in South Africa |
| 13. South Africa Bus Duct Trunking System Market - Manufacturing Analysis |
| 14. South Africa Bus Duct Trunking System Market - Key Performance Indicators |
| 14.1 Energy efficiency improvements achieved through the implementation of bus duct trunking systems. |
| 14.2 Reduction in downtime and maintenance costs for power distribution systems. |
| 14.3 Increase in the adoption rate of bus duct trunking systems by key industries. |
| 14.4 Number of new projects incorporating bus duct trunking systems for power distribution. |
| 14.5 Percentage of energy savings realized by using bus duct trunking systems. |
| 15. South Africa Bus Duct Trunking System Market - Opportunity Assessment |
| 15.1. SOUTH AFRICA Bus Duct Trunking System Market Opportunity Assessment, By Conductor, 2031F |
| 15.2. SOUTH AFRICA Bus Duct Trunking System Market Opportunity Assessment, By Application, 2031F |
| 15.3. SOUTH AFRICA Bus Duct Trunking System Market Opportunity Assessment, By Region, 2031F |
| 16. South Africa Bus Duct Trunking System Market Competitive Landscape |
| 16.1. SOUTH AFRICA Bus Duct Trunking System Market Revenue Share, By Company, 2021 |
| 16.2. SOUTH AFRICA Bus Duct Trunking System Market Competitive Benchmarking, By Operating Parameters |
| 17. Company Profiles |
| 18. Key Strategic Recommendations |
| 19. Disclaimer |
| List of Figures |
| Figure 1. SOUTH AFRICA Bus Duct Trunking System Market Revenues, 2021-2031F ($ Million) |
| Figure 2. SOUTH AFRICA Bus Duct Trunking System Market - Industry Life Cycle, 2021 |
| Figure 3. SOUTH AFRICA Bus Duct Trunking System Market Revenue Share, By Insulation, 2021 & 2031F |
| Figure 4. SOUTH AFRICA Bus Duct Trunking System Market Revenue Share, By Power Range, 2021 & 2031F |
| Figure 5. SOUTH AFRICA Bus Duct Trunking System Market Revenue Share, By Conductor, 2021 & 2031F |
| Figure 6. SOUTH AFRICA Bus Duct Trunking System Market Revenue Share, By Application, 2021 & 2031F |
| Figure 7. SOUTH AFRICA Bus Duct Trunking System Market Revenue Share, By Region, 2021 & 2031F |
| Figure 8. SOUTH AFRICA Upcoming Mall Supply, 2021-2031E (Million sq.ft.) |
| Figure 9. SOUTH AFRICA Healthcare Spending as a Percentage of GDP, 2021 - 2031F |
| Figure 10. SOUTH AFRICA Projected Infrastructure Investment in Railways, 2021 - 2031 (INR Thousand Crore) |
| Figure 11. SOUTH AFRICA Planned Metro Network Expansion - New Lines (km) |
| Figure 12. SOUTH AFRICA Infrastructure Investment Forecast, 2021-2031 (INR Lakh Crore) |
| Figure 13. SOUTH AFRICA Sector-wise Infrastructure Investment Forecast, 2021-2031 (INR Lakh Crore) |
| Figure 14. International Copper Prices, 2021 ($/metric ton) |
| Figure 15. SOUTH AFRICA Bus Duct Trunking System Market Revenues, By Commercial Application, 2021-2031F ($ Million) |
| Figure 16. SOUTH AFRICA Bus Duct Trunking System Market Revenues, By Industrial Application, 2021-2031F ($ Million) |
| Figure 17. SOUTH AFRICA Bus Duct Trunking System Market Revenues, By Residential Application, 2021-2031F ($ Million) |
| Figure 18. SOUTH AFRICA Bus Duct Trunking System Market Revenues, By Transportation Application, 2021-2031F ($ Million) |
| Figure 19. SOUTH AFRICA Bus Duct Trunking System Market Revenues, By Other Application, 2021-2031F ($ Million) |
| Figure 20. SOUTH AFRICA Bus Duct Trunking System Market Revenues, By Northern Region, 2021-2031F ($ Million) |
| Figure 21. SOUTH AFRICA Bus Duct Trunking System Market Revenues, By Southern Region, 2021-2031F ($ Million) |
| Figure 22. SOUTH AFRICA Bus Duct Trunking System Market Revenues, By Eastern Region, 2021-2031F ($ Million) |
| Figure 23. SOUTH AFRICA Bus Duct Trunking System Market Revenues, By Western Region, 2021-2031F ($ Million) |
| Figure 24. SOUTH AFRICA Actual Government Spending Vs Actual Government Revenues, 2021-2024F (INR Trillion) |
| Figure 25. SOUTH AFRICA New Office Supply in Major SOUTH AFRICA Cities, 2021–2031E (Million sq. ft.) |
| Figure 26. SOUTH AFRICA Organized Retail Space Completions, 2021-2031E (Million Sq. Ft.) |
| Figure 27. SOUTH AFRICA Foreign Tourist Arrivals, 2021 – 2031 (Lakhs) |
| Figure 28. SOUTH AFRICA Travel & Tourism Total Contribution to SOUTH AFRICA’s GDP, 2021-2031F (INR Billion) |
| Figure 29. Growth of Hotel Rooms Supply in SOUTH AFRICA, FY2021 & FY2031F (No. of Rooms) |
| Figure 30. SOUTH AFRICA Branded Hotel Rooms Supply Across Major Cities in SOUTH AFRICA, FY2021 & FY2031F (No. of Rooms) |
| Figure 31. SOUTH AFRICA Technology Wise Contribution Towards Renewable Energy Targets, SOUTH AFRICA(2021) |
| Figure 32. SOUTH AFRICA Renewable Energy Capacity Target, 2021-2031F (MW) |
| Figure 33. SOUTH AFRICA Total Renewable Energy Capacity Addition Share in 2021, MW |
| Figure 34. SOUTH AFRICA Solar Tenders and Auctions in 2021 (MW) |
| Figure 35. SOUTH AFRICA Top Ten States in Solar Installation Capacity (MW), Till March 2021 |
| Figure 36. SOUTH AFRICA Rooftop PV Installation Target till March 2021 (MW) |
| Figure 37. SOUTH AFRICA Bus Duct Trunking System Market Opportunity Assessment, By Conductor (2031F) |
| Figure 38. SOUTH AFRICA Bus Duct Trunking System Market Opportunity Assessment, By Application (2031F) |
| Figure 39. SOUTH AFRICA Bus Duct Trunking System Market Opportunity Assessment, By Region (2031F) |
| Figure 40. SOUTH AFRICA Bus Duct Trunking System Market Revenue Share, By Company, 2021 |
| List of Tables |
| Table 1. SOUTH AFRICA Bus Duct Trunking System Market Revenues, By Insulation, 2021-2031F ($ Million) |
| Table 2. SOUTH AFRICA Bus Duct Trunking System Market Revenues, By Power Rating, 2021-2031F ($ Million) |
| Table 3. SOUTH AFRICA Bus Duct Trunking System Market Revenues, By Conductor, 2021-2031F ($ Million) |
| Table 4. SOUTH AFRICA Proposed Branded New Hotel Room Supply, FY2021 (Number of Rooms) |
| Table 5. SOUTH AFRICA Tourism Sector Key Indicators, 2031F |
| Table 6. SOUTH AFRICA Upcoming Airport Projects |
| Table 7. SOUTH AFRICA Solar Capacity Target (GW), By Segments, 2021-2031F |
| Table 8. SOUTH AFRICA Proposed Plans Under Green Corridor Phase II, By States |
| Table 9. Upcoming Retail Sector Projects in SOUTH AFRICA |
| Table 10. Upcoming Metro Projects in SOUTH AFRICA |
Market Forecast By Insulation (Air And Sandwich), By Power Range (Lighting Power Range, Low Power Range, Medium Power Range And High Power Range), By Conductor (Copper And Aluminium), By Applications (Commercial, Industrial, Residential, Transportation And Others Including Power Utilities, Argo-Industries, And Civil Buildings) And Competitive Landscape
| Product Code: ETC150359 | Publication Date: Jan 2022 | Product Type: Market Research Report | |
| Publisher: 6Wresearch | No. of Pages: 80 | No. of Figures: 14 | No. of Tables: 4 |
South Africa Bus Duct Trunking System Market report comprehensively covers the market by insulation, power rating, conductor, and applications. The South Africa bus duct trunking system market outlook report provides an unbiased and detailed analysis of the South Africa bus duct trunking system market trends, opportunities, high growth areas, and market drivers which would help the stakeholders to devise and align their market strategies according to the current and future market dynamics.
South Africa Bus Duct Trunking System Market Synopsis
In recent years, the country’s rising debt, weakened government institutions, and overall slow economic growth have led to a slump in the construction activities in South Africa, which affected the demand for a bus duct trunking system. However, the Covid-19 pandemic had slowed down the market in terms of the supply of the product during 2020. While on the other hand, the demand-side also fell victim to the slowdown due to the market being closed during the lockdown period. Currently, the market has recovered gradually and is likely to witness growth over the coming years.
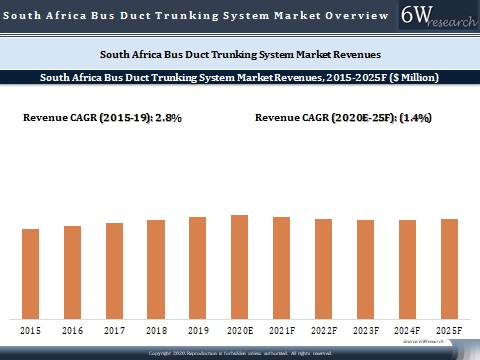
According to 6Wresearch, the South Africa Bus Duct Trunking System Market size is expected to grow at a CAGR of 1.4% during 2020-2025. With the diversification plans and the favorable debt structure of the newly elected government along with a substantial domestic investor pool, the construction industry is predicted to rise from this slump. Additionally, increasing investment in the industrial sector of the country and the construction of data centers by tech giants such as Huawei and Amazon would further fuel the demand for bus duct trunking systems.
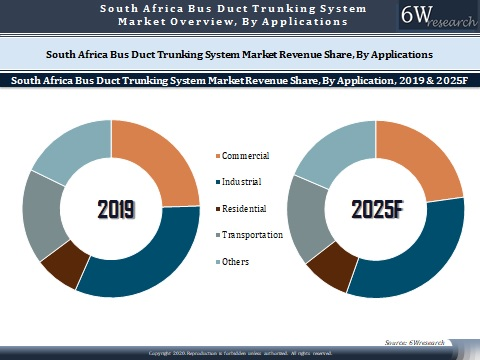
Market Analysis By Applications
In terms of applications, industrial application dominates the overall South Africa bus duct trunking system market. Further, the commercial application also held the majority of the market revenue share in 2019. Together the industrial and commercial applications held a major chunk of revenue share in 2019. Additionally, residential and transportation are the other major applications.
Key Attractiveness of the Report
- COVID-19 Impact on the Market.
- 10 Years Market Numbers.
- Historical Data Starting from 2015 to 2019.
- Base Year: 2019
- Forecast Data until 2025.
- Key Performance Indicators Impacting the Market.
- Major Upcoming Developments and Projects.
Key Highlights of the Report:
- South Africa Bus Duct Market Overview
- South Africa Bus Duct Market Outlook
- South Africa Bus Duct Market Forecast
- Historical Data of South Africa Bus Duct Trunking System Market Revenues for the Period 2015-2019
- Market Size & Forecast of South Africa Bus Duct Trunking System Market Revenues, Until 2025F
- Historical Data of SOUTH AFRICA Bus Duct Trunking System Market Revenues, by Insulation, for the Period 2015-2019
- Market Size & Forecast of SOUTH AFRICA Bus Duct Trunking System Market Revenues, by Insulation, Until 2025F
- Historical Data of SOUTH AFRICA Bus Duct Trunking System Market Revenues, by Power Rating, for the Period 2015-2019
- Market Size & Forecast of SOUTH AFRICA Bus Duct Trunking System Market Revenues, by Power Rating, Until 2025F
- Historical Data of SOUTH AFRICA Bus Duct Trunking System Market Revenues, by Conductor, for the Period 2015-2019
- Market Size & Forecast of SOUTH AFRICA Bus Duct Trunking System Market Revenues, by Conductor, Until 2025F
- Historical Data of SOUTH AFRICA Bus Duct Trunking System Market Revenues, By Applications, for the Period 2015-2019
- Market Size & Forecast of SOUTH AFRICA Bus Duct Trunking System Market Revenues, By Applications, Until 2025F
- Market Drivers and Restraints
- Market Trends and Industry Life Cycle
- Porter’s Five Force Analysis
- Market Opportunity Assessment
- SOUTH AFRICA Bus Duct Market Revenue Share, By Players
- SOUTH AFRICA Bus Duct Market Overview Market on Competitive Benchmarking
- Company Profiles
- Key Strategic Recommendations
Market Scope and Segmentation
The report provides a detailed analysis of the following market segments:
By Insulation
- Air
- Sandwich
By Power Range
- Lighting Power Range
- Low Power Range
- Medium Power Range
- High Power Range
By Conductor
- Copper
- Aluminum
By Applications
- Commercial
- Industrial
- Residential
- Transportation
- Others (Power Utilities, Argo-industries, and Civil Buildings)
Global Go To Market Strategy - 2030
Export potential enables firms to identify high-growth global markets with greater confidence by combining advanced trade intelligence with a structured quantitative methodology. The framework analyzes emerging demand trends and country-level import patterns while integrating macroeconomic and trade datasets such as GDP and population forecasts, bilateral import–export flows, tariff structures, elasticity differentials between developed and developing economies, geographic distance, and import demand projections. Using weighted trade values from 2020–2024 as the base period to project country-to-country export potential for 2030, these inputs are operationalized through calculated drivers such as gravity model parameters, tariff impact factors, and projected GDP per-capita growth. Through an analysis of hidden potentials, demand hotspots, and market conditions that are most favorable to success, this method enables firms to focus on target countries, maximize returns, and global expansion with data, backed by accuracy.
By factoring in the projected importer demand gap that is currently unmet and could be potential opportunity, it identifies the potential for the Exporter (Country) among 190 countries, against the general trade analysis, which identifies the biggest importer or exporter.
To discover high-growth global markets and optimize your business strategy:
Click Here
Pricing
- Single User License$ 1,995
- Department License$ 2,400
- Site License$ 3,120
- Global License$ 3,795

Leadership Perspectives from Industry Events
Search
Thought Leadership and Analyst Meet


Our Clients
6WResearch In News
- India Export Attractiveness Tracker 2026
- India Air Conditioner Market Set for Strong Rebound in 2026 After Weather-Led Correction and GST-Driven Recovery: 6Wresearch
- ADAS in India: How Automatic Emergency Braking, Blind Spot Detection & Driver Monitoring are Transforming Road Safety
- Doha a strategic location for EV manufacturing hub: IPA Qatar
- Demand for luxury TVs surging in the GCC, says Samsung
- Empowering Growth: The Thriving Journey of Bangladesh’s Cable Industry
Latest Reports
- Nicaragua RPG Gaming Market (2026-2032)
- New Zealand RPG Gaming Market (2026-2032)
- Netherlands RPG Gaming Market (2026-2032)
- Nauru RPG Gaming Market (2026-2032)
- Namibia RPG Gaming Market (2026-2032)
- Mozambique RPG Gaming Market (2026-2032)
- Montenegro RPG Gaming Market (2026-2032)
- Mongolia RPG Gaming Market (2026-2032)
- Monaco RPG Gaming Market (2026-2032)
- Micronesia RPG Gaming Market (2026-2032)
Industry Events and Analyst Meet

EV India Expo 2026

HIMTEX 2026

India Refining Summit 2026

India EV Show 2026

EV tech India Expo 2026
Whitepaper
- Middle East & Africa Commercial Security Market Click here to view more.
- Middle East & Africa Fire Safety Systems & Equipment Market Click here to view more.
- GCC Drone Market Click here to view more.
- Middle East Lighting Fixture Market Click here to view more.
- GCC Physical & Perimeter Security Market Click here to view more.