Australia Actuators & Valves Market (2026-2032) Outlook | Value, Forecast, Share, Revenue, Analysis, Growth, Companies, Industry, Size & Trends
Market Forecast By Type (Actuators, Valves), By Application (Oil & Gas, Paper & Pulp, Mining, Water & Wastewater, Food & Beverages, Energy & Power, Automotive, Others) And Competitive Landscape
| Product Code: ETC281675 | Publication Date: Aug 2022 | Updated Date: Mar 2026 | Product Type: Market Research Report | |
| Publisher: 6Wresearch | Author: Ravi Bhandari | No. of Pages: 75 | No. of Figures: 35 | No. of Tables: 20 |
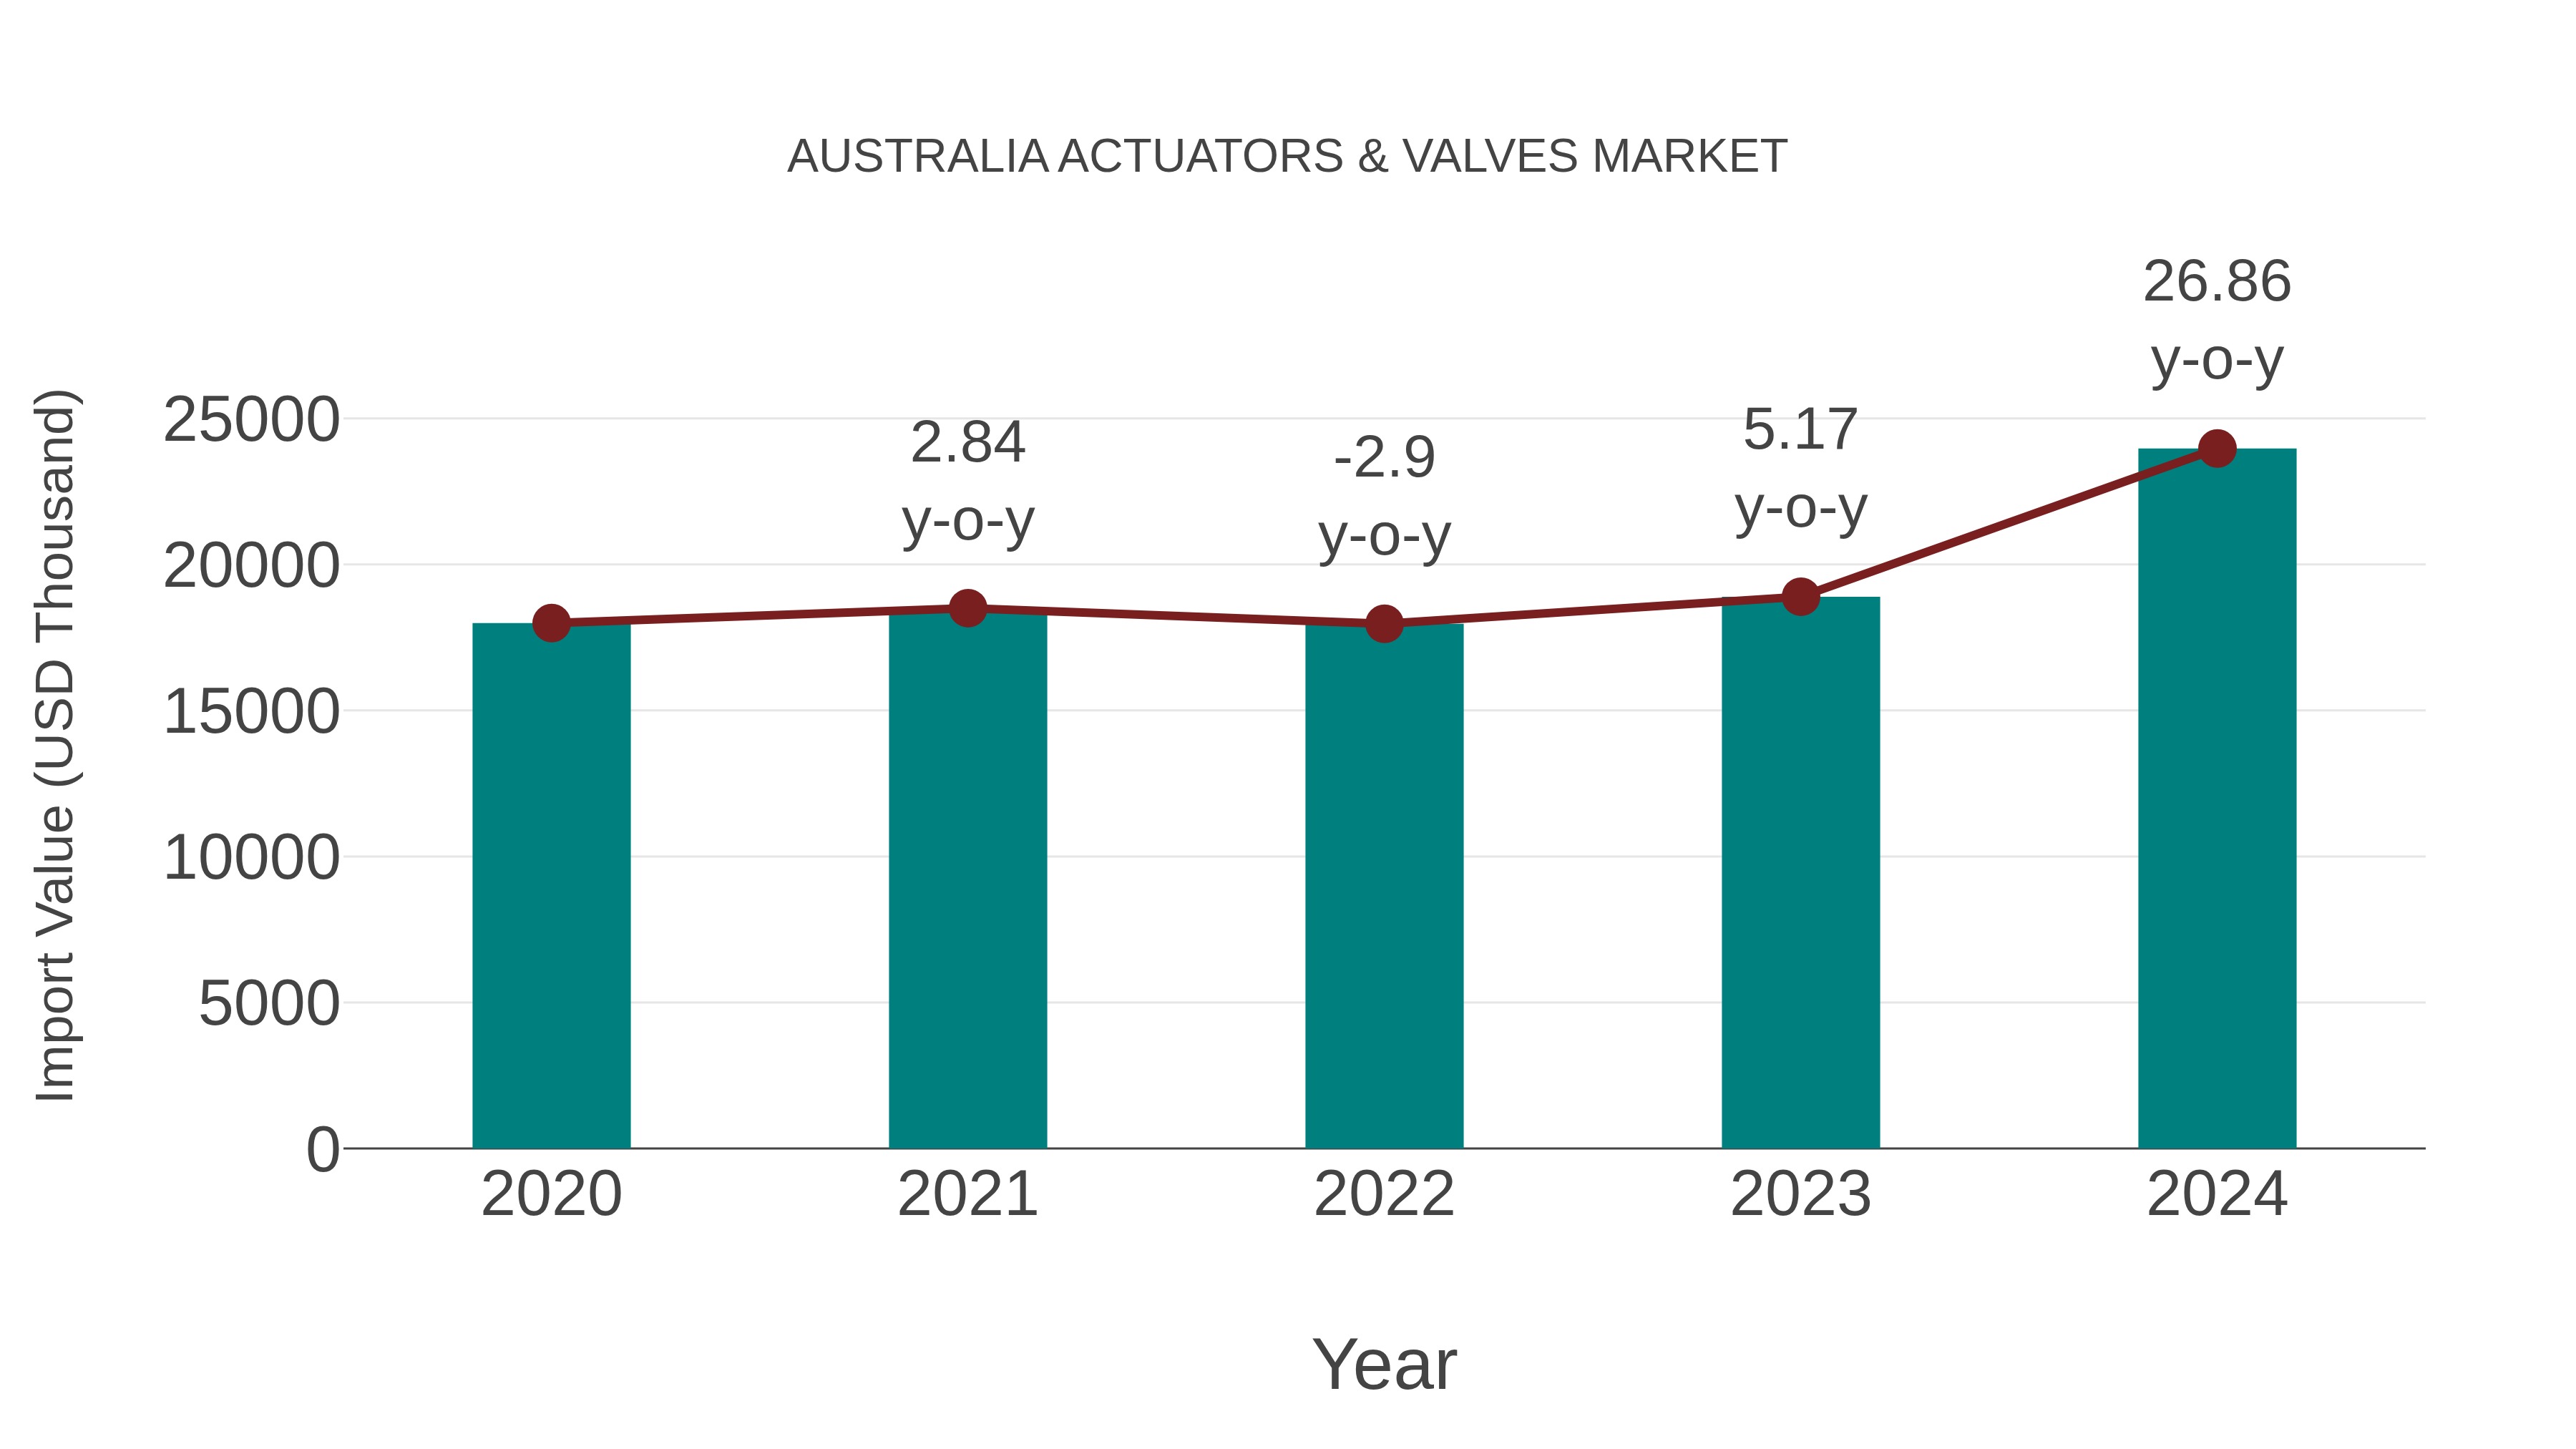
Australia Actuators & Valves Market: Import Trend Analysis
In the Australia actuators & valves market, the import trend showed significant growth from 2023 to 2024, with a rate of 26.86%. The compound annual growth rate (CAGR) for the period 2020-2024 stood at 7.44%. This notable increase in import momentum can be attributed to a surge in demand for advanced industrial equipment and a stable market environment conducive to international trade.
Australia Actuators Valves Market Overview
In Australia, the actuators valves market is experiencing robust growth, driven by the need for efficient fluid control solutions in industries such as oil and gas, water treatment, and chemical processing. Actuated valves offer reliable performance and precise control, contributing to their widespread adoption.
Drivers of the market
In Australia, the Actuators Valves market is witnessing steady growth propelled by the increasing adoption of automated valve control systems across industries such as oil and gas, water treatment, and manufacturing. Actuated valves offer advantages such as remote operation, precise control, and rapid response, enhancing process efficiency and safety. The growing emphasis on reducing downtime, improving productivity, and ensuring regulatory compliance is driving the demand for actuators valves in Australia.
Challenges of the market
Challenges in the Australia actuators valves market include the need for reliability and performance in harsh operating environments. Actuator valves are used in critical applications such as oil and gas, water treatment, and manufacturing, where reliability and durability are paramount. Market players must address challenges such as corrosion resistance, temperature extremes, and pressure fluctuations to meet customer requirements and ensure long-term performance and safety.
Government Policy of the market
Government policies addressing water management, industrial automation, and infrastructure development impact the actuators valves market. Regulations concerning water supply systems, pipeline networks, and valve standards drive demand for actuators valves in various industries.
Key Highlights of the Report:
- Australia Actuators & Valves Market Outlook
- Market Size of Australia Actuators & Valves Market, 2025
- Forecast of Australia Actuators & Valves Market, 2032
- Historical Data and Forecast of Australia Actuators & Valves Revenues & Volume for the Period 2022-2032F
- Australia Actuators & Valves Market Trend Evolution
- Australia Actuators & Valves Market Drivers and Challenges
- Australia Actuators & Valves Price Trends
- Australia Actuators & Valves Porter's Five Forces
- Australia Actuators & Valves Industry Life Cycle
- Historical Data and Forecast of Australia Actuators & Valves Market Revenues & Volume By Type for the Period 2022-2032F
- Historical Data and Forecast of Australia Actuators & Valves Market Revenues & Volume By Actuators for the Period 2022-2032F
- Historical Data and Forecast of Australia Actuators & Valves Market Revenues & Volume By Valves for the Period 2022-2032F
- Historical Data and Forecast of Australia Actuators & Valves Market Revenues & Volume By Application for the Period 2022-2032F
- Historical Data and Forecast of Australia Actuators & Valves Market Revenues & Volume By Oil & Gas for the Period 2022-2032F
- Historical Data and Forecast of Australia Actuators & Valves Market Revenues & Volume By Paper & Pulp for the Period 2022-2032F
- Historical Data and Forecast of Australia Actuators & Valves Market Revenues & Volume By Mining for the Period 2022-2032F
- Historical Data and Forecast of Australia Actuators & Valves Market Revenues & Volume By Water & Wastewater for the Period 2022-2032F
- Historical Data and Forecast of Australia Actuators & Valves Market Revenues & Volume By Food & Beverages for the Period 2022-2032F
- Historical Data and Forecast of Australia Actuators & Valves Market Revenues & Volume By Energy & Power for the Period 2022-2032F
- Historical Data and Forecast of Australia Actuators & Valves Market Revenues & Volume By Automotive for the Period 2022-2032F
- Historical Data and Forecast of Australia Actuators & Valves Market Revenues & Volume By Others for the Period 2022-2032F
- Australia Actuators & Valves Import Export Trade Statistics
- Market Opportunity Assessment By Type
- Market Opportunity Assessment By Application
- Australia Actuators & Valves Top Companies Market Share
- Australia Actuators & Valves Competitive Benchmarking By Technical and Operational Parameters
- Australia Actuators & Valves Company Profiles
- Australia Actuators & Valves Key Strategic Recommendations
Australia Actuators & Valves Market (2026-2032): FAQs
6Wresearch actively monitors the Australia Actuators & Valves Market and publishes its comprehensive annual report, highlighting emerging trends, growth drivers, revenue analysis, and forecast outlook. Our insights help businesses to make data-backed strategic decisions with ongoing market dynamics. Our analysts track relevent industries related to the Australia Actuators & Valves Market, allowing our clients with actionable intelligence and reliable forecasts tailored to emerging regional needs.
Yes, we provide customisation as per your requirements. To learn more, feel free to contact us on sales@6wresearch.com
1 Executive Summary |
2 Introduction |
2.1 Key Highlights of the Report |
2.2 Report Description |
2.3 Market Scope & Segmentation |
2.4 Research Methodology |
2.5 Assumptions |
3 Australia Actuators & Valves Market Overview |
3.1 Australia Country Macro Economic Indicators |
3.2 Australia Actuators & Valves Market Revenues & Volume, 2022 & 2032F |
3.3 Australia Actuators & Valves Market - Industry Life Cycle |
3.4 Australia Actuators & Valves Market - Porter's Five Forces |
3.5 Australia Actuators & Valves Market Revenues & Volume Share, By Type, 2022 & 2032F |
3.6 Australia Actuators & Valves Market Revenues & Volume Share, By Application, 2022 & 2032F |
4 Australia Actuators & Valves Market Dynamics |
4.1 Impact Analysis |
4.2 Market Drivers |
4.2.1 Increasing investments in infrastructure projects in Australia |
4.2.2 Growing adoption of automation in various industries |
4.2.3 Rising focus on energy efficiency and sustainability initiatives |
4.3 Market Restraints |
4.3.1 High initial investment costs associated with advanced actuators and valves |
4.3.2 Intense competition from global market players |
4.3.3 Slowdown in key end-user industries such as oil gas and mining |
5 Australia Actuators & Valves Market Trends |
6 Australia Actuators & Valves Market, By Types |
6.1 Australia Actuators & Valves Market, By Type |
6.1.1 Overview and Analysis |
6.1.2 Australia Actuators & Valves Market Revenues & Volume, By Type, 2022-2032F |
6.1.3 Australia Actuators & Valves Market Revenues & Volume, By Actuators, 2022-2032F |
6.1.4 Australia Actuators & Valves Market Revenues & Volume, By Valves, 2022-2032F |
6.2 Australia Actuators & Valves Market, By Application |
6.2.1 Overview and Analysis |
6.2.2 Australia Actuators & Valves Market Revenues & Volume, By Oil & Gas, 2022-2032F |
6.2.3 Australia Actuators & Valves Market Revenues & Volume, By Paper & Pulp, 2022-2032F |
6.2.4 Australia Actuators & Valves Market Revenues & Volume, By Mining, 2022-2032F |
6.2.5 Australia Actuators & Valves Market Revenues & Volume, By Water & Wastewater, 2022-2032F |
6.2.6 Australia Actuators & Valves Market Revenues & Volume, By Food & Beverages, 2022-2032F |
6.2.7 Australia Actuators & Valves Market Revenues & Volume, By Energy & Power, 2022-2032F |
6.2.8 Australia Actuators & Valves Market Revenues & Volume, By Others, 2022-2032F |
6.2.9 Australia Actuators & Valves Market Revenues & Volume, By Others, 2022-2032F |
7 Australia Actuators & Valves Market Import-Export Trade Statistics |
7.1 Australia Actuators & Valves Market Export to Major Countries |
7.2 Australia Actuators & Valves Market Imports from Major Countries |
8 Australia Actuators & Valves Market Key Performance Indicators |
8.1 Energy efficiency improvements in industries using actuators and valves |
8.2 Adoption rate of smart actuators and valves in key industries |
8.3 Number of infrastructure projects using advanced automation technologies |
8.4 Maintenance cost reduction achieved through efficient actuator and valve utilization |
8.5 Percentage of companies investing in RD for innovative actuators and valves |
9 Australia Actuators & Valves Market - Opportunity Assessment |
9.1 Australia Actuators & Valves Market Opportunity Assessment, By Type, 2022 & 2032F |
9.2 Australia Actuators & Valves Market Opportunity Assessment, By Application, 2022 & 2032F |
10 Australia Actuators & Valves Market - Competitive Landscape |
10.1 Australia Actuators & Valves Market Revenue Share, By Companies, 2025 |
10.2 Australia Actuators & Valves Market Competitive Benchmarking, By Operating and Technical Parameters |
11 Company Profiles |
12 Recommendations |
13 Disclaimer |
Global Go To Market Strategy - 2030
Export potential enables firms to identify high-growth global markets with greater confidence by combining advanced trade intelligence with a structured quantitative methodology. The framework analyzes emerging demand trends and country-level import patterns while integrating macroeconomic and trade datasets such as GDP and population forecasts, bilateral import–export flows, tariff structures, elasticity differentials between developed and developing economies, geographic distance, and import demand projections. Using weighted trade values from 2020–2024 as the base period to project country-to-country export potential for 2030, these inputs are operationalized through calculated drivers such as gravity model parameters, tariff impact factors, and projected GDP per-capita growth. Through an analysis of hidden potentials, demand hotspots, and market conditions that are most favorable to success, this method enables firms to focus on target countries, maximize returns, and global expansion with data, backed by accuracy.
By factoring in the projected importer demand gap that is currently unmet and could be potential opportunity, it identifies the potential for the Exporter (Country) among 190 countries, against the general trade analysis, which identifies the biggest importer or exporter.
To discover high-growth global markets and optimize your business strategy:
Click Here
Pricing
- Single User License$ 1,995
- Department License$ 2,400
- Site License$ 3,120
- Global License$ 3,795

Leadership Perspectives from Industry Events
Search
Thought Leadership and Analyst Meet


Our Clients
6WResearch In News
- India Air Conditioner Market Set for Strong Rebound in 2026 After Weather-Led Correction and GST-Driven Recovery: 6Wresearch
- ADAS in India: How Automatic Emergency Braking, Blind Spot Detection & Driver Monitoring are Transforming Road Safety
- Doha a strategic location for EV manufacturing hub: IPA Qatar
- Demand for luxury TVs surging in the GCC, says Samsung
- Empowering Growth: The Thriving Journey of Bangladesh’s Cable Industry
- Demand for luxury TVs surging in the GCC, says Samsung
Latest Reports
- Poland Fire Protection Systems Market (2026-2032)
- Cape Verde Portable Hand-Thrown Extinguisher Market (2026-2032)
- Canada Portable Hand-Thrown Extinguisher Market (2026-2032)
- Cameroon Portable Hand-Thrown Extinguisher Market (2026-2032)
- Burundi Portable Hand-Thrown Extinguisher Market (2026-2032)
- Burkina Faso Portable Hand-Thrown Extinguisher Market (2026-2032)
- Bulgaria Portable Hand-Thrown Extinguisher Market (2026-2032)
- Brunei Portable Hand-Thrown Extinguisher Market (2026-2032)
- Botswana Portable Hand-Thrown Extinguisher Market (2026-2032)
- Bosnia and Herzegovina Portable Hand-Thrown Extinguisher Market (2026-2032)
Industry Events and Analyst Meet

HIMTEX 2026

India Refining Summit 2026

India EV Show 2026

EV tech India Expo 2026

Auto Tech Asia 2026
Whitepaper
- Middle East & Africa Commercial Security Market Click here to view more.
- Middle East & Africa Fire Safety Systems & Equipment Market Click here to view more.
- GCC Drone Market Click here to view more.
- Middle East Lighting Fixture Market Click here to view more.
- GCC Physical & Perimeter Security Market Click here to view more.