Australia Alcohols and Epoxides Market (2026-2032) | Revenue, Outlook, Forecast, Industry, Value, Companies, Share, Analysis, Trends, Growth & Size
Market Forecast By Product Types (Alocohols, Epoxides), By Epoxides (Ethylene Oxide, Propylene Oxide), By Alcohols Type (Ethyl, Denatured, Isopropyl, Rubbing), By Applications (Coated Fabric, Wire & Cable, Flooring & Wall Coverings, Film & Sheet, Medical Devices, Consumer Goods, Others) And Competitive Landscape
| Product Code: ETC028675 | Publication Date: Oct 2020 | Updated Date: Mar 2026 | Product Type: Report | |
| Publisher: 6Wresearch | Author: Ravi Bhandari | No. of Pages: 70 | No. of Figures: 35 | No. of Tables: 5 |
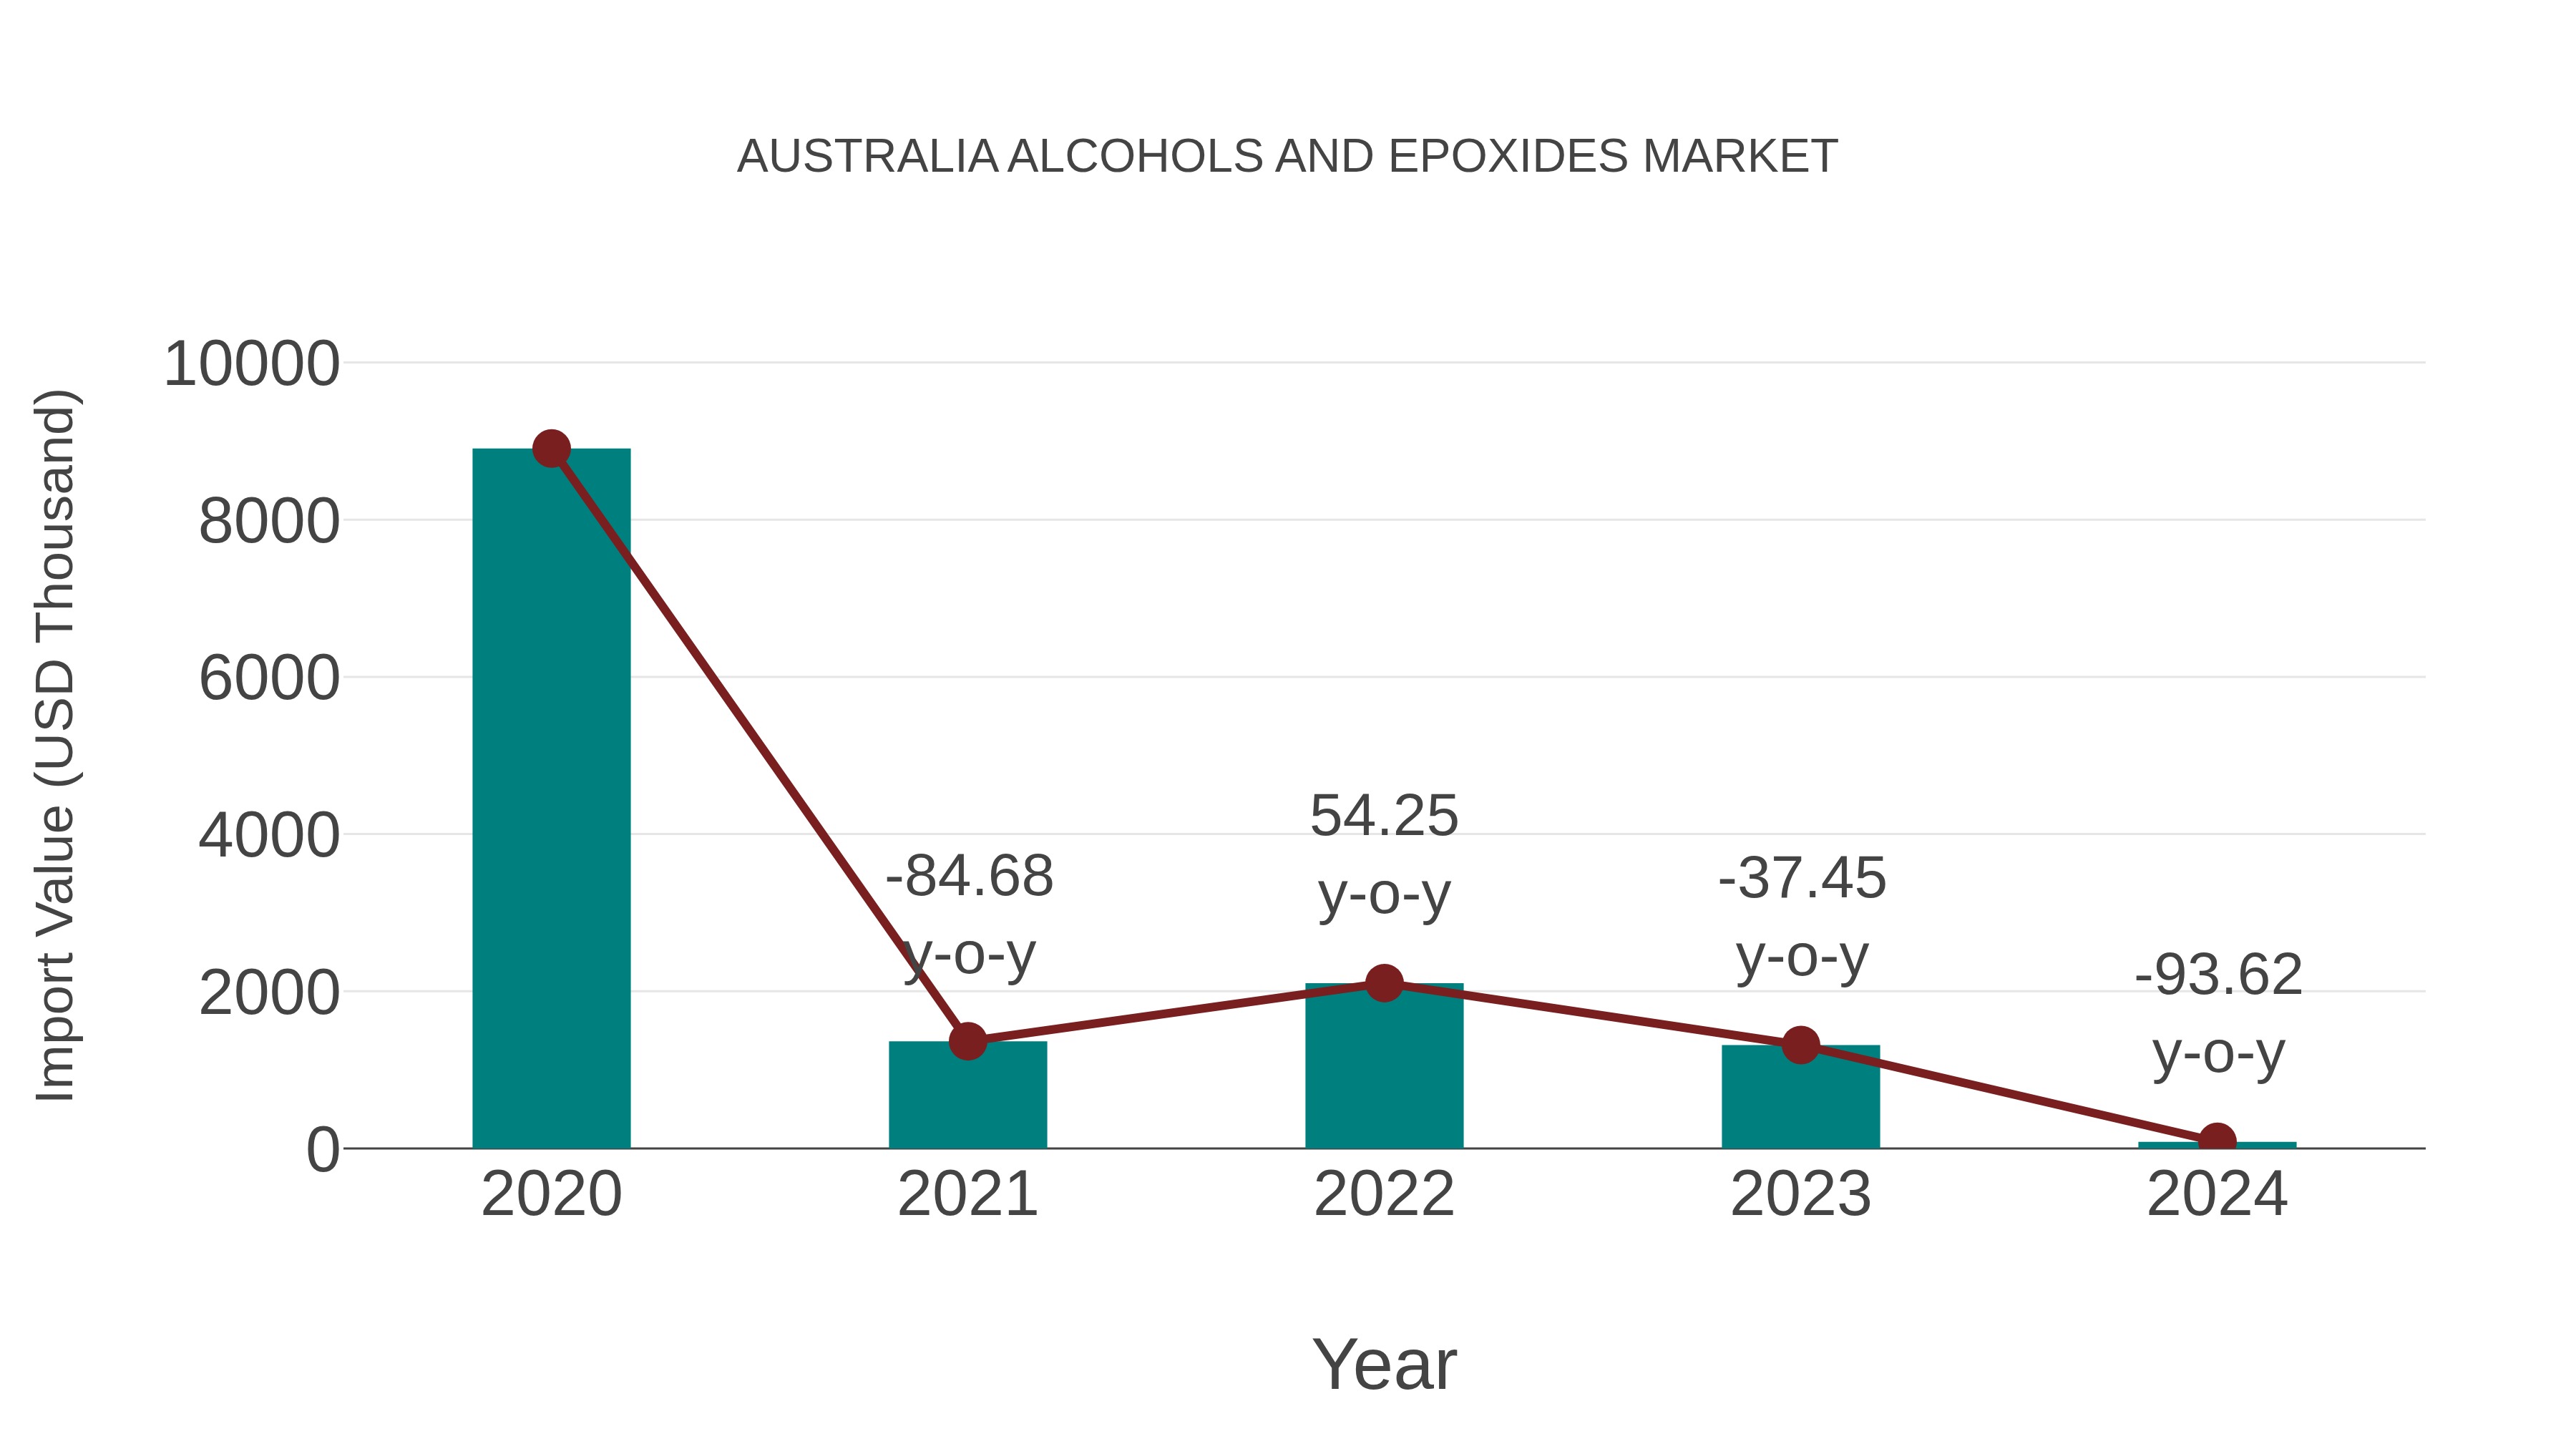
Australia Alcohols and Epoxides Market: Import Trend Analysis
Australia`s import trend for alcohols and epoxides in the market experienced a significant decline from 2023 to 2024, with a growth rate of -93.62%. The compound annual growth rate (CAGR) for the period 2020-2024 stood at -68.84%. This sharp downturn may be attributed to shifting consumer preferences, regulatory changes, or market saturation, impacting import momentum in the sector.
Australia Alcohols and Epoxides Market Overview
The alcohols and epoxides market in Australia supplies a variety of organic compounds used in industrial processes, chemical synthesis, and formulations. These compounds include alcohols, glycols, and epoxides, serving as solvents, intermediates, and raw materials in pharmaceuticals, coatings, adhesives, and personal care products.
Drivers of the market
The Australia alcohols and epoxides market is influenced by several factors, including the expanding industrial sector, advancements in chemical manufacturing processes, and the demand for specialty chemicals in various applications. Alcohol-based compounds are essential in industries such as pharmaceuticals, paints and coatings, and personal care products. Moreover, epoxides find extensive usage as intermediates in the production of polymers, resins, and adhesives. The market growth is further propelled by ongoing research and development activities aimed at enhancing the properties and applications of alcohols and epoxides.
Challenges of the market
Precision and efficiency challenges hinder the development of the Australia ald equipment market. Manufacturers require equipment that can provide precise and uniform deposition of thin films while optimizing process efficiency and yield.
Government Policy of the market
Government policies in the alcohols and epoxides market aim to promote sustainable manufacturing practices and minimize environmental impact. Regulations govern chemical production, emissions, and waste disposal to protect air, water, and soil quality. Additionally, policies encourage research and development of alternative, bio-based feedstocks and processes to reduce dependence on fossil fuels and mitigate climate change.
Key Highlights of the Report:
- Australia Alcohols and Epoxides Market Outlook
- Market Size of Australia Alcohols and Epoxides Market, 2025
- Forecast of Australia Alcohols and Epoxides Market, 2032
- Historical Data and Forecast of Australia Alcohols and Epoxides Revenues & Volume for the Period 2022-2032F
- Australia Alcohols and Epoxides Market Trend Evolution
- Australia Alcohols and Epoxides Market Drivers and Challenges
- Australia Alcohols and Epoxides Price Trends
- Australia Alcohols and Epoxides Porter's Five Forces
- Australia Alcohols and Epoxides Industry Life Cycle
- Historical Data and Forecast of Australia Alcohols and Epoxides Market Revenues & Volume By Product Types for the Period 2022-2032F
- Historical Data and Forecast of Australia Alcohols and Epoxides Market Revenues & Volume By Alocohols for the Period 2022-2032F
- Historical Data and Forecast of Australia Alcohols and Epoxides Market Revenues & Volume By Epoxides for the Period 2022-2032F
- Historical Data and Forecast of Australia Alcohols and Epoxides Market Revenues & Volume By Epoxides for the Period 2022-2032F
- Historical Data and Forecast of Australia Alcohols and Epoxides Market Revenues & Volume By Ethylene Oxide for the Period 2022-2032F
- Historical Data and Forecast of Australia Alcohols and Epoxides Market Revenues & Volume By Propylene Oxide for the Period 2022-2032F
- Historical Data and Forecast of Australia Alcohols and Epoxides Market Revenues & Volume By Alcohols Type for the Period 2022-2032F
- Historical Data and Forecast of Australia Alcohols and Epoxides Market Revenues & Volume By Ethyl for the Period 2022-2032F
- Historical Data and Forecast of Australia Alcohols and Epoxides Market Revenues & Volume By Denatured for the Period 2022-2032F
- Historical Data and Forecast of Australia Alcohols and Epoxides Market Revenues & Volume By Isopropyl? for the Period 2022-2032F
- Historical Data and Forecast of Australia Alcohols and Epoxides Market Revenues & Volume By Rubbing for the Period 2022-2032F
- Historical Data and Forecast of Australia Alcohols and Epoxides Market Revenues & Volume By Applications for the Period 2022-2032F
- Historical Data and Forecast of Australia Alcohols and Epoxides Market Revenues & Volume By Coated Fabric for the Period 2022-2032F
- Historical Data and Forecast of Australia Alcohols and Epoxides Market Revenues & Volume By Wire & Cable for the Period 2022-2032F
- Historical Data and Forecast of Australia Alcohols and Epoxides Market Revenues & Volume By Flooring & Wall Coverings for the Period 2022-2032F
- Historical Data and Forecast of Australia Alcohols and Epoxides Market Revenues & Volume By Film & Sheet for the Period 2022-2032F
- Historical Data and Forecast of Australia Alcohols and Epoxides Market Revenues & Volume By Medical Devices for the Period 2022-2032F
- Historical Data and Forecast of Australia Alcohols and Epoxides Market Revenues & Volume By Consumer Goods for the Period 2022-2032F
- Historical Data and Forecast of Australia Alcohols and Epoxides Market Revenues & Volume By Others for the Period 2022-2032F
- Australia Alcohols and Epoxides Import Export Trade Statistics
- Market Opportunity Assessment By Product Types
- Market Opportunity Assessment By Epoxides
- Market Opportunity Assessment By Alcohols Type
- Market Opportunity Assessment By Applications
- Australia Alcohols and Epoxides Top Companies Market Share
- Australia Alcohols and Epoxides Competitive Benchmarking By Technical and Operational Parameters
- Australia Alcohols and Epoxides Company Profiles
- Australia Alcohols and Epoxides Key Strategic Recommendations
Australia Alcohols and Epoxides Market (2026-2032): FAQs
6Wresearch actively monitors the Australia Alcohols and Epoxides Market and publishes its comprehensive annual report, highlighting emerging trends, growth drivers, revenue analysis, and forecast outlook. Our insights help businesses to make data-backed strategic decisions with ongoing market dynamics. Our analysts track relevent industries related to the Australia Alcohols and Epoxides Market, allowing our clients with actionable intelligence and reliable forecasts tailored to emerging regional needs.
Yes, we provide customisation as per your requirements. To learn more, feel free to contact us on sales@6wresearch.com
1 Executive Summary |
2 Introduction |
2.1 Key Highlights of the Report |
2.2 Report Description |
2.3 Market Scope & Segmentation |
2.4 Research Methodology |
2.5 Assumptions |
3 Australia Alcohols and Epoxides Market Overview |
3.1 Australia Country Macro Economic Indicators |
3.2 Australia Alcohols and Epoxides Market Revenues & Volume, 2022 & 2032F |
3.3 Australia Alcohols and Epoxides Market - Industry Life Cycle |
3.4 Australia Alcohols and Epoxides Market - Porter's Five Forces |
3.5 Australia Alcohols and Epoxides Market Revenues & Volume Share, By Product Types, 2022 & 2032F |
3.6 Australia Alcohols and Epoxides Market Revenues & Volume Share, By Epoxides, 2022 & 2032F |
3.7 Australia Alcohols and Epoxides Market Revenues & Volume Share, By Alcohols Type, 2022 & 2032F |
3.8 Australia Alcohols and Epoxides Market Revenues & Volume Share, By Applications, 2022 & 2032F |
4 Australia Alcohols and Epoxides Market Dynamics |
4.1 Impact Analysis |
4.2 Market Drivers |
4.2.1 Increasing demand for bio-based alcohols and epoxides due to sustainability efforts and environmental regulations |
4.2.2 Growing applications of alcohols and epoxides in industries such as pharmaceuticals, cosmetics, and automotive |
4.2.3 Technological advancements leading to the development of innovative and high-performance alcohols and epoxides |
4.3 Market Restraints |
4.3.1 Fluctuating prices of raw materials impacting production costs |
4.3.2 Stringent regulations related to the usage and disposal of certain types of alcohols and epoxides |
4.3.3 Intense competition from alternative chemicals and materials |
5 Australia Alcohols and Epoxides Market Trends |
6 Australia Alcohols and Epoxides Market, By Types |
6.1 Australia Alcohols and Epoxides Market, By Product Types |
6.1.1 Overview and Analysis |
6.1.2 Australia Alcohols and Epoxides Market Revenues & Volume, By Product Types, 2022-2032F |
6.1.3 Australia Alcohols and Epoxides Market Revenues & Volume, By Alocohols, 2022-2032F |
6.1.4 Australia Alcohols and Epoxides Market Revenues & Volume, By Epoxides, 2022-2032F |
6.2 Australia Alcohols and Epoxides Market, By Epoxides |
6.2.1 Overview and Analysis |
6.2.2 Australia Alcohols and Epoxides Market Revenues & Volume, By Ethylene Oxide, 2022-2032F |
6.2.3 Australia Alcohols and Epoxides Market Revenues & Volume, By Propylene Oxide, 2022-2032F |
6.3 Australia Alcohols and Epoxides Market, By Alcohols Type |
6.3.1 Overview and Analysis |
6.3.2 Australia Alcohols and Epoxides Market Revenues & Volume, By Ethyl, 2022-2032F |
6.3.3 Australia Alcohols and Epoxides Market Revenues & Volume, By Denatured, 2022-2032F |
6.3.4 Australia Alcohols and Epoxides Market Revenues & Volume, By Isopropyl , 2022-2032F |
6.3.5 Australia Alcohols and Epoxides Market Revenues & Volume, By Rubbing, 2022-2032F |
6.4 Australia Alcohols and Epoxides Market, By Applications |
6.4.1 Overview and Analysis |
6.4.2 Australia Alcohols and Epoxides Market Revenues & Volume, By Coated Fabric, 2022-2032F |
6.4.3 Australia Alcohols and Epoxides Market Revenues & Volume, By Wire & Cable, 2022-2032F |
6.4.4 Australia Alcohols and Epoxides Market Revenues & Volume, By Flooring & Wall Coverings, 2022-2032F |
6.4.5 Australia Alcohols and Epoxides Market Revenues & Volume, By Film & Sheet, 2022-2032F |
6.4.6 Australia Alcohols and Epoxides Market Revenues & Volume, By Medical Devices, 2022-2032F |
6.4.7 Australia Alcohols and Epoxides Market Revenues & Volume, By Consumer Goods, 2022-2032F |
7 Australia Alcohols and Epoxides Market Import-Export Trade Statistics |
7.1 Australia Alcohols and Epoxides Market Export to Major Countries |
7.2 Australia Alcohols and Epoxides Market Imports from Major Countries |
8 Australia Alcohols and Epoxides Market Key Performance Indicators |
8.1 Research and development investment in new product development and process improvements |
8.2 Adoption rates of bio-based alcohols and epoxides in key industries |
8.3 Number of patents filed for novel alcohols and epoxides formulations |
8.4 Environmental impact assessments and certifications for sustainable production practices |
8.5 Customer satisfaction levels and feedback on product quality and performance |
9 Australia Alcohols and Epoxides Market - Opportunity Assessment |
9.1 Australia Alcohols and Epoxides Market Opportunity Assessment, By Product Types, 2022 & 2032F |
9.2 Australia Alcohols and Epoxides Market Opportunity Assessment, By Epoxides, 2022 & 2032F |
9.3 Australia Alcohols and Epoxides Market Opportunity Assessment, By Alcohols Type, 2022 & 2032F |
9.4 Australia Alcohols and Epoxides Market Opportunity Assessment, By Applications, 2022 & 2032F |
10 Australia Alcohols and Epoxides Market - Competitive Landscape |
10.1 Australia Alcohols and Epoxides Market Revenue Share, By Companies, 2025 |
10.2 Australia Alcohols and Epoxides Market Competitive Benchmarking, By Operating and Technical Parameters |
11 Company Profiles |
12 Recommendations |
13 Disclaimer |
Global Go To Market Strategy - 2030
Export potential enables firms to identify high-growth global markets with greater confidence by combining advanced trade intelligence with a structured quantitative methodology. The framework analyzes emerging demand trends and country-level import patterns while integrating macroeconomic and trade datasets such as GDP and population forecasts, bilateral import–export flows, tariff structures, elasticity differentials between developed and developing economies, geographic distance, and import demand projections. Using weighted trade values from 2020–2024 as the base period to project country-to-country export potential for 2030, these inputs are operationalized through calculated drivers such as gravity model parameters, tariff impact factors, and projected GDP per-capita growth. Through an analysis of hidden potentials, demand hotspots, and market conditions that are most favorable to success, this method enables firms to focus on target countries, maximize returns, and global expansion with data, backed by accuracy.
By factoring in the projected importer demand gap that is currently unmet and could be potential opportunity, it identifies the potential for the Exporter (Country) among 190 countries, against the general trade analysis, which identifies the biggest importer or exporter.
To discover high-growth global markets and optimize your business strategy:
Click Here
Pricing
- Single User License$ 1,995
- Department License$ 2,400
- Site License$ 3,120
- Global License$ 3,795

Leadership Perspectives from Industry Events
Search
Thought Leadership and Analyst Meet


Our Clients
6WResearch In News
- India Air Conditioner Market Set for Strong Rebound in 2026 After Weather-Led Correction and GST-Driven Recovery: 6Wresearch
- ADAS in India: How Automatic Emergency Braking, Blind Spot Detection & Driver Monitoring are Transforming Road Safety
- Doha a strategic location for EV manufacturing hub: IPA Qatar
- Demand for luxury TVs surging in the GCC, says Samsung
- Empowering Growth: The Thriving Journey of Bangladesh’s Cable Industry
- Demand for luxury TVs surging in the GCC, says Samsung
Latest Reports
- Nicaragua RPG Gaming Market (2026-2032)
- New Zealand RPG Gaming Market (2026-2032)
- Netherlands RPG Gaming Market (2026-2032)
- Nauru RPG Gaming Market (2026-2032)
- Namibia RPG Gaming Market (2026-2032)
- Mozambique RPG Gaming Market (2026-2032)
- Montenegro RPG Gaming Market (2026-2032)
- Mongolia RPG Gaming Market (2026-2032)
- Monaco RPG Gaming Market (2026-2032)
- Micronesia RPG Gaming Market (2026-2032)
Industry Events and Analyst Meet

EV India Expo 2026

HIMTEX 2026

India Refining Summit 2026

India EV Show 2026

EV tech India Expo 2026
Whitepaper
- Middle East & Africa Commercial Security Market Click here to view more.
- Middle East & Africa Fire Safety Systems & Equipment Market Click here to view more.
- GCC Drone Market Click here to view more.
- Middle East Lighting Fixture Market Click here to view more.
- GCC Physical & Perimeter Security Market Click here to view more.