Australia Antimony Market (2026-2032) Outlook | Industry, Size, Revenue, Trends, Analysis, Value, Forecast, Share, Growth & Companies
Market Forecast By Type (Metal Ingot, Antimony Trioxide, Antimony Pentoxide, Alloys, Other), By Application (Flame Retardant, Lead Acid Batteries, Alloy Strengthening Agent, Fiberglass Composites, Catalyst, Other) And Competitive Landscape
| Product Code: ETC087054 | Publication Date: Jun 2021 | Updated Date: Jun 2026 | Product Type: Report | |
| Publisher: 6Wresearch | Author: Ravi Bhandari | No. of Pages: 70 | No. of Figures: 35 | No. of Tables: 5 |
Australia Antimony Market Size, Share & Growth Rate
The Australia Antimony Market was estimated at USD 103 Million in 2025 and is projected to reach USD 120 Million by 2032, growing at a CAGR of 2.2% from 2026 to 2032. This growth trajectory is largely propelled by the increasing industrial applications of antimony, particularly in flame retardants and lead-acid batteries. As construction and automotive sectors expand, the demand for high-quality antimony products is set to rise significantly, establishing a solid foundation for sustained market growth.
Australia Antimony Market Growth Rate Analysis (2021-2032)
The Australian antimony market has experienced a notable rebound following a decline of 0.9% in 2021. This shift was catalyzed by increased demand from the electronics and battery sectors, with growth jumping to 5.7% in 2022 and sustaining at 4.7% in 2023. Factors such as rising consumer demand for energy-efficient products and investments in technological advancements have significantly influenced this upward trend. While future growth rates are expected to settle around 2.5% to 2.8% from 2024 to 2028, fluctuations reflect ongoing regulatory support for sustainable mining practices and a focus on energy transition efforts in Australia. By 2032, the market is projected to witness a 3.2% increase, driven by further innovation and infrastructure improvements.
Australia Antimony Market Year-wise Growth Rate and Key Drivers
This graph highlights how the Australia Antimony Market has steadily grown over the past five years, supported by major growth factors.
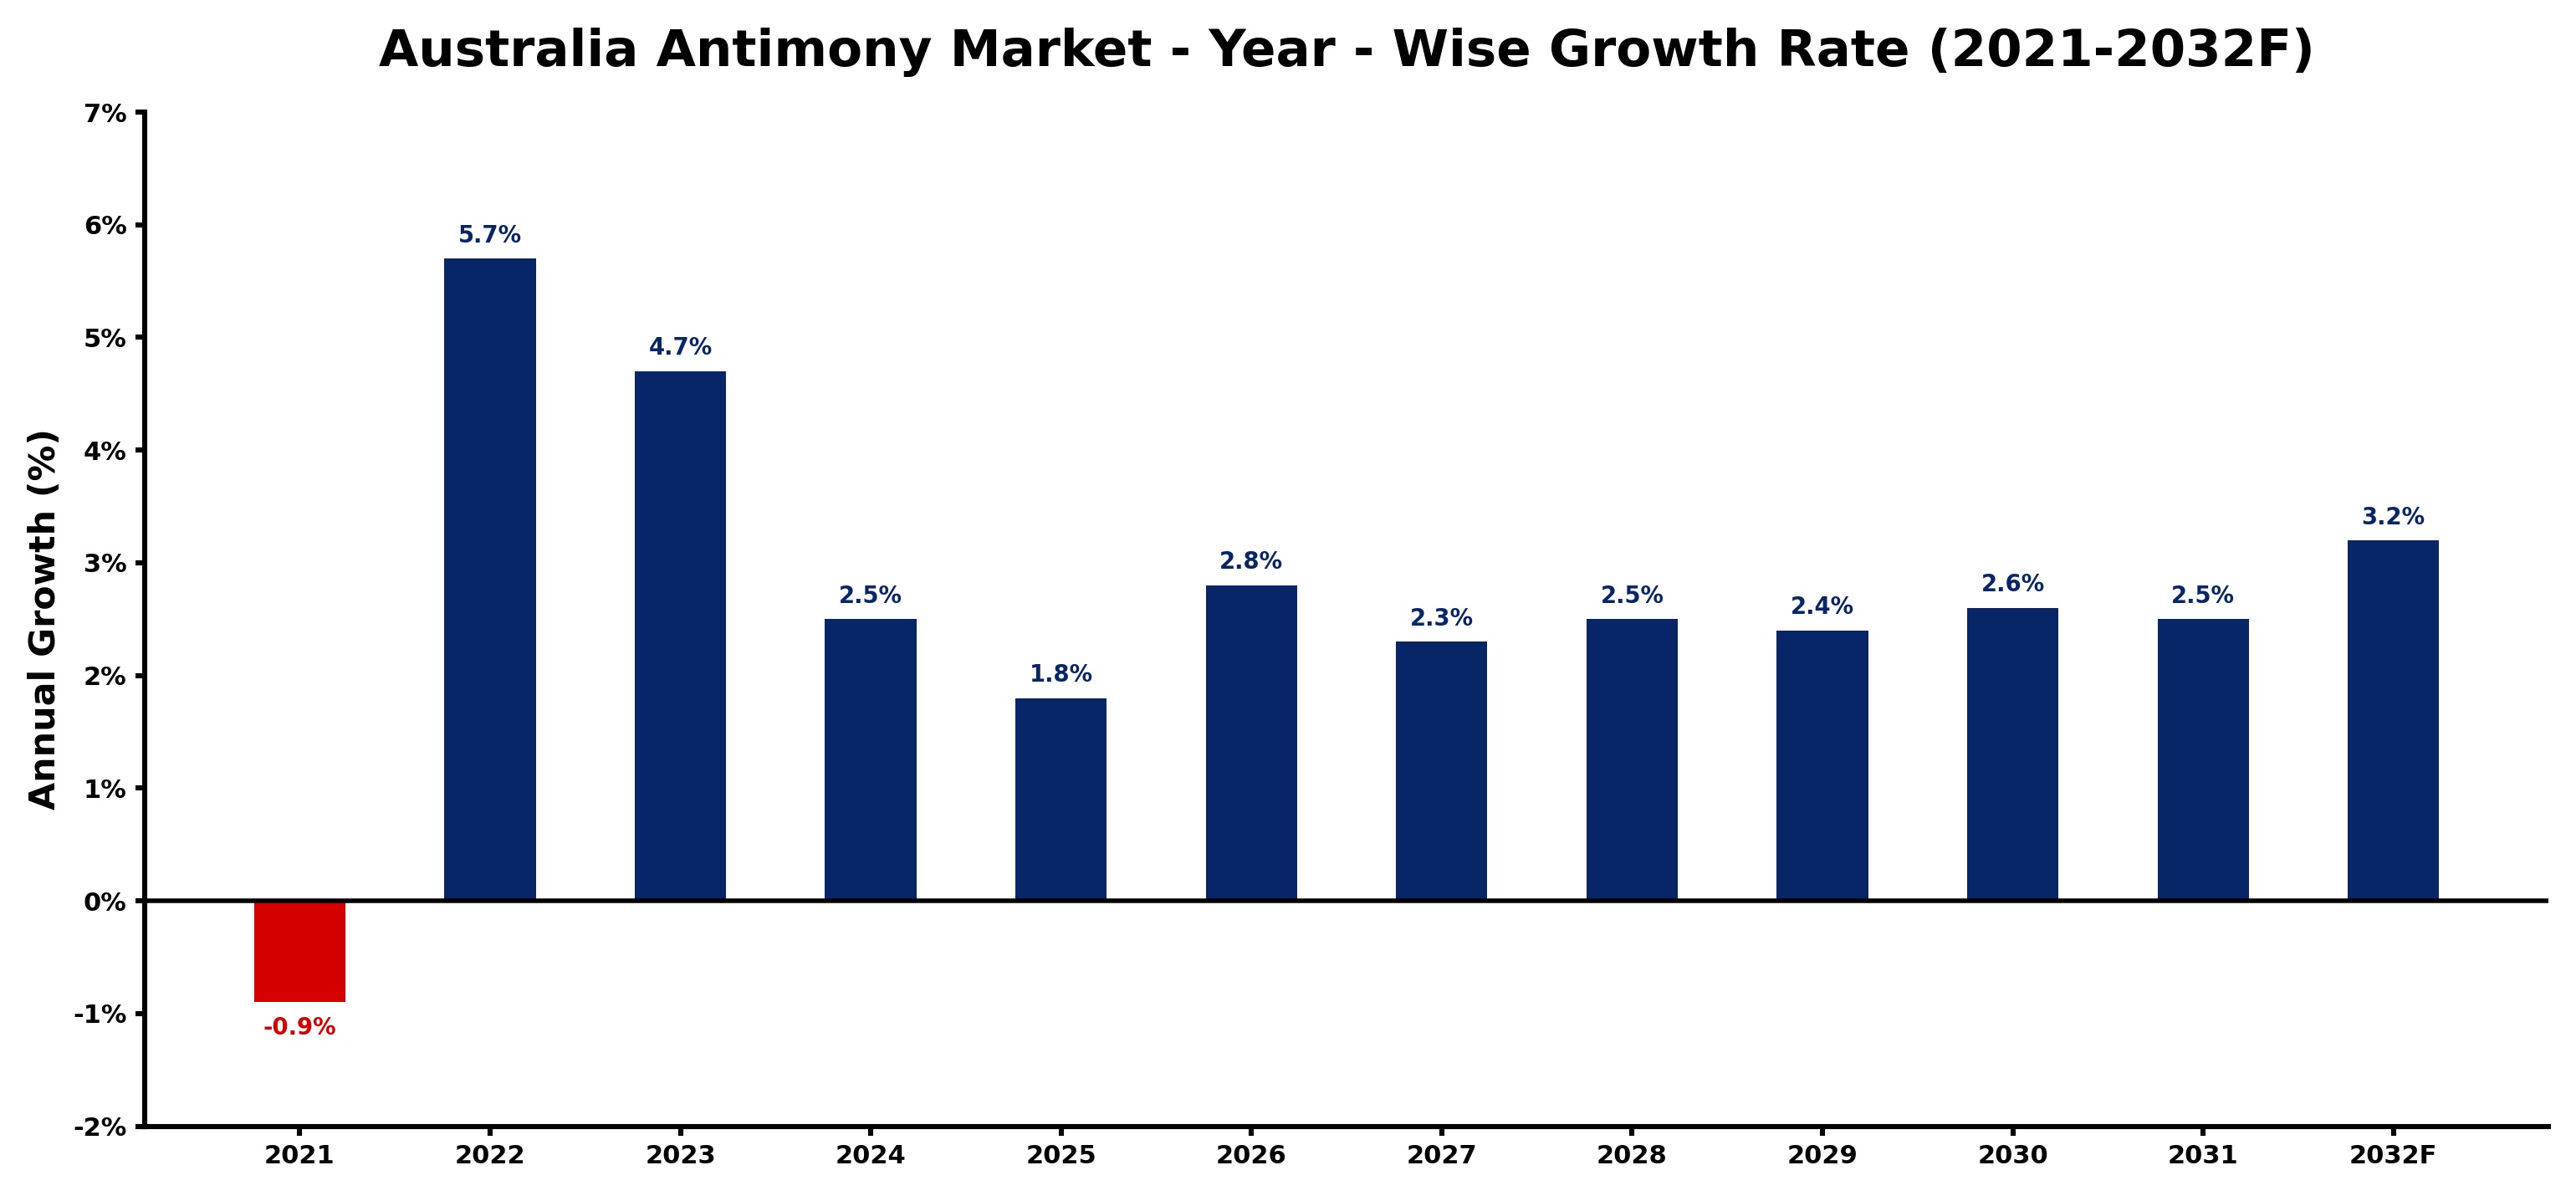
The table below presents the year‑wise growth rates along with the key drivers influencing the market
| Year | Growth Rate | Major Drivers |
| 2021 | -0.9% | Growing renewable energy integration projects |
| 2022 | 5.7% | Expansion of manufacturing activities |
| 2023 | 4.7% | Rapid growth in telecom and data center sectors |
| 2024 | 2.5% | Increasing industrial automation investments |
| 2025 | 1.8% | Growing urbanization and commercial development |
| 2026 | 2.8% | Expansion of manufacturing activities |
| 2027 | 2.3% | Expansion of commercial construction activities |
| 2028 | 2.5% | Expansion of commercial construction activities |
| 2029 | 2.4% | Expansion of commercial construction activities |
| 2030 | 2.6% | Growing renewable energy integration projects |
| 2031 | 2.5% | Rapid growth in telecom and data center sectors |
| 2032 | 3.2% | Expansion of manufacturing activities |
Note - Market size estimations and growth projections presented in this report are based on 6Wresearch’s advanced forecasting approach, validated with industry datasets as of June 2026.
Australia Antimony Market Synopsis
Currently, Australia’s antimony market is experiencing a dynamic shift, driven by heightened awareness surrounding fire safety and energy storage solutions. The unique properties of antimony make it invaluable across various applications, establishing a firm foothold in the electronics and construction industries.
Ongoing advancements in mining techniques and processing technologies are further contributing to market stability. With a focus on sustainable practices and regulatory compliance, the industry is adapting to meet the demands of both consumers and governmental standards.
Australia Antimony Market Key Takeaways
- The market is driven by rising demand for flame retardants, particularly in construction and electronics.
- Technological advancements in processing are improving production efficiency and product quality.
- Regulatory compliance is a key concern, influencing operational practices in antimony mining.
- Environmental and geopolitical factors are crucial considerations affecting market dynamics.
- Investment opportunities are increasing as global demand for antimony products grows.
Evaluation of Restraints in Australia Antimony Market
The Australia antimony market faces notable restraints that may hinder its progress. Fluctuations in global metal prices can disrupt production planning and investment in new technologies. Moreover, environmental regulations require stringent compliance, which may limit operational flexibility for producers. Additionally, geopolitical factors can pose risks to supply chains, potentially leading to delays in product availability and increased costs. Addressing these challenges is imperative for market participants to maintain stability and foster growth.
Australia Antimony Market Trends
Emerging trends in the Australia antimony market highlight a shift towards sustainability and innovation. There is a growing focus on recycling and resource recovery, as businesses seek to minimize waste and promote circular economy practices. Furthermore, advancements in flame retardant formulations are driving demand for higher purity antimony products, enhancing performance in critical applications. These trends are not just reshaping product offerings but also influencing investment strategies in the sector.
Australia Antimony Market Opportunities
The potential for growth within the Australia antimony market is significant, particularly in sectors emphasizing fire safety and energy efficiency. With an increase in infrastructure projects, there lies an opportunity for antimony products to enhance safety standards. Additionally, the expanding electric vehicle market presents avenues for antimony use in battery applications, tapping into a rapidly growing consumer base that prioritizes energy storage solutions.
Government Initiatives in the Australia Antimony Market
Australian government initiatives are focused on fostering sustainable mining practices while addressing environmental impacts. Policies support responsible resource development, promoting occupational safety and community engagement. Regulatory frameworks ensure that mining operations adhere to strict environmental assessments, waste management protocols, and sustainable extraction methodologies, facilitating a balanced approach to resource utilization and environmental conservation.
Future Insights of the Australia Antimony Market
Looking ahead to 2026-2032, the Australia antimony market is poised for steady advancement, with an optimistic outlook for technological innovation and regulatory compliance. As consumer preferences evolve, companies will likely invest in enhancing product quality and sustainability. The interplay between domestic production and global demand dynamics will further define the competitive landscape, driving players to adapt strategically to market shifts while focusing on growth opportunities.
Australia Antimony Market Latest Developments (May 2025 - June 2026)
Recent developments in the Australia antimony market indicate a strategic pivot towards enhanced recycling processes and sustainable practices. Industry stakeholders are increasingly prioritizing regulatory compliance and environmental stewardship, fostering innovation in product development. Furthermore, discussions surrounding investment in infrastructure projects have heightened, signaling a collective commitment to driving growth while addressing safety concerns in fire risk management.
Australia Antimony Market - Key Attractiveness of the Report
- 10 Years of Market Numbers
- Historical Data Starting from 2022 to 2025
- Base Year: 2025
- Forecast Data until 2032
- Key Performance Indicators Impacting the Market
- Major Upcoming Developments and Projects
Key Highlights of the Report:
- Australia Antimony Market Outlook
- Market Size of Australia Antimony Market, 2025
- Forecast of Australia Antimony Market, 2032
- Historical Data and Forecast of Australia Antimony Revenues & Volume for the Period 2022-2032F
- Australia Antimony Market Trend Evolution
- Australia Antimony Market Drivers and Challenges
- Australia Antimony Price Trends
- Australia Antimony Porter's Five Forces
- Australia Antimony Industry Life Cycle
- Historical Data and Forecast of Australia Antimony Market Revenues & Volume By Type for the Period 2022-2032F
- Historical Data and Forecast of Australia Antimony Market Revenues & Volume By Metal Ingot for the Period 2022-2032F
- Historical Data and Forecast of Australia Antimony Market Revenues & Volume By Antimony Trioxide for the Period 2022-2032F
- Historical Data and Forecast of Australia Antimony Market Revenues & Volume By Antimony Pentoxide for the Period 2022-2032F
- Historical Data and Forecast of Australia Antimony Market Revenues & Volume By Alloys for the Period 2022-2032F
- Historical Data and Forecast of Australia Antimony Market Revenues & Volume By Other for the Period 2022-2032F
- Historical Data and Forecast of Australia Antimony Market Revenues & Volume By Application for the Period 2022-2032F
- Historical Data and Forecast of Australia Antimony Market Revenues & Volume By Flame Retardant for the Period 2022-2032F
- Historical Data and Forecast of Australia Antimony Market Revenues & Volume By Lead Acid Batteries for the Period 2022-2032F
- Historical Data and Forecast of Australia Antimony Market Revenues & Volume By Alloy Strengthening Agent for the Period 2022-2032F
- Historical Data and Forecast of Australia Antimony Market Revenues & Volume By Fiberglass Composites for the Period 2022-2032F
- Historical Data and Forecast of Australia Antimony Market Revenues & Volume By Catalyst for the Period 2022-2032F
- Historical Data and Forecast of Australia Antimony Market Revenues & Volume By Other for the Period 2022-2032F
- Australia Antimony Import Export Trade Statistics
- Market Opportunity Assessment By Type
- Market Opportunity Assessment By Application
- Australia Antimony Top Companies Market Share
- Australia Antimony Competitive Benchmarking By Technical and Operational Parameters
- Australia Antimony Company Profiles
- Australia Antimony Key Strategic Recommendations
Australia Antimony Market - Frequently Asked Questions
The Australia Antimony Market is projected to grow at a CAGR of 2.2% from 2026 to 2032, reaching USD 120 Million by 2032.
Stricter environmental regulations are prompting manufacturers to adopt sustainable mining and processing practices, thereby influencing demand for high-quality, compliant antimony products.
Antimony is crucial in electronics as it enhances the fire retardancy and durability of components, thus improving safety and longevity in electronic devices.
The construction, automotive, and electronics sectors are major drivers, with increasing requirements for flame retardants and energy-efficient solutions.
Antimony producers grapple with market volatility, environmental concerns, and fluctuating global demand, necessitating strategic management of resources and compliance with regulations.
6Wresearch actively monitors the Australia Antimony Market and publishes its comprehensive annual report, highlighting emerging trends, growth drivers, revenue analysis, and forecast outlook. Our insights help businesses to make data-backed strategic decisions with ongoing market dynamics. Our analysts track relevent industries related to the Australia Antimony Market, allowing our clients with actionable intelligence and reliable forecasts tailored to emerging regional needs.
Yes, we provide customisation as per your requirements. To learn more, feel free to contact us on sales@6wresearch.com
1 Executive Summary |
2 Introduction |
2.1 Key Highlights of the Report |
2.2 Report Description |
2.3 Market Scope & Segmentation |
2.4 Research Methodology |
2.5 Assumptions |
3 Australia Antimony Market Overview |
3.1 Australia Country Macro Economic Indicators |
3.2 Australia Antimony Market Revenues & Volume, 2022 & 2032F |
3.3 Australia Antimony Market - Industry Life Cycle |
3.4 Australia Antimony Market - Porter's Five Forces |
3.5 Australia Antimony Market Revenues & Volume Share, By Type, 2022 & 2032F |
3.6 Australia Antimony Market Revenues & Volume Share, By Form, 2022 & 2032F |
4 Australia Antimony Market Dynamics |
4.1 Impact Analysis |
4.2 Market Drivers |
4.2.1 Increasing demand for antimony in flame retardants, batteries, and ceramics industries |
4.2.2 Growing awareness about the unique properties of antimony in various applications |
4.2.3 Rising investments in mining and processing technologies for antimony extraction |
4.3 Market Restraints |
4.3.1 Fluctuating prices of antimony in the global market |
4.3.2 Environmental concerns related to antimony mining and processing activities |
4.3.3 Competition from substitute materials like bismuth and lead in certain applications |
5 Australia Antimony Market Trends |
6 Australia Antimony Market, By Types |
6.1 Australia Antimony Market, By Type |
6.1.1 Overview and Analysis |
6.1.2 Australia Antimony Market Revenues & Volume, By Type, 2022-2032F |
6.1.3 Australia Antimony Market Revenues & Volume, By Metal Ingot, 2022-2032F |
6.1.4 Australia Antimony Market Revenues & Volume, By Antimony Trioxide, 2022-2032F |
6.1.5 Australia Antimony Market Revenues & Volume, By Antimony Pentoxide, 2022-2032F |
6.1.6 Australia Antimony Market Revenues & Volume, By Alloys, 2022-2032F |
6.1.7 Australia Antimony Market Revenues & Volume, By Other, 2022-2032F |
6.2 Australia Antimony Market, By Application |
6.2.1 Overview and Analysis |
6.2.2 Australia Antimony Market Revenues & Volume, By Flame Retardant, 2022-2032F |
6.2.3 Australia Antimony Market Revenues & Volume, By Lead Acid Batteries, 2022-2032F |
6.2.4 Australia Antimony Market Revenues & Volume, By Alloy Strengthening Agent, 2022-2032F |
6.2.5 Australia Antimony Market Revenues & Volume, By Fiberglass Composites, 2022-2032F |
6.2.6 Australia Antimony Market Revenues & Volume, By Catalyst, 2022-2032F |
6.2.7 Australia Antimony Market Revenues & Volume, By Other, 2022-2032F |
7 Australia Antimony Market Import-Export Trade Statistics |
7.1 Australia Antimony Market Export to Major Countries |
7.2 Australia Antimony Market Imports from Major Countries |
8 Australia Antimony Market Key Performance Indicators |
8.1 Exploration and development of new antimony deposits in Australia |
8.2 Adoption of advanced extraction and refining technologies for antimony production |
8.3 Regulatory compliance and sustainability initiatives in the antimony mining sector |
9 Australia Antimony Market - Opportunity Assessment |
9.1 Australia Antimony Market Opportunity Assessment, By Type, 2022 & 2032F |
9.2 Australia Antimony Market Opportunity Assessment, By Application, 2022 & 2032F |
10 Australia Antimony Market - Competitive Landscape |
10.1 Australia Antimony Market Revenue Share, By Companies, 2025 |
10.2 Australia Antimony Market Competitive Benchmarking, By Operating and Technical Parameters |
11 Company Profiles |
12 Recommendations |
13 Disclaimer |
Global Go To Market Strategy - 2030
Export potential enables firms to identify high-growth global markets with greater confidence by combining advanced trade intelligence with a structured quantitative methodology. The framework analyzes emerging demand trends and country-level import patterns while integrating macroeconomic and trade datasets such as GDP and population forecasts, bilateral import–export flows, tariff structures, elasticity differentials between developed and developing economies, geographic distance, and import demand projections. Using weighted trade values from 2020–2024 as the base period to project country-to-country export potential for 2030, these inputs are operationalized through calculated drivers such as gravity model parameters, tariff impact factors, and projected GDP per-capita growth. Through an analysis of hidden potentials, demand hotspots, and market conditions that are most favorable to success, this method enables firms to focus on target countries, maximize returns, and global expansion with data, backed by accuracy.
By factoring in the projected importer demand gap that is currently unmet and could be potential opportunity, it identifies the potential for the Exporter (Country) among 190 countries, against the general trade analysis, which identifies the biggest importer or exporter.
To discover high-growth global markets and optimize your business strategy:
Click Here
Pricing
- Single User License$ 1,995
- Department License$ 2,400
- Site License$ 3,120
- Global License$ 3,795

Leadership Perspectives from Industry Events
Search
Thought Leadership and Analyst Meet


Our Clients
6WResearch In News
- India Air Conditioner Market Set for Strong Rebound in 2026 After Weather-Led Correction and GST-Driven Recovery: 6Wresearch
- ADAS in India: How Automatic Emergency Braking, Blind Spot Detection & Driver Monitoring are Transforming Road Safety
- Doha a strategic location for EV manufacturing hub: IPA Qatar
- Demand for luxury TVs surging in the GCC, says Samsung
- Empowering Growth: The Thriving Journey of Bangladesh’s Cable Industry
- Demand for luxury TVs surging in the GCC, says Samsung
Latest Reports
- Poland Fire Protection Systems Market (2026-2032)
- Cape Verde Portable Hand-Thrown Extinguisher Market (2026-2032)
- Canada Portable Hand-Thrown Extinguisher Market (2026-2032)
- Cameroon Portable Hand-Thrown Extinguisher Market (2026-2032)
- Burundi Portable Hand-Thrown Extinguisher Market (2026-2032)
- Burkina Faso Portable Hand-Thrown Extinguisher Market (2026-2032)
- Bulgaria Portable Hand-Thrown Extinguisher Market (2026-2032)
- Brunei Portable Hand-Thrown Extinguisher Market (2026-2032)
- Botswana Portable Hand-Thrown Extinguisher Market (2026-2032)
- Bosnia and Herzegovina Portable Hand-Thrown Extinguisher Market (2026-2032)
Industry Events and Analyst Meet

HIMTEX 2026

India Refining Summit 2026

India EV Show 2026

EV tech India Expo 2026

Auto Tech Asia 2026
Whitepaper
- Middle East & Africa Commercial Security Market Click here to view more.
- Middle East & Africa Fire Safety Systems & Equipment Market Click here to view more.
- GCC Drone Market Click here to view more.
- Middle East Lighting Fixture Market Click here to view more.
- GCC Physical & Perimeter Security Market Click here to view more.