Australia Cable Cars & Ropeways Market (2026-2032) Outlook | Share, Industry, Revenue, Trends, Value, Growth, Forecast, Analysis, Companies & Size
Market Forecast By Type (Tourism, Material handling, Public transportation, Mining industries), By Sales Channel (OEM (Original Equipment Manufacturer), Aftermarket) And Competitive Landscape
| Product Code: ETC285395 | Publication Date: Aug 2022 | Updated Date: Jul 2026 | Product Type: Market Research Report | |
| Publisher: 6Wresearch | Author: Ravi Bhandari | No. of Pages: 75 | No. of Figures: 35 | No. of Tables: 20 |
Australia Cable Cars & Ropeways Market Size, Share & Growth Rate
The Australia Cable Cars & Ropeways Market was estimated at USD 163 Million in 2025 and is projected to reach USD 191 Million by 2032, growing at a CAGR of 2.3% from 2026 to 2032. This growth trajectory is primarily driven by the flourishing tourism sector, which increasingly relies on cable car systems to provide breathtaking views and access to otherwise remote scenic areas. Coupled with urbanization trends, the demand for efficient transportation solutions in metropolitan regions further solidifies the market's positive outlook.
Australia Cable Cars & Ropeways Market Year-wise Growth Rate and Key Drivers
This graph highlights how the Australia Cable Cars & Ropeways Market has steadily grown over the years, supported by major growth factors.
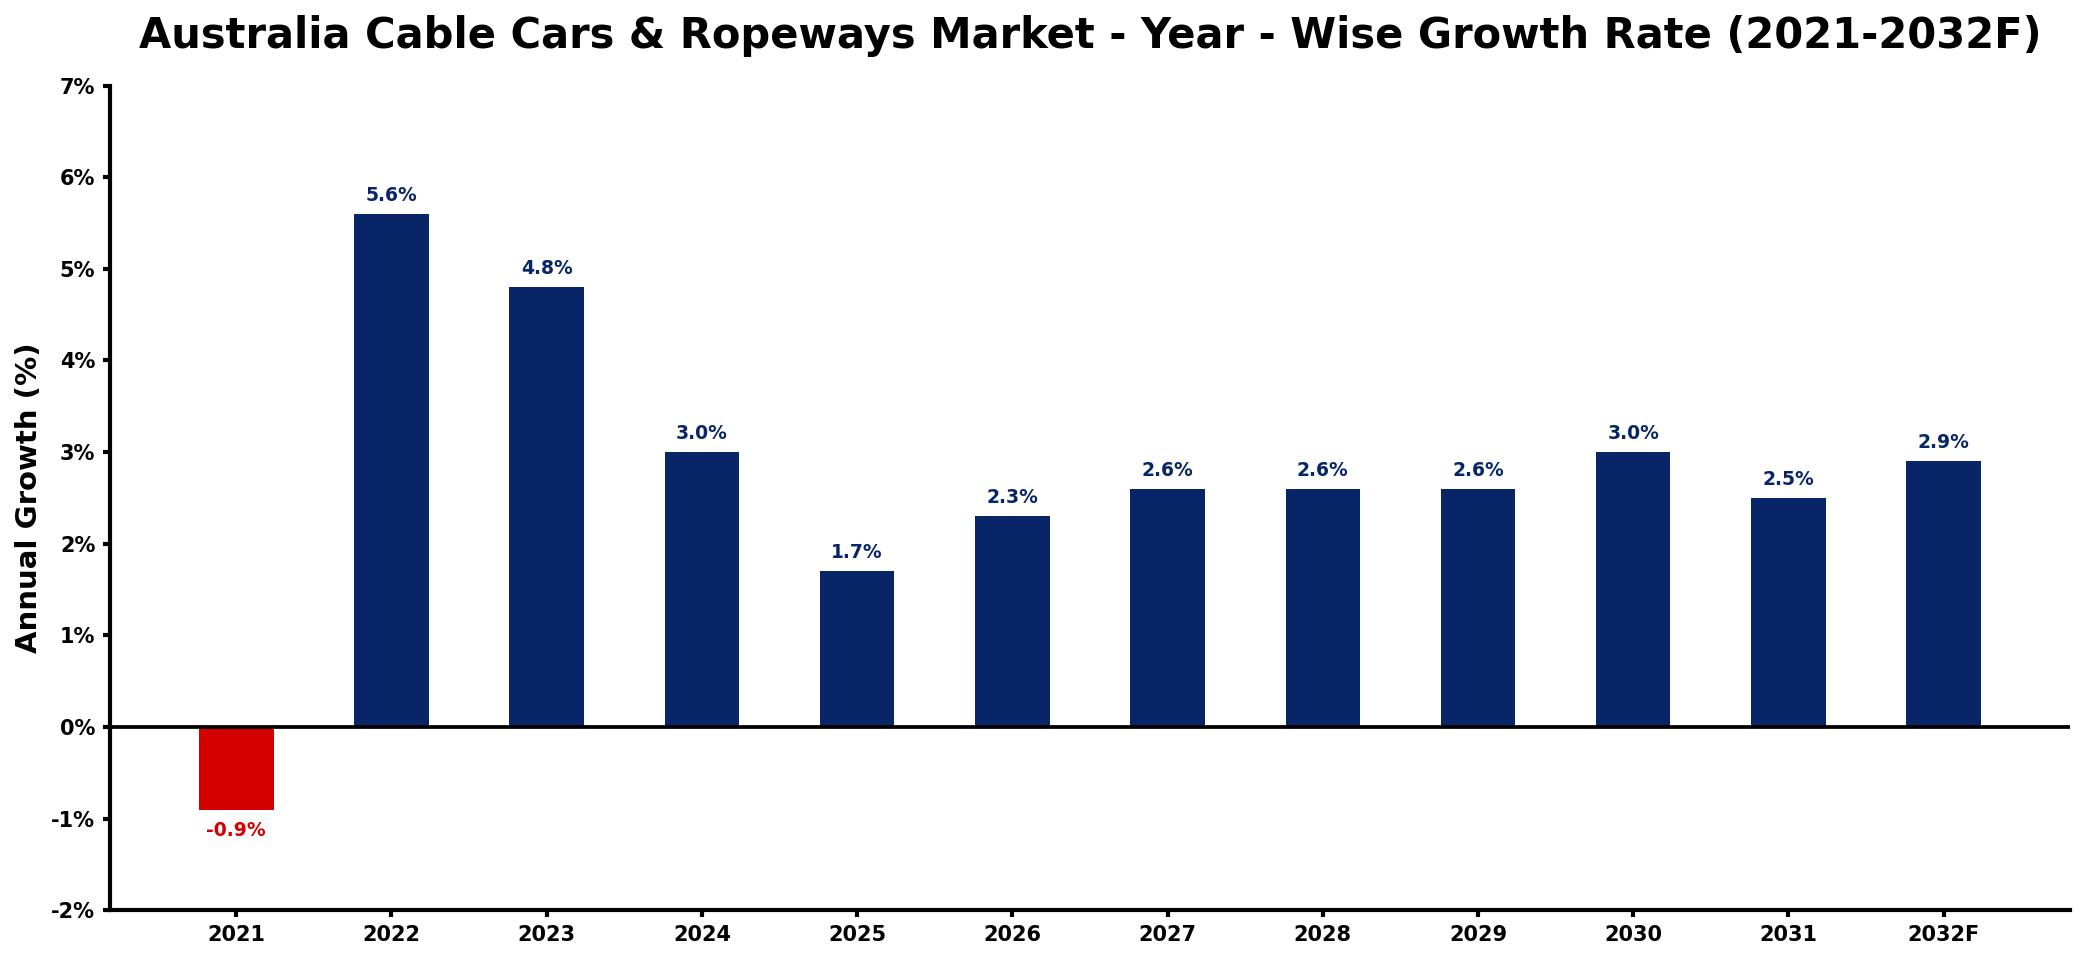
The table below presents the year‑wise growth rates along with the key drivers influencing the market
| Year | Growth Rate | Major Drivers |
| 2021 | -0.9% | decrease in tourism activities |
| 2022 | 5.6% | increased investment in tourism |
| 2023 | 4.8% | growing urban development projects |
| 2024 | 3.0% | rising demand for leisure activities |
| 2025 | 1.7% | enhanced infrastructure funding initiatives |
| 2026 | 2.3% | expansion of adventure tourism sector |
| 2027 | 2.6% | increased environmental sustainability focus |
| 2028 | 2.6% | growth in local tourism partnerships |
| 2029 | 2.6% | higher consumer spending trends |
| 2030 | 3.0% | technological advancements in transport |
| 2031 | 2.5% | expanding industrial usage applications |
| 2032 | 2.9% | increased government tourism support |
Note: Market size estimations and growth projections presented in this report are based on 6Wresearch's proprietary forecasting methodology, utilizing the latest available industry data, government publications, and primary research inputs.
Australia Cable Cars & Ropeways Market Synopsis
Recent momentum in the Australia Cable Cars & Ropeways Market has been bolstered by rising tourist footfall in iconic locations, bringing renewed interest and investment in cable car projects. Looking ahead, the market is expected to benefit from advancements in technology that enhance safety and eco-friendliness, alongside increasing urban infrastructure projects that incorporate cable systems as viable solutions for congestion and accessibility.
However, while the landscape remains promising, manufacturers must navigate ongoing challenges, including compliance with stringent safety regulations and the need for consistent maintenance. As infrastructure development initiatives continue to evolve, the sector must remain agile to adapt to shifting consumer preferences and expectations.
- Significant market growth driven by tourism and urban development.
- Technological advancements are enhancing safety and environmental performance.
- Government initiatives are crucial in promoting new cable car projects.
- Infrastructure investment remains a critical factor affecting market dynamics.
- Emerging consumer trends are shaping the demand for sustainable transport solutions.
Despite the market's growth potential, several restraints hinder its progress. Chief among these are the significant upfront infrastructure investments required for new projects, which can deter stakeholders. Additionally, stringent safety regulations necessitate a comprehensive understanding and adherence to maintenance protocols, which can impose operational constraints. Finally, fluctuations in tourism demand, influenced by global economic conditions, can lead to unpredictable revenue streams for operators, complicating long-term financial planning.
The market is witnessing several transformative trends that are shaping its future. One prominent trend is the integration of smart technology within cable car systems, enhancing user experience and operational efficiency. Furthermore, there is a growing emphasis on sustainable practices, with manufacturers investing in environmentally friendly materials and energy-efficient systems. The rise of urban tourism is also notable, as cities increasingly explore cable cars as a means of connecting various attractions while alleviating traffic congestion.
Opportunities for growth in the Australia Cable Cars & Ropeways Market are abundant, particularly in the realm of eco-tourism. As more travelers seek sustainable vacation options, operators can capitalize on this trend by promoting scenic cable routes that highlight natural beauty. Additionally, investments in urban infrastructure are ripe for exploration, as cities expand their transport options to include cable systems, thus presenting a significant opportunity for new projects and partnerships.
Government policies in Australia have increasingly recognized the potential of cable cars and ropeways to enhance tourism infrastructure and promote regional development. Initiatives often include investment incentives aimed at encouraging the development of new projects, alongside regulatory frameworks designed to ensure safety and environmental compliance. Such policies are essential in fostering a conducive environment for market expansion and innovation.
From 2026 to 2032, the Australia Cable Cars & Ropeways Market is poised for steady advancement. The intersection of technology and infrastructure will be pivotal as operators look to enhance safety and the user experience. Additionally, urban planning frameworks are likely to evolve, integrating cable systems as an essential component of comprehensive transport solutions. This creates a future where cable cars not only serve as tourist attractions but also as vital urban transport systems.
Recent developments within the Australia Cable Cars & Ropeways Market indicate a strategic shift towards integrating advanced technology in both design and operations. There have been notable discussions surrounding the implementation of enhanced safety features and eco-friendly materials, indicating a trend towards sustainable solutions. Additionally, several governmental bodies have expressed interest in funding cable car projects that promise to boost local economies and enhance urban mobility.
- 10 Years of Market Numbers
- Historical Data Starting from 2022 to 2025
- Base Year: 2025
- Forecast Data until 2032
- Key Performance Indicators Impacting the Market
- Major Upcoming Developments and Projects
Key Highlights of the Report:
- Australia Cable Cars & Ropeways Market Outlook
- Market Size of Australia Cable Cars & Ropeways Market, 2025
- Forecast of Australia Cable Cars & Ropeways Market, 2032
- Historical Data and Forecast of Australia Cable Cars & Ropeways Revenues & Volume for the Period 2022-2032F
- Australia Cable Cars & Ropeways Market Trend Evolution
- Australia Cable Cars & Ropeways Market Drivers and Challenges
- Australia Cable Cars & Ropeways Price Trends
- Australia Cable Cars & Ropeways Porter's Five Forces
- Australia Cable Cars & Ropeways Industry Life Cycle
- Historical Data and Forecast of Australia Cable Cars & Ropeways Market Revenues & Volume By Type for the Period 2022-2032F
- Historical Data and Forecast of Australia Cable Cars & Ropeways Market Revenues & Volume By Tourism for the Period 2022-2032F
- Historical Data and Forecast of Australia Cable Cars & Ropeways Market Revenues & Volume By Material handling for the Period 2022-2032F
- Historical Data and Forecast of Australia Cable Cars & Ropeways Market Revenues & Volume By Public transportation for the Period 2022-2032F
- Historical Data and Forecast of Australia Cable Cars & Ropeways Market Revenues & Volume By Mining industries for the Period 2022-2032F
- Historical Data and Forecast of Australia Cable Cars & Ropeways Market Revenues & Volume By Sales Channel for the Period 2022-2032F
- Historical Data and Forecast of Australia Cable Cars & Ropeways Market Revenues & Volume By OEM (Original Equipment Manufacturer) for the Period 2022-2032F
- Historical Data and Forecast of Australia Cable Cars & Ropeways Market Revenues & Volume By Aftermarket for the Period 2022-2032F
- Australia Cable Cars & Ropeways Import Export Trade Statistics
- Market Opportunity Assessment By Type
- Market Opportunity Assessment By Sales Channel
- Australia Cable Cars & Ropeways Top Companies Market Share
- Australia Cable Cars & Ropeways Competitive Benchmarking By Technical and Operational Parameters
- Australia Cable Cars & Ropeways Company Profiles
- Australia Cable Cars & Ropeways Key Strategic Recommendations
Frequently Asked Questions About the Market Study (FAQs):
The growth of the tourism industry and increasing urbanization are primary drivers, as they create a demand for efficient transport solutions and scenic leisure experiences.
The market is estimated to be USD 163 Million in 2025 and is projected to reach USD 191 Million by 2032, reflecting a CAGR of 2.3% from 2026 to 2032.
Innovations focus on enhancing safety features and operational efficiency, with smart technologies being integrated into cable car systems for improved performance.
Government initiatives often include investment incentives and regulatory frameworks aimed at fostering safety and promoting regional development, crucial for market growth.
Future trends may include a heightened focus on eco-tourism, integration of smart technologies, and the evolving role of cable systems in urban transportation planning.
6Wresearch actively monitors the Australia Cable Cars & Ropeways Market and publishes its comprehensive annual report, highlighting emerging trends, growth drivers, revenue analysis, and forecast outlook. Our insights help businesses to make data-backed strategic decisions with ongoing market dynamics. Our analysts track relevent industries related to the Australia Cable Cars & Ropeways Market, allowing our clients with actionable intelligence and reliable forecasts tailored to emerging regional needs.
Yes, we provide customisation as per your requirements. To learn more, feel free to contact us on sales@6wresearch.com
1 Executive Summary |
2 Introduction |
2.1 Key Highlights of the Report |
2.2 Report Description |
2.3 Market Scope & Segmentation |
2.4 Research Methodology |
2.5 Assumptions |
3 Australia Cable Cars & Ropeways Market Overview |
3.1 Australia Country Macro Economic Indicators |
3.2 Australia Cable Cars & Ropeways Market Revenues & Volume, 2022 & 2032F |
3.3 Australia Cable Cars & Ropeways Market - Industry Life Cycle |
3.4 Australia Cable Cars & Ropeways Market - Porter's Five Forces |
3.5 Australia Cable Cars & Ropeways Market Revenues & Volume Share, By Type, 2022 & 2032F |
3.6 Australia Cable Cars & Ropeways Market Revenues & Volume Share, By Sales Channel, 2022 & 2032F |
4 Australia Cable Cars & Ropeways Market Dynamics |
4.1 Impact Analysis |
4.2 Market Drivers |
4.2.1 Increasing tourism in Australia |
4.2.2 Demand for eco-friendly transportation solutions |
4.2.3 Government investments in infrastructure development |
4.3 Market Restraints |
4.3.1 High initial investment costs |
4.3.2 Limited availability of suitable locations for installations |
4.3.3 Seasonal nature of tourism affecting demand |
5 Australia Cable Cars & Ropeways Market Trends |
6 Australia Cable Cars & Ropeways Market, By Types |
6.1 Australia Cable Cars & Ropeways Market, By Type |
6.1.1 Overview and Analysis |
6.1.2 Australia Cable Cars & Ropeways Market Revenues & Volume, By Type, 2022-2032F |
6.1.3 Australia Cable Cars & Ropeways Market Revenues & Volume, By Tourism, 2022-2032F |
6.1.4 Australia Cable Cars & Ropeways Market Revenues & Volume, By Material handling, 2022-2032F |
6.1.5 Australia Cable Cars & Ropeways Market Revenues & Volume, By Public transportation, 2022-2032F |
6.1.6 Australia Cable Cars & Ropeways Market Revenues & Volume, By Mining industries, 2022-2032F |
6.2 Australia Cable Cars & Ropeways Market, By Sales Channel |
6.2.1 Overview and Analysis |
6.2.2 Australia Cable Cars & Ropeways Market Revenues & Volume, By OEM (Original Equipment Manufacturer), 2022-2032F |
6.2.3 Australia Cable Cars & Ropeways Market Revenues & Volume, By Aftermarket, 2022-2032F |
7 Australia Cable Cars & Ropeways Market Import-Export Trade Statistics |
7.1 Australia Cable Cars & Ropeways Market Export to Major Countries |
7.2 Australia Cable Cars & Ropeways Market Imports from Major Countries |
8 Australia Cable Cars & Ropeways Market Key Performance Indicators |
8.1 Average daily ridership |
8.2 Customer satisfaction ratings |
8.3 Number of new installations or expansions |
8.4 Average revenue per ride |
8.5 Frequency of maintenance and downtime |
9 Australia Cable Cars & Ropeways Market - Opportunity Assessment |
9.1 Australia Cable Cars & Ropeways Market Opportunity Assessment, By Type, 2022 & 2032F |
9.2 Australia Cable Cars & Ropeways Market Opportunity Assessment, By Sales Channel, 2022 & 2032F |
10 Australia Cable Cars & Ropeways Market - Competitive Landscape |
10.1 Australia Cable Cars & Ropeways Market Revenue Share, By Companies, 2025 |
10.2 Australia Cable Cars & Ropeways Market Competitive Benchmarking, By Operating and Technical Parameters |
11 Company Profiles |
12 Recommendations |
13 Disclaimer |
Global Go To Market Strategy - 2030
Export potential enables firms to identify high-growth global markets with greater confidence by combining advanced trade intelligence with a structured quantitative methodology. The framework analyzes emerging demand trends and country-level import patterns while integrating macroeconomic and trade datasets such as GDP and population forecasts, bilateral import–export flows, tariff structures, elasticity differentials between developed and developing economies, geographic distance, and import demand projections. Using weighted trade values from 2020–2024 as the base period to project country-to-country export potential for 2030, these inputs are operationalized through calculated drivers such as gravity model parameters, tariff impact factors, and projected GDP per-capita growth. Through an analysis of hidden potentials, demand hotspots, and market conditions that are most favorable to success, this method enables firms to focus on target countries, maximize returns, and global expansion with data, backed by accuracy.
By factoring in the projected importer demand gap that is currently unmet and could be potential opportunity, it identifies the potential for the Exporter (Country) among 190 countries, against the general trade analysis, which identifies the biggest importer or exporter.
To discover high-growth global markets and optimize your business strategy:
Click Here
Pricing
- Single User License$ 1,995
- Department License$ 2,400
- Site License$ 3,120
- Global License$ 3,795

Leadership Perspectives from Industry Events
Search
Thought Leadership and Analyst Meet


Our Clients
6WResearch In News
- India Air Conditioner Market Set for Strong Rebound in 2026 After Weather-Led Correction and GST-Driven Recovery: 6Wresearch
- ADAS in India: How Automatic Emergency Braking, Blind Spot Detection & Driver Monitoring are Transforming Road Safety
- Doha a strategic location for EV manufacturing hub: IPA Qatar
- Demand for luxury TVs surging in the GCC, says Samsung
- Empowering Growth: The Thriving Journey of Bangladesh’s Cable Industry
- Demand for luxury TVs surging in the GCC, says Samsung
Latest Reports
- Nicaragua RPG Gaming Market (2026-2032)
- New Zealand RPG Gaming Market (2026-2032)
- Netherlands RPG Gaming Market (2026-2032)
- Nauru RPG Gaming Market (2026-2032)
- Namibia RPG Gaming Market (2026-2032)
- Mozambique RPG Gaming Market (2026-2032)
- Montenegro RPG Gaming Market (2026-2032)
- Mongolia RPG Gaming Market (2026-2032)
- Monaco RPG Gaming Market (2026-2032)
- Micronesia RPG Gaming Market (2026-2032)
Industry Events and Analyst Meet

EV India Expo 2026

HIMTEX 2026

India Refining Summit 2026

India EV Show 2026

EV tech India Expo 2026
Whitepaper
- Middle East & Africa Commercial Security Market Click here to view more.
- Middle East & Africa Fire Safety Systems & Equipment Market Click here to view more.
- GCC Drone Market Click here to view more.
- Middle East Lighting Fixture Market Click here to view more.
- GCC Physical & Perimeter Security Market Click here to view more.