Australia Chemotherapy Market (2026-2032) | Growth, Companies, Analysis, Outlook, Value, Share, Trends, Size, Forecast, Industry & Revenue
Market Forecast By Drug Class (Alkylating Agents, Mitotic Inhibitors, Antimetabolites, Topoisomerase Inhibitors, Antitumor Antibiotic), By Indication (Lung Cancer, Breast Cancer, Colorectal Cancer, Prostate Cancer, Stomach Cancer, Lymphoma, Leukemia, Ovarian Cancer), By Route of Drug Administration (Intravenous, Oral, Subcutaneous, Intra-Muscular, Intravesicular, Topical, Intraperitoneal, Intraventricular/Intrathecal), By End-Users (Specialty Centers, Hospitals & Clinics) And Competitive Landscape
| Product Code: ETC044955 | Publication Date: Jan 2021 | Updated Date: Jun 2026 | Product Type: Report | |
| Publisher: 6Wresearch | Author: Ravi Bhandari | No. of Pages: 70 | No. of Figures: 35 | No. of Tables: 5 |
Australia Chemotherapy Market Summary
The australia chemotherapy market was estimated at USD 210 Million in 2025 and is projected to reach USD 247 Million by 2032, growing at a CAGR of 2.6% from 2026 to 2032.
Australia Chemotherapy Market Growth Rate Analysis (2021-2032)
The Australian chemotherapy market has rebounded from a slight decline of 0.7% in 2021 to an impressive growth of 5.8% in 2022, driven by increased investments in innovative treatment options and improved patient access to healthcare. Maintaining robust expansion, the market has stabilized with growth rates of 4.6% in 2023 and 3.1% projected for 2024. This upward trend can be attributed to advancements in biotechnology, a growing focus on personalized medicine, and supportive healthcare policies enhancing treatment availability. While growth is expected to moderate to around 1.8% by 2025, resurgence in demand for chemotherapy treatments, spurred by rising cancer incidence, continues to shape the landscape through 2031, ensuring a sustainable market trajectory.
Australia Chemotherapy Market Year-wise Growth Rate and Key Drivers
This graph highlights how the Australia Chemotherapy Market has steadily grown over the past five years, supported by major growth factors.
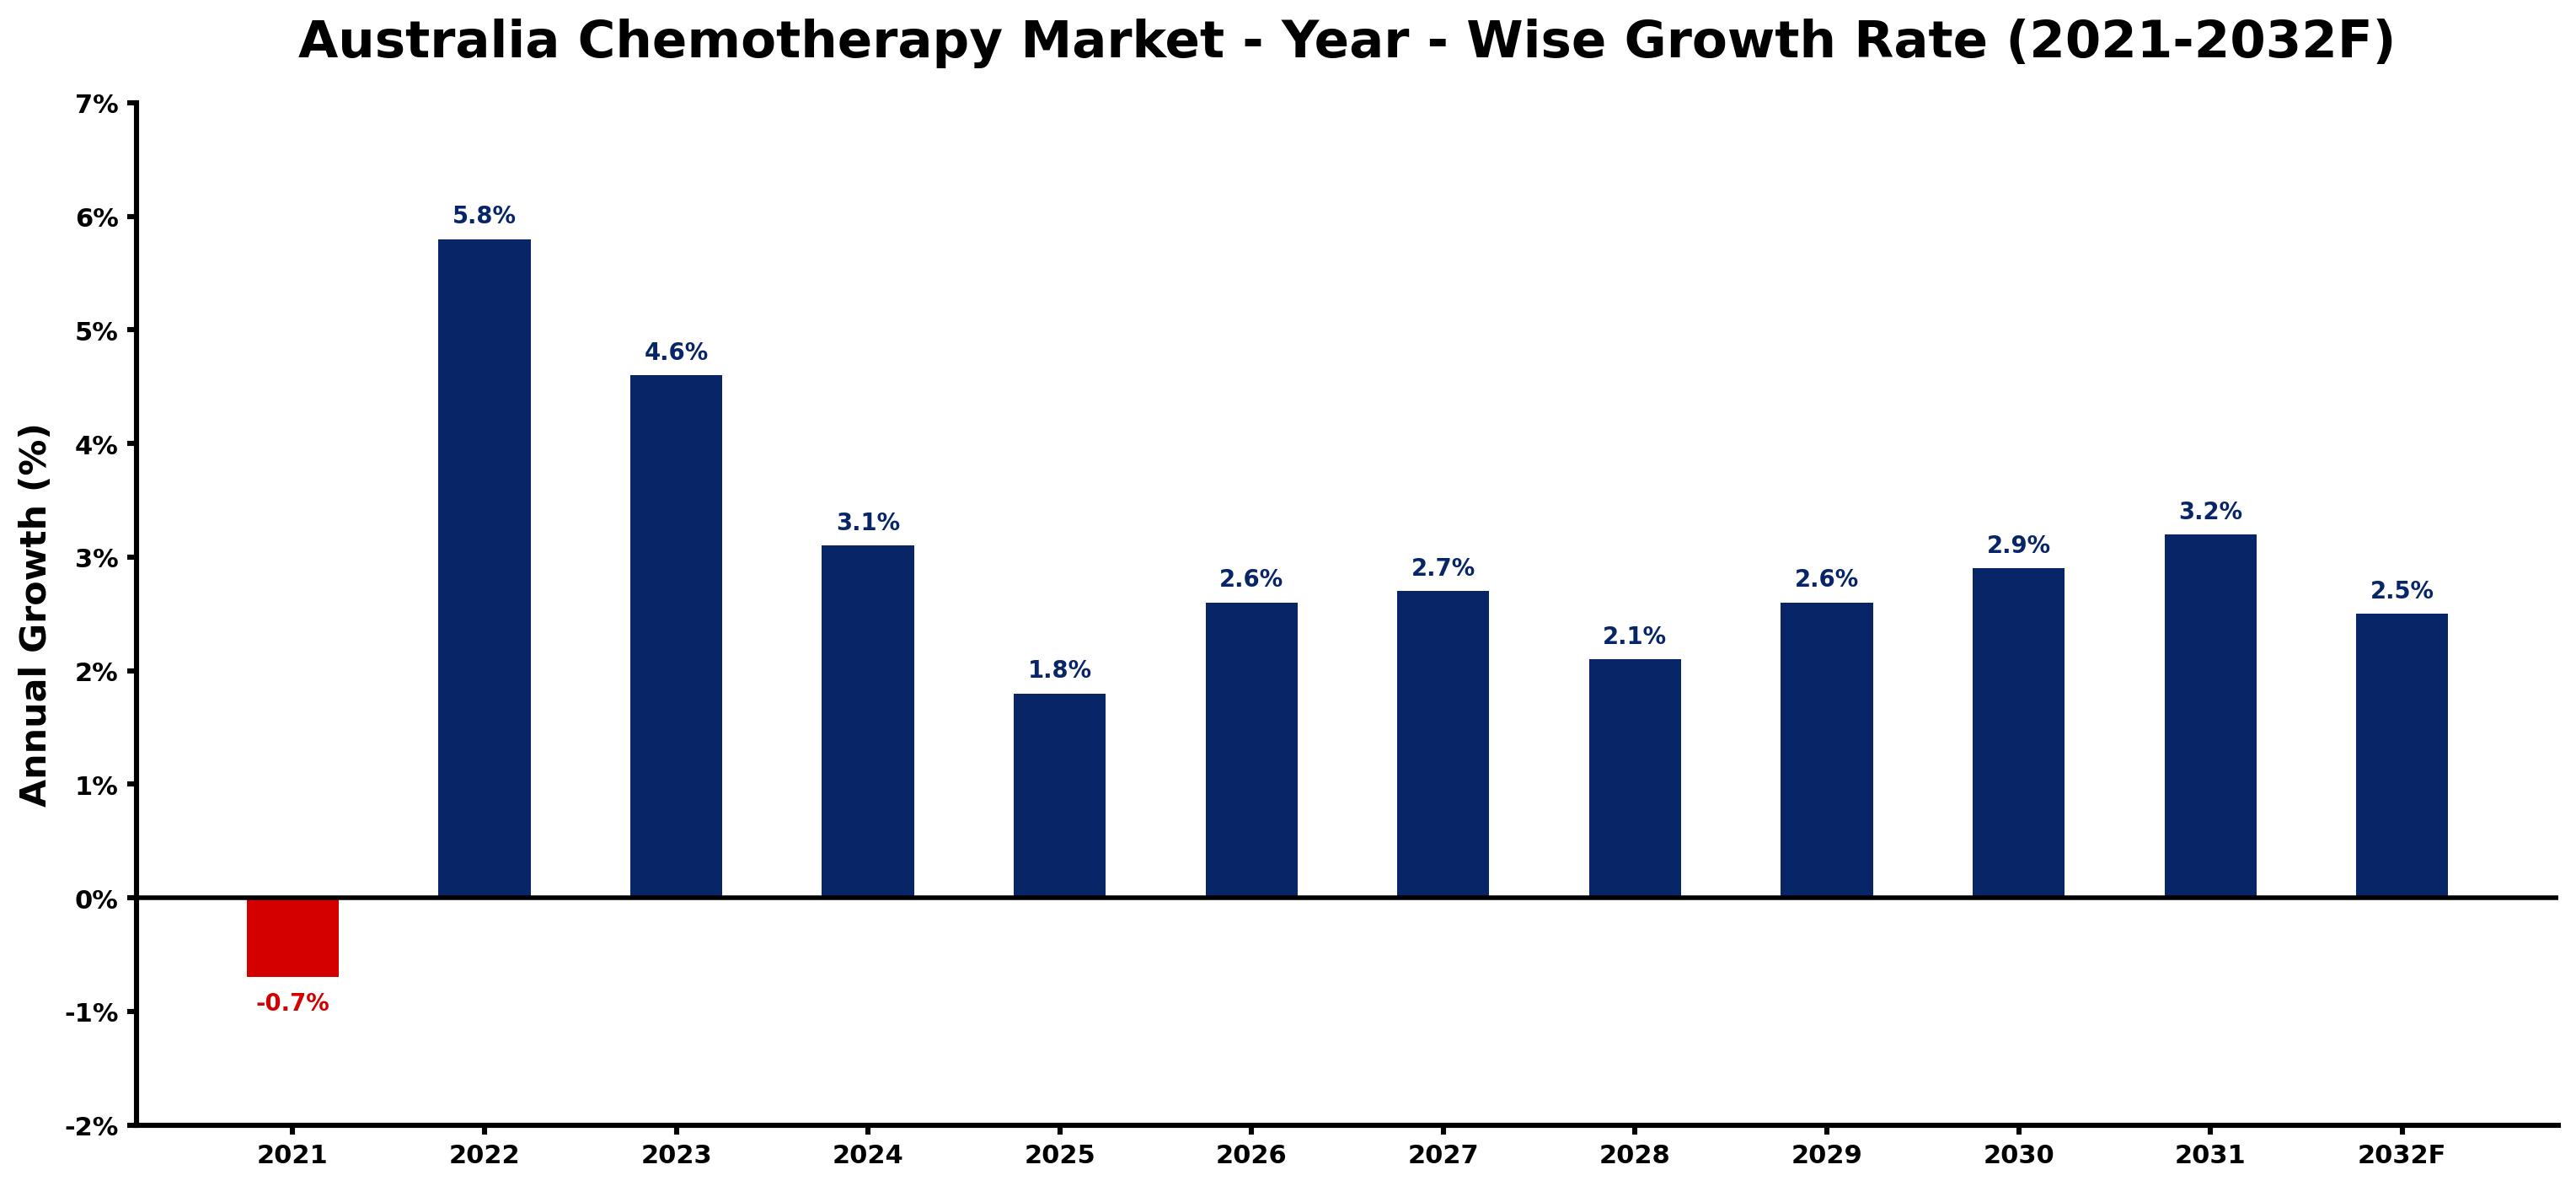
The table below presents the year wise growth rates along with the key drivers influencing the market
| Year | Growth Rate | Major Drivers |
| 2021 | -0.7% | Decreased patient access to healthcare services diminished chemotherapy treatment rates amid ongoing pandemicrelated restrictions. |
| 2022 | 5.8% | Innovative drug formulations entered the market, improving efficacy and reducing side effects. |
| 2023 | 4.6% | Patient-centric care models gained traction, focusing on holistic treatment approaches. |
| 2024 | 3.1% | Biosimilars played a significant role in reducing chemotherapy costs for patients. |
| 2025 | 1.8% | Collaborations between biotech firms and hospitals advanced personalized treatment options. |
| 2026 | 2.6% | Emerging digital health platforms streamlined patient monitoring and engagement processes. |
| 2027 | 2.7% | Research initiatives focused on genetic profiling, tailoring therapies to individual patients. |
| 2028 | 2.1% | Awareness campaigns successfully educated the public about early detection and treatment. |
| 2029 | 2.6% | Integration of artificial intelligence in treatment planning optimized chemotherapy regimens. |
| 2030 | 2.9% | Investment in local manufacturing improved drug availability and reduced supply chain delays. |
| 2031 | 3.2% | Emerging supportive therapies enhanced the quality of life for chemotherapy patients. |
| 2032 | 2.5% | Collaborative networks among health professionals improved care coordination across treatment stages. |
Note - Market size estimations and growth projections presented in this report are based on 6Wresearch's advanced forecasting approach, validated with industry datasets as of June 2026.
Australia Chemotherapy Market Synopsis
The Australia Chemotherapy Market is projected to reach 2.6% and witness significant growth during the forecast period (2026-2032). This market encompasses a comprehensive range of chemotherapy drugs, treatment regimens, and ancillary therapies essential for cancer management. As a critical component of oncological care, chemotherapy facilitates the targeting and elimination of malignant cells, thereby contributing to tumor reduction, metastasis prevention, and overall improvements in patient survival rates. The integration of personalized medicine and multidisciplinary treatment approaches by healthcare providers is increasingly influencing the dynamics of cancer care in Australia.
Australia Chemotherapy Market Growth Drivers
The Australia Chemotherapy Market is primarily fueled by several key factors:
- The rising incidence of cancer among the Australian population is a significant driver, necessitating effective treatments and management strategies.
- Advancements in cancer research have led to innovative chemotherapy agents and treatment modalities, enhancing patient outcomes and treatment efficacy.
- Technological innovations in drug delivery systems are improving the precision of chemotherapy administration, minimizing side effects, and optimizing therapeutic results.
- Increased awareness regarding cancer prevention, early diagnosis, and timely treatment is contributing to the demand for chemotherapy services across Australia.
- Government initiatives aimed at bolstering healthcare infrastructure and expanding cancer care services are playing a crucial role in facilitating market growth.
Australia Chemotherapy Market Challenges and Restraints
Despite its robust growth, the Australia Chemotherapy Market faces several challenges:
- The high cost associated with cancer treatments, including chemotherapy drugs, poses a significant barrier to accessibility for many patients.
- Managing the adverse effects and toxicity linked to chemotherapy regimens remains a critical concern for healthcare providers and patients alike.
- Ensuring equitable access to advanced therapies and personalized treatment options is a persistent challenge within the healthcare system.
- The complexity of coordinating care among multidisciplinary teams can hinder the timely initiation of treatment for some patients.
- Ongoing research and development costs place financial pressure on pharmaceutical companies, potentially impacting drug availability and innovation.
Australia Chemotherapy Market Government Investment and Initiatives
Government policy plays a significant role in shaping the landscape of the Australia Chemotherapy Market. Initiatives include:
- Subsidization of chemotherapy drugs through public healthcare programs, making essential medications more affordable for patients.
- Increased funding for research into novel cancer therapies, with the aim of enhancing treatment options available in the market.
- Development of national cancer control plans that emphasize early detection and screening initiatives, which can potentially reduce the necessity for extensive chemotherapy.
- Collaboration between government bodies, healthcare providers, and pharmaceutical organizations to address access challenges and ensure all patients receive equitable care.
- Investments in healthcare infrastructure aimed at improving the accessibility and quality of cancer care services across diverse regions in Australia.
Australia Chemotherapy Market Latest Developments (May 2025 - June 2026)
Recent developments in the Australia Chemotherapy Market between May 2025 and June 2026 highlight the industry's adaptive nature:
- New clinical trials have initiated promising combination therapies that are being evaluated for their efficacy in enhancing patient outcomes.
- Advancements in digital health solutions are being integrated into treatment protocols, facilitating better monitoring of patient responses to chemotherapy.
- Healthcare institutions are increasingly adopting personalized medicine approaches, tailoring chemotherapy plans based on genetic and biomarker profiling.
- Collaborative networks among research institutions and pharmaceutical companies are emerging, aimed at expediting the development of innovative chemotherapy agents.
- Policy updates are being introduced to streamline the approval processes for new cancer treatments, fostering a quicker transition from research to clinical application.
Australia Chemotherapy Market - Key Attractiveness of the Report
- 10 Years of Market Numbers
- Historical Data Starting from 2022 to 2025
- Base Year: 2025
- Forecast Data until 2032
- Key Performance Indicators Impacting the Market
- Major Upcoming Developments and Projects
Key Highlights of the Report:
- Australia Chemotherapy? Market Outlook
- Market Size of Australia Chemotherapy? Market, 2025
- Forecast of Australia Chemotherapy? Market, 2032
- Historical Data and Forecast of Australia Chemotherapy? Revenues & Volume for the Period 2022-2032F
- Australia Chemotherapy? Market Trend Evolution
- Australia Chemotherapy? Market Drivers and Challenges
- Australia Chemotherapy? Price Trends
- Australia Chemotherapy? Porter's Five Forces
- Australia Chemotherapy? Industry Life Cycle
- Historical Data and Forecast of Australia Chemotherapy? Market Revenues & Volume By Drug Class for the Period 2022-2032F
- Historical Data and Forecast of Australia Chemotherapy? Market Revenues & Volume By Alkylating Agents for the Period 2022-2032F
- Historical Data and Forecast of Australia Chemotherapy? Market Revenues & Volume By Mitotic Inhibitors for the Period 2022-2032F
- Historical Data and Forecast of Australia Chemotherapy? Market Revenues & Volume By Antimetabolites for the Period 2022-2032F
- Historical Data and Forecast of Australia Chemotherapy? Market Revenues & Volume By Topoisomerase Inhibitors for the Period 2022-2032F
- Historical Data and Forecast of Australia Chemotherapy? Market Revenues & Volume By Antitumor Antibiotic for the Period 2022-2032F
- Historical Data and Forecast of Australia Chemotherapy? Market Revenues & Volume By Indication for the Period 2022-2032F
- Historical Data and Forecast of Australia Chemotherapy? Market Revenues & Volume By Lung Cancer for the Period 2022-2032F
- Historical Data and Forecast of Australia Chemotherapy? Market Revenues & Volume By Breast Cancer for the Period 2022-2032F
- Historical Data and Forecast of Australia Chemotherapy? Market Revenues & Volume By Colorectal Cancer for the Period 2022-2032F
- Historical Data and Forecast of Australia Chemotherapy? Market Revenues & Volume By Prostate Cancer for the Period 2022-2032F
- Historical Data and Forecast of Australia Chemotherapy? Market Revenues & Volume By Stomach Cancer for the Period 2022-2032F
- Historical Data and Forecast of Australia Chemotherapy? Market Revenues & Volume By Lymphoma for the Period 2022-2032F
- Historical Data and Forecast of Australia Chemotherapy? Market Revenues & Volume By Leukemia for the Period 2022-2032F
- Historical Data and Forecast of Australia Chemotherapy? Market Revenues & Volume By Ovarian Cancer for the Period 2022-2032F
- Historical Data and Forecast of Australia Chemotherapy? Market Revenues & Volume By Route of Drug Administration for the Period 2022-2032F
- Historical Data and Forecast of Australia Chemotherapy? Market Revenues & Volume By Intravenous for the Period 2022-2032F
- Historical Data and Forecast of Australia Chemotherapy? Market Revenues & Volume By Oral for the Period 2022-2032F
- Historical Data and Forecast of Australia Chemotherapy? Market Revenues & Volume By Subcutaneous for the Period 2022-2032F
- Historical Data and Forecast of Australia Chemotherapy? Market Revenues & Volume By Intra-Muscular for the Period 2022-2032F
- Historical Data and Forecast of Australia Chemotherapy? Market Revenues & Volume By Intravesicular for the Period 2022-2032F
- Historical Data and Forecast of Australia Chemotherapy? Market Revenues & Volume By Topical for the Period 2022-2032F
- Historical Data and Forecast of Australia Chemotherapy? Market Revenues & Volume By Intraperitoneal for the Period 2022-2032F
- Historical Data and Forecast of Australia Chemotherapy? Market Revenues & Volume By Intraventricular/Intrathecal for the Period 2022-2032F
- Historical Data and Forecast of Australia Chemotherapy? Market Revenues & Volume By End-Users for the Period 2022-2032F
- Historical Data and Forecast of Australia Chemotherapy? Market Revenues & Volume By Specialty Centers for the Period 2022-2032F
- Historical Data and Forecast of Australia Chemotherapy? Market Revenues & Volume By Hospitals & Clinics for the Period 2022-2032F
- Australia Chemotherapy? Import Export Trade Statistics
- Market Opportunity Assessment By Drug Class
- Market Opportunity Assessment By Indication
- Market Opportunity Assessment By Route of Drug Administration
- Market Opportunity Assessment By End-Users
- Australia Chemotherapy? Top Companies Market Share
- Australia Chemotherapy? Competitive Benchmarking By Technical and Operational Parameters
- Australia Chemotherapy? Company Profiles
- Australia Chemotherapy? Key Strategic Recommendations
Frequently Asked Questions About the Market Study (FAQs):
The market growth is primarily attributed to the increasing prevalence of cancer, advancements in research, and government initiatives aimed at improving cancer care.
Key challenges include the high cost of treatments, managing side effects, and ensuring equitable access to therapies for all patients.
The government supports the market through subsidies, funding for research, and initiatives promoting early detection of cancer.
Recent developments include innovations in combination therapies, digital health integration, and enhanced policies for treatment approvals.
6Wresearch actively monitors the Australia Chemotherapy Market and publishes its comprehensive annual report, highlighting emerging trends, growth drivers, revenue analysis, and forecast outlook. Our insights help businesses to make data-backed strategic decisions with ongoing market dynamics. Our analysts track relevent industries related to the Australia Chemotherapy Market, allowing our clients with actionable intelligence and reliable forecasts tailored to emerging regional needs.
Yes, we provide customisation as per your requirements. To learn more, feel free to contact us on sales@6wresearch.com
1 Executive Summary |
2 Introduction |
2.1 Key Highlights of the Report |
2.2 Report Description |
2.3 Market Scope & Segmentation |
2.4 Research Methodology |
2.5 Assumptions |
3 Australia Chemotherapy Market Overview |
3.1 Australia Country Macro Economic Indicators |
3.2 Australia Chemotherapy Market Revenues & Volume, 2022 & 2032F |
3.3 Australia Chemotherapy Market - Industry Life Cycle |
3.4 Australia Chemotherapy Market - Porter's Five Forces |
3.5 Australia Chemotherapy Market Revenues & Volume Share, By Drug Class, 2022 & 2032F |
3.6 Australia Chemotherapy Market Revenues & Volume Share, By Indication, 2022 & 2032F |
3.7 Australia Chemotherapy Market Revenues & Volume Share, By Route of Drug Administration, 2022 & 2032F |
3.8 Australia Chemotherapy Market Revenues & Volume Share, By End-Users, 2022 & 2032F |
4 Australia Chemotherapy Market Dynamics |
4.1 Impact Analysis |
4.2 Market Drivers |
4.2.1 Increasing prevalence of cancer in Australia |
4.2.2 Technological advancements in chemotherapy treatments |
4.2.3 Growing awareness about the benefits of chemotherapy |
4.2.4 Government initiatives to improve cancer care infrastructure |
4.3 Market Restraints |
4.3.1 High cost associated with chemotherapy treatments |
4.3.2 Side effects and toxicity of chemotherapy drugs |
4.3.3 Stringent regulatory requirements for drug approvals |
5 Australia Chemotherapy Market Trends |
6 Australia Chemotherapy Market, By Types |
6.1 Australia Chemotherapy Market, By Drug Class |
6.1.1 Overview and Analysis |
6.1.2 Australia Chemotherapy Market Revenues & Volume, By Drug Class, 2022-2032F |
6.1.3 Australia Chemotherapy Market Revenues & Volume, By Alkylating Agents, 2022-2032F |
6.1.4 Australia Chemotherapy Market Revenues & Volume, By Mitotic Inhibitors, 2022-2032F |
6.1.5 Australia Chemotherapy Market Revenues & Volume, By Antimetabolites, 2022-2032F |
6.1.6 Australia Chemotherapy Market Revenues & Volume, By Topoisomerase Inhibitors, 2022-2032F |
6.1.7 Australia Chemotherapy Market Revenues & Volume, By Antitumor Antibiotic, 2022-2032F |
6.2 Australia Chemotherapy Market, By Indication |
6.2.1 Overview and Analysis |
6.2.2 Australia Chemotherapy Market Revenues & Volume, By Lung Cancer, 2022-2032F |
6.2.3 Australia Chemotherapy Market Revenues & Volume, By Breast Cancer, 2022-2032F |
6.2.4 Australia Chemotherapy Market Revenues & Volume, By Colorectal Cancer, 2022-2032F |
6.2.5 Australia Chemotherapy Market Revenues & Volume, By Prostate Cancer, 2022-2032F |
6.2.6 Australia Chemotherapy Market Revenues & Volume, By Stomach Cancer, 2022-2032F |
6.2.7 Australia Chemotherapy Market Revenues & Volume, By Lymphoma, 2022-2032F |
6.2.8 Australia Chemotherapy Market Revenues & Volume, By Ovarian Cancer, 2022-2032F |
6.2.9 Australia Chemotherapy Market Revenues & Volume, By Ovarian Cancer, 2022-2032F |
6.3 Australia Chemotherapy Market, By Route of Drug Administration |
6.3.1 Overview and Analysis |
6.3.2 Australia Chemotherapy Market Revenues & Volume, By Intravenous, 2022-2032F |
6.3.3 Australia Chemotherapy Market Revenues & Volume, By Oral, 2022-2032F |
6.3.4 Australia Chemotherapy Market Revenues & Volume, By Subcutaneous, 2022-2032F |
6.3.5 Australia Chemotherapy Market Revenues & Volume, By Intra-Muscular, 2022-2032F |
6.3.6 Australia Chemotherapy Market Revenues & Volume, By Intravesicular, 2022-2032F |
6.3.7 Australia Chemotherapy Market Revenues & Volume, By Topical, 2022-2032F |
6.3.8 Australia Chemotherapy Market Revenues & Volume, By Intraventricular/Intrathecal, 2022-2032F |
6.3.9 Australia Chemotherapy Market Revenues & Volume, By Intraventricular/Intrathecal, 2022-2032F |
6.4 Australia Chemotherapy Market, By End-Users |
6.4.1 Overview and Analysis |
6.4.2 Australia Chemotherapy Market Revenues & Volume, By Specialty Centers, 2022-2032F |
6.4.3 Australia Chemotherapy Market Revenues & Volume, By Hospitals & Clinics, 2022-2032F |
7 Australia Chemotherapy Market Import-Export Trade Statistics |
7.1 Australia Chemotherapy Market Export to Major Countries |
7.2 Australia Chemotherapy Market Imports from Major Countries |
8 Australia Chemotherapy Market Key Performance Indicators |
8.1 Patient survival rates post-chemotherapy treatment |
8.2 Adoption rate of innovative chemotherapy technologies |
8.3 Level of investment in research and development for new chemotherapy drugs |
8.4 Patient satisfaction with chemotherapy services |
8.5 Number of cancer cases diagnosed and treated with chemotherapy |
9 Australia Chemotherapy Market - Opportunity Assessment |
9.1 Australia Chemotherapy Market Opportunity Assessment, By Drug Class, 2022 & 2032F |
9.2 Australia Chemotherapy Market Opportunity Assessment, By Indication, 2022 & 2032F |
9.3 Australia Chemotherapy Market Opportunity Assessment, By Route of Drug Administration, 2022 & 2032F |
9.4 Australia Chemotherapy Market Opportunity Assessment, By End-Users, 2022 & 2032F |
10 Australia Chemotherapy Market - Competitive Landscape |
10.1 Australia Chemotherapy Market Revenue Share, By Companies, 2025 |
10.2 Australia Chemotherapy Market Competitive Benchmarking, By Operating and Technical Parameters |
11 Company Profiles |
12 Recommendations |
13 Disclaimer |
Global Go To Market Strategy - 2030
Export potential enables firms to identify high-growth global markets with greater confidence by combining advanced trade intelligence with a structured quantitative methodology. The framework analyzes emerging demand trends and country-level import patterns while integrating macroeconomic and trade datasets such as GDP and population forecasts, bilateral import–export flows, tariff structures, elasticity differentials between developed and developing economies, geographic distance, and import demand projections. Using weighted trade values from 2020–2024 as the base period to project country-to-country export potential for 2030, these inputs are operationalized through calculated drivers such as gravity model parameters, tariff impact factors, and projected GDP per-capita growth. Through an analysis of hidden potentials, demand hotspots, and market conditions that are most favorable to success, this method enables firms to focus on target countries, maximize returns, and global expansion with data, backed by accuracy.
By factoring in the projected importer demand gap that is currently unmet and could be potential opportunity, it identifies the potential for the Exporter (Country) among 190 countries, against the general trade analysis, which identifies the biggest importer or exporter.
To discover high-growth global markets and optimize your business strategy:
Click Here
Pricing
- Single User License$ 1,995
- Department License$ 2,400
- Site License$ 3,120
- Global License$ 3,795

Leadership Perspectives from Industry Events
Search
Thought Leadership and Analyst Meet


Our Clients
6WResearch In News
- India Air Conditioner Market Set for Strong Rebound in 2026 After Weather-Led Correction and GST-Driven Recovery: 6Wresearch
- ADAS in India: How Automatic Emergency Braking, Blind Spot Detection & Driver Monitoring are Transforming Road Safety
- Doha a strategic location for EV manufacturing hub: IPA Qatar
- Demand for luxury TVs surging in the GCC, says Samsung
- Empowering Growth: The Thriving Journey of Bangladesh’s Cable Industry
- Demand for luxury TVs surging in the GCC, says Samsung
Latest Reports
- Poland Fire Protection Systems Market (2026-2032)
- Cape Verde Portable Hand-Thrown Extinguisher Market (2026-2032)
- Canada Portable Hand-Thrown Extinguisher Market (2026-2032)
- Cameroon Portable Hand-Thrown Extinguisher Market (2026-2032)
- Burundi Portable Hand-Thrown Extinguisher Market (2026-2032)
- Burkina Faso Portable Hand-Thrown Extinguisher Market (2026-2032)
- Bulgaria Portable Hand-Thrown Extinguisher Market (2026-2032)
- Brunei Portable Hand-Thrown Extinguisher Market (2026-2032)
- Botswana Portable Hand-Thrown Extinguisher Market (2026-2032)
- Bosnia and Herzegovina Portable Hand-Thrown Extinguisher Market (2026-2032)
Industry Events and Analyst Meet

HIMTEX 2026

India Refining Summit 2026

India EV Show 2026

EV tech India Expo 2026

Auto Tech Asia 2026
Whitepaper
- Middle East & Africa Commercial Security Market Click here to view more.
- Middle East & Africa Fire Safety Systems & Equipment Market Click here to view more.
- GCC Drone Market Click here to view more.
- Middle East Lighting Fixture Market Click here to view more.
- GCC Physical & Perimeter Security Market Click here to view more.