Australia Dibromantin Market (2026-2032) Outlook | Growth, Companies, Trends, Industry, Value, Revenue, Forecast, Share, Analysis & Size
Market Forecast By Purity (Purity Of 98%, Purity Greater Than 98%), By Application (Pulp & Paper, Medical Intermediate, Water Treatment, Others) And Competitive Landscape
| Product Code: ETC417211 | Publication Date: Oct 2022 | Updated Date: Mar 2026 | Product Type: Market Research Report | |
| Publisher: 6Wresearch | Author: Shubham Padhi | No. of Pages: 75 | No. of Figures: 35 | No. of Tables: 20 |
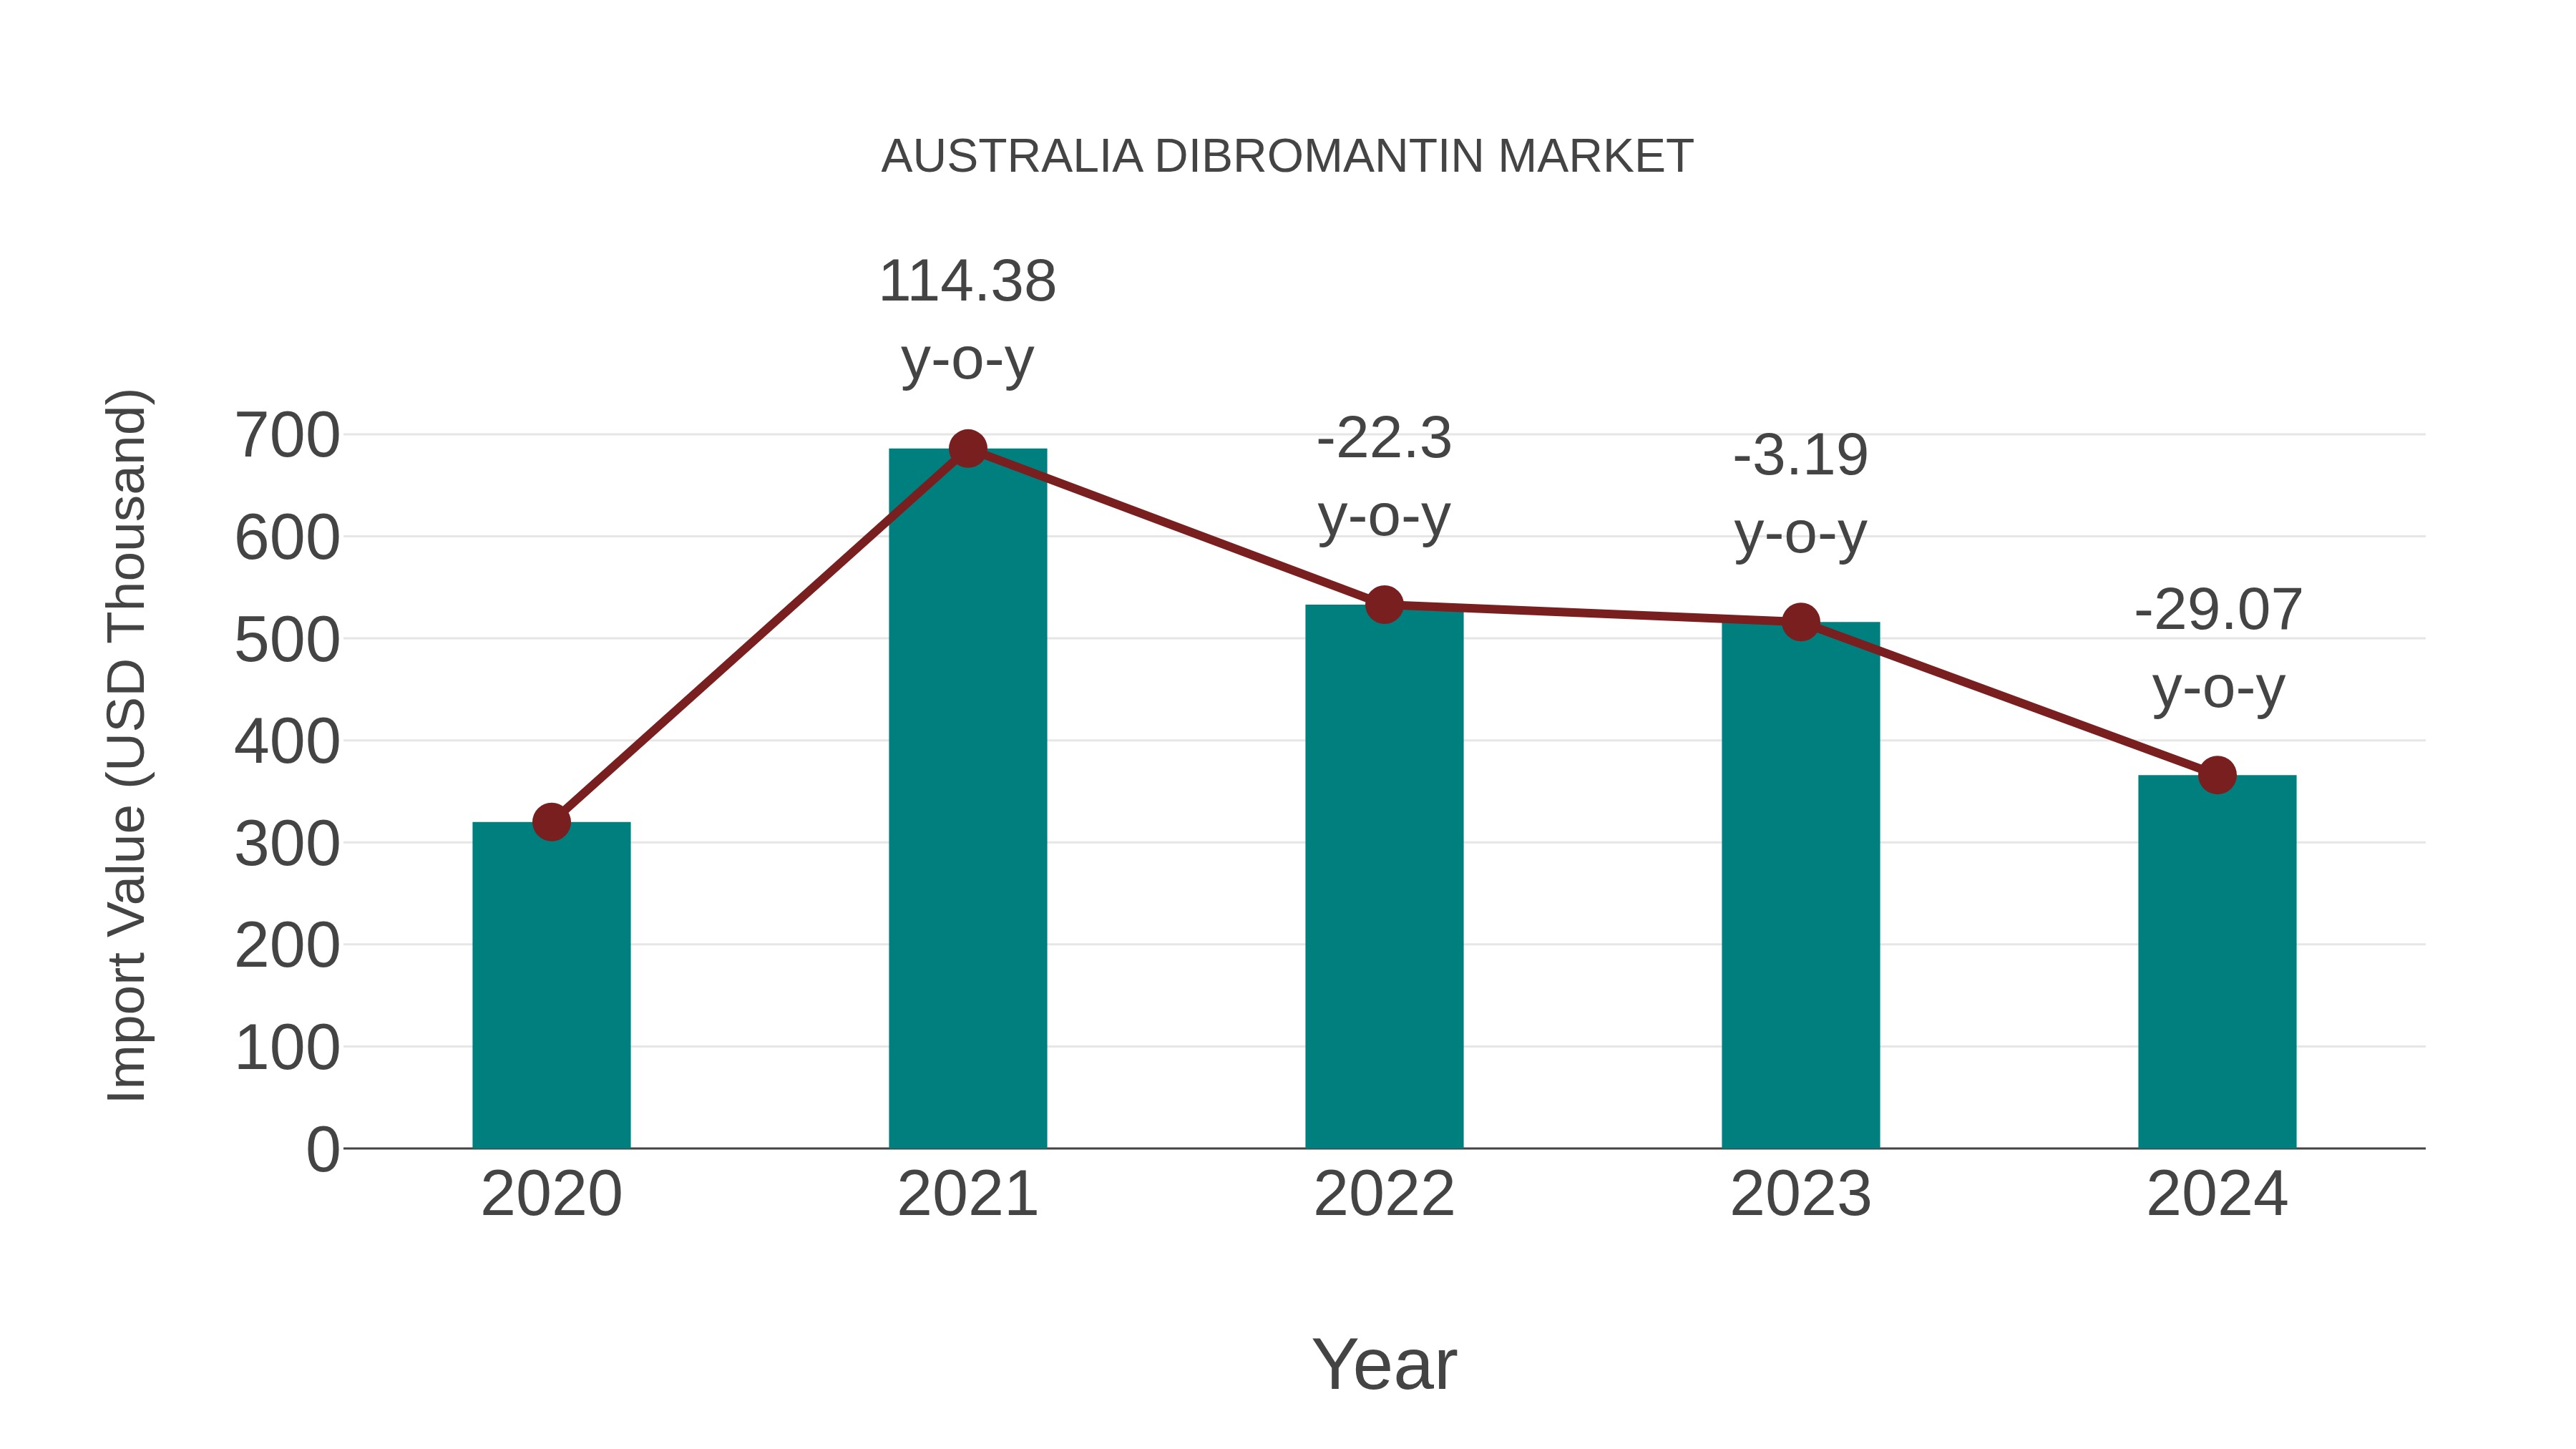
Australia Dibromantin Market: Import Trend Analysis
In the Australia dibromantin market, the import trend experienced a decline with a growth rate of -29.07% from 2023 to 2024, while the compound annual growth rate (CAGR) for 2020-2024 stood at 3.41%. This decline in imports could be attributed to shifting demand patterns or changes in trade policies impacting market stability.
Australia Dibromantin Market Overview
The Australia Dibromantin market is witnessing limited demand, primarily driven by niche applications in agriculture, water treatment, and industrial processes. Dibromantin, also known as 2,2-Dibromo-2-nitroethanol, is a chemical compound used as a biocide and preservative agent in various applications such as cooling water treatment, pulp and paper processing, and animal husbandry. Factors such as its effectiveness against a wide range of microorganisms, low toxicity to mammals, and stability in harsh environmental conditions contribute to its utility in specific industries. However, regulatory restrictions on the use of biocidal chemicals and the availability of alternative biocide products are constraining market growth in Australia.
Drivers of the market
The Australia Dibromantin market is witnessing growth driven by its applications in the agricultural sector. Dibromantin, also known as 2,4-dibromo-3-nitrilopropionamide, is used as a biocide and preservative in water treatment and agricultural applications. It is primarily utilized for controlling microbial growth in water systems and protecting crops from fungal diseases. With the increasing emphasis on food safety and crop protection, the demand for dibromantin in agriculture is expected to remain robust. Moreover, stringent regulations governing water quality and pesticide use further drive the adoption of dibromantin in Australia.
Challenges of the market
In the Australia Dibromantin market, challenges arise from regulatory scrutiny and restrictions on the use of brominated flame retardants due to environmental and health concerns. Dibromantin, being a brominated compound, faces increasing regulatory pressure, leading to restrictions on its usage in various applications such as electronics, textiles, and construction materials. Market players need to invest in research and development to explore alternative flame retardant solutions that meet regulatory requirements while maintaining performance standards.
Government Policy of the market
Government policies in Australia play a significant role in shaping the Dibromantin market, particularly concerning agricultural regulations, environmental protection, and chemical safety. Regulations governing pesticide use and registration influence the availability and usage of dibromantin in agricultural applications. Environmental regulations mandate measures to minimize pesticide runoff and contamination of water sources, mitigating potential ecological impacts. Moreover, chemical safety regulations govern the handling, storage, and disposal of dibromantin to prevent risks to human health and the environment. Government support for sustainable agriculture practices and integrated pest management influences the demand for dibromantin and other pesticides in Australia.
Key Highlights of the Report:
- Australia Dibromantin Market Outlook
- Market Size of Australia Dibromantin Market, 2025
- Forecast of Australia Dibromantin Market, 2032
- Historical Data and Forecast of Australia Dibromantin Revenues & Volume for the Period 2022-2032F
- Australia Dibromantin Market Trend Evolution
- Australia Dibromantin Market Drivers and Challenges
- Australia Dibromantin Price Trends
- Australia Dibromantin Porter's Five Forces
- Australia Dibromantin Industry Life Cycle
- Historical Data and Forecast of Australia Dibromantin Market Revenues & Volume By Purity for the Period 2022-2032F
- Historical Data and Forecast of Australia Dibromantin Market Revenues & Volume By Purity Of 98% for the Period 2022-2032F
- Historical Data and Forecast of Australia Dibromantin Market Revenues & Volume By Purity Greater Than 98% for the Period 2022-2032F
- Historical Data and Forecast of Australia Dibromantin Market Revenues & Volume By Application for the Period 2022-2032F
- Historical Data and Forecast of Australia Dibromantin Market Revenues & Volume By Pulp & Paper for the Period 2022-2032F
- Historical Data and Forecast of Australia Dibromantin Market Revenues & Volume By Medical Intermediate for the Period 2022-2032F
- Historical Data and Forecast of Australia Dibromantin Market Revenues & Volume By Water Treatment for the Period 2022-2032F
- Historical Data and Forecast of Australia Dibromantin Market Revenues & Volume By Others for the Period 2022-2032F
- Australia Dibromantin Import Export Trade Statistics
- Market Opportunity Assessment By Purity
- Market Opportunity Assessment By Application
- Australia Dibromantin Top Companies Market Share
- Australia Dibromantin Competitive Benchmarking By Technical and Operational Parameters
- Australia Dibromantin Company Profiles
- Australia Dibromantin Key Strategic Recommendations
Australia Dibromantin Market (2026-2032): FAQs
6Wresearch actively monitors the Australia Dibromantin Market and publishes its comprehensive annual report, highlighting emerging trends, growth drivers, revenue analysis, and forecast outlook. Our insights help businesses to make data-backed strategic decisions with ongoing market dynamics. Our analysts track relevent industries related to the Australia Dibromantin Market, allowing our clients with actionable intelligence and reliable forecasts tailored to emerging regional needs.
Yes, we provide customisation as per your requirements. To learn more, feel free to contact us on sales@6wresearch.com
1 Executive Summary |
2 Introduction |
2.1 Key Highlights of the Report |
2.2 Report Description |
2.3 Market Scope & Segmentation |
2.4 Research Methodology |
2.5 Assumptions |
3 Australia Dibromantin Market Overview |
3.1 Australia Country Macro Economic Indicators |
3.2 Australia Dibromantin Market Revenues & Volume, 2022 & 2032F |
3.3 Australia Dibromantin Market - Industry Life Cycle |
3.4 Australia Dibromantin Market - Porter's Five Forces |
3.5 Australia Dibromantin Market Revenues & Volume Share, By Purity, 2022 & 2032F |
3.6 Australia Dibromantin Market Revenues & Volume Share, By Application, 2022 & 2032F |
4 Australia Dibromantin Market Dynamics |
4.1 Impact Analysis |
4.2 Market Drivers |
4.2.1 Increasing prevalence of chronic diseases in Australia leading to higher demand for pharmaceutical products such as dibromantin |
4.2.2 Growing awareness about the benefits and effectiveness of dibromantin in treating certain medical conditions |
4.2.3 Technological advancements in drug delivery systems enhancing the efficacy and accessibility of dibromantin |
4.3 Market Restraints |
4.3.1 Stringent regulatory requirements and approval processes for pharmaceutical products in Australia |
4.3.2 Presence of alternative treatment options leading to competition for dibromantin |
4.3.3 Potential side effects or adverse reactions associated with dibromantin affecting its market acceptance |
5 Australia Dibromantin Market Trends |
6 Australia Dibromantin Market, By Types |
6.1 Australia Dibromantin Market, By Purity |
6.1.1 Overview and Analysis |
6.1.2 Australia Dibromantin Market Revenues & Volume, By Purity, 2022-2032F |
6.1.3 Australia Dibromantin Market Revenues & Volume, By Purity Of 98%, 2022-2032F |
6.1.4 Australia Dibromantin Market Revenues & Volume, By Purity Greater Than 98%, 2022-2032F |
6.2 Australia Dibromantin Market, By Application |
6.2.1 Overview and Analysis |
6.2.2 Australia Dibromantin Market Revenues & Volume, By Pulp & Paper, 2022-2032F |
6.2.3 Australia Dibromantin Market Revenues & Volume, By Medical Intermediate, 2022-2032F |
6.2.4 Australia Dibromantin Market Revenues & Volume, By Water Treatment, 2022-2032F |
6.2.5 Australia Dibromantin Market Revenues & Volume, By Others, 2022-2032F |
7 Australia Dibromantin Market Import-Export Trade Statistics |
7.1 Australia Dibromantin Market Export to Major Countries |
7.2 Australia Dibromantin Market Imports from Major Countries |
8 Australia Dibromantin Market Key Performance Indicators |
8.1 Patient adherence rate to dibromantin treatment regimen |
8.2 Number of clinical trials demonstrating the efficacy and safety of dibromantin |
8.3 Rate of prescription by healthcare providers for dibromantin compared to alternative medications |
9 Australia Dibromantin Market - Opportunity Assessment |
9.1 Australia Dibromantin Market Opportunity Assessment, By Purity, 2022 & 2032F |
9.2 Australia Dibromantin Market Opportunity Assessment, By Application, 2022 & 2032F |
10 Australia Dibromantin Market - Competitive Landscape |
10.1 Australia Dibromantin Market Revenue Share, By Companies, 2025 |
10.2 Australia Dibromantin Market Competitive Benchmarking, By Operating and Technical Parameters |
11 Company Profiles |
12 Recommendations |
13 Disclaimer |
Global Go To Market Strategy - 2030
Export potential enables firms to identify high-growth global markets with greater confidence by combining advanced trade intelligence with a structured quantitative methodology. The framework analyzes emerging demand trends and country-level import patterns while integrating macroeconomic and trade datasets such as GDP and population forecasts, bilateral import–export flows, tariff structures, elasticity differentials between developed and developing economies, geographic distance, and import demand projections. Using weighted trade values from 2020–2024 as the base period to project country-to-country export potential for 2030, these inputs are operationalized through calculated drivers such as gravity model parameters, tariff impact factors, and projected GDP per-capita growth. Through an analysis of hidden potentials, demand hotspots, and market conditions that are most favorable to success, this method enables firms to focus on target countries, maximize returns, and global expansion with data, backed by accuracy.
By factoring in the projected importer demand gap that is currently unmet and could be potential opportunity, it identifies the potential for the Exporter (Country) among 190 countries, against the general trade analysis, which identifies the biggest importer or exporter.
To discover high-growth global markets and optimize your business strategy:
Click Here
Pricing
- Single User License$ 1,995
- Department License$ 2,400
- Site License$ 3,120
- Global License$ 3,795

Leadership Perspectives from Industry Events
Search
Thought Leadership and Analyst Meet


Our Clients
6WResearch In News
- Doha a strategic location for EV manufacturing hub: IPA Qatar
- Demand for luxury TVs surging in the GCC, says Samsung
- Empowering Growth: The Thriving Journey of Bangladesh’s Cable Industry
- Demand for luxury TVs surging in the GCC, says Samsung
- Video call with a traditional healer? Once unthinkable, it’s now common in South Africa
- Intelligent Buildings To Smooth GCC’s Path To Net Zero
Latest Reports
- New Zealand Aseptic Manufacturing Market (2026-2032)
- Netherlands Aseptic Manufacturing Market (2026-2032)
- Nauru Aseptic Manufacturing Market (2026-2032)
- Namibia Aseptic Manufacturing Market (2026-2032)
- Mozambique Aseptic Manufacturing Market (2026-2032)
- Montenegro Aseptic Manufacturing Market (2026-2032)
- Mongolia Aseptic Manufacturing Market (2026-2032)
- Monaco Aseptic Manufacturing Market (2026-2032)
- Micronesia Aseptic Manufacturing Market (2026-2032)
- Mauritius Aseptic Manufacturing Market (2026-2032)
Industry Events and Analyst Meet

HIMTEX 2026

India Refining Summit 2026

India EV Show 2026

EV tech India Expo 2026

Auto Tech Asia 2026
Whitepaper
- Middle East & Africa Commercial Security Market Click here to view more.
- Middle East & Africa Fire Safety Systems & Equipment Market Click here to view more.
- GCC Drone Market Click here to view more.
- Middle East Lighting Fixture Market Click here to view more.
- GCC Physical & Perimeter Security Market Click here to view more.