Australia Electric Conductors Market (2026-2032) | Value, COVID-19 IMPACT, Trends, Forecast, Outlook, Revenue, Growth, Analysis, Share, Industry, Size & Companies
Market Forecast By Product Types (AAC (All Aluminum Conductor), AAAC (All Aluminum Alloy Conductor), ACSR (Aluminum Conductor Steel Reinforced), ACAR (Aluminum Conductor Aluminum Alloy Reinforced)), By Applications (Power Cables, Transformer, Busbars, Submarine Power Cables) And Competitive Landscape
| Product Code: ETC006355 | Publication Date: Sep 2020 | Updated Date: Jun 2026 | Product Type: Report | |
| Publisher: 6Wresearch | Author: Ravi Bhandari | No. of Pages: 70 | No. of Figures: 35 | No. of Tables: 5 |
Australia Electric Conductors Market Summary
The australia electric conductors market was estimated at USD 219 Million in 2025 and is projected to reach USD 256 Million by 2032, growing at a CAGR of 2.4% from 2026 to 2032.
Australia Electric Conductors Market Year-wise Growth Rate and Key Drivers
This graph highlights how the Australia Electric Conductors Market has steadily grown over the past five years, supported by major growth factors.
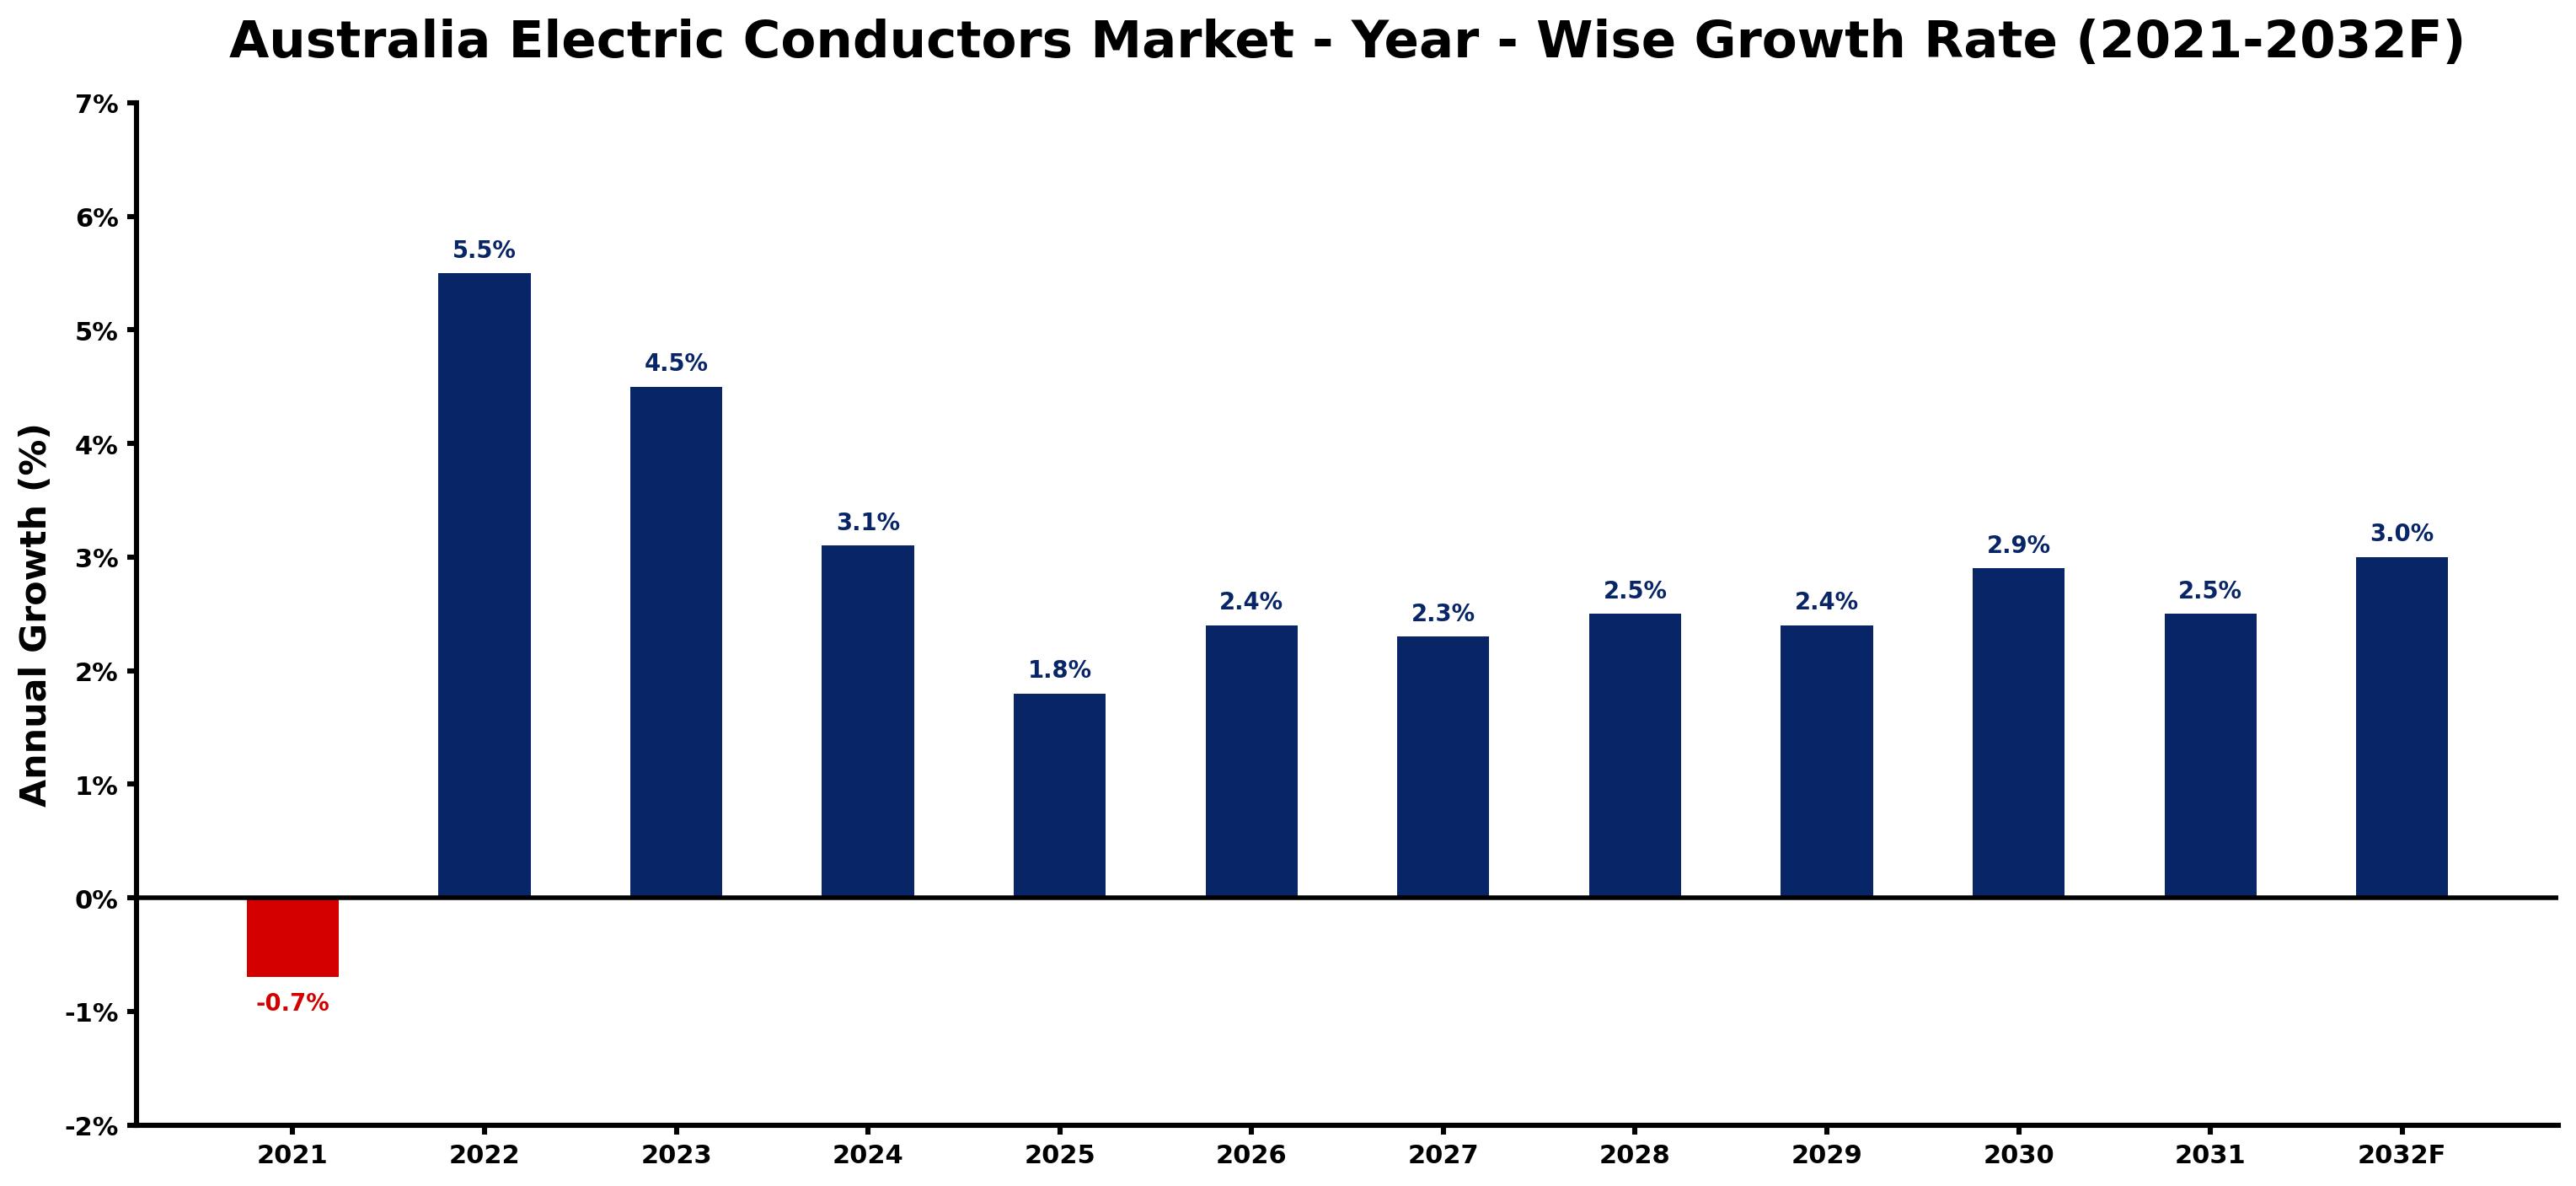
The table below presents the year wise growth rates along with the key drivers influencing the market
| Year | Growth Rate | Major Drivers |
| 2021 | -0.7% | Supply chain disruptions due to pandemicrelated logistics challenges hindered timely project completions in the construction sector. |
| 2022 | 5.5% | Legacy copper grid failures encourage shifts toward more reliable conductor technologies. |
| 2023 | 4.5% | Corporate sustainability goals motivate organizations to invest in electric conductor innovations. |
| 2024 | 3.1% | The construction sector experiences a boom, driving demand for efficient electrical solutions. |
| 2025 | 1.8% | Increased urbanization leads to higher electricity requirements for infrastructure and housing. |
| 2026 | 2.4% | Technological upgrades in renewable energy systems create needs for advanced conductors. |
| 2027 | 2.3% | Automotive electrification trends necessitate the expansion of conductor production capabilities. |
| 2028 | 2.5% | The mining sector's energy needs prompt growth in high-performance conductor applications. |
| 2029 | 2.4% | Smart grid developments require enhanced conductor technologies to ensure system stability. |
| 2030 | 2.9% | Investment in electric vehicle charging infrastructure boosts demand for robust conductors. |
| 2031 | 2.5% | Energy efficiency regulations compel businesses to replace outdated conductors with modern solutions. |
| 2032 | 3.0% | A shift towards decarbonized power generation stimulates innovations in electrical conductor materials. |
Note - Market size estimations and growth projections presented in this report are based on 6Wresearch's advanced forecasting approach, validated with industry datasets as of June 2026.
Australia Electric Conductors Market Synopsis
The Australia Electric Conductors Market is projected to reach 2.4% and witness significant growth during the forecast period (2026-2032). The demand for efficient transmission and distribution of electrical energy is intensifying, driven by urbanization, infrastructural advancements, and the transition toward renewable energy sources. Electric conductors, encompassing various forms of wires and cables, are essential components of Australia's electrical infrastructure, facilitating power delivery to homes, businesses, and significant infrastructure projects.
Australia Electric Conductors Market Growth Drivers
The growth of the Australia Electric Conductors Market is propelled by several key factors:
- The ongoing infrastructure development across Australia is a significant catalyst for the electric conductors market. As the nation prioritizes modernization of its energy grids, there is an increasing need for advanced conductor materials and systems.
- The shift toward renewable energy generation, particularly solar and wind, is creating new requirements for high-quality electric conductors capable of efficiently managing the intricacies of power distribution from these alternative sources.
- Technological advancements, including innovations such as superconductors, are enhancing the efficiency and performance of electric conductors, thereby boosting their adoption in various applications.
- Urbanization trends are leading to increased electricity consumption and infrastructure demands, further elevating the need for reliable and high-capacity electric conductors.
- Increased investment in clean energy initiatives and grid expansion projects are creating a robust demand for electric conductors, ensuring that the infrastructure can adequately support future energy needs.
Australia Electric Conductors Market Challenges and Restraints
Despite the promising growth trajectory, the Australia Electric Conductors Market faces several challenges that may hinder its progress:
- Ensuring efficiency and conductivity remains a substantial challenge as electric vehicles gain prevalence. The requirement for conductors that can handle higher power loads is critical for meeting this emerging demand.
- The reliability and durability of conductors in various environmental conditions present ongoing obstacles. Conductors must withstand extreme weather and other external factors without compromising performance.
- Market fluctuations, influenced by global supply chain issues and material availability, can create uncertainties for stakeholders within the electric conductors sector.
- The need for continuous research and development to keep pace with technological advancements requires significant investment, which may not be feasible for smaller market participants.
- Stringent regulatory compliance and safety standards imposed by government bodies can act as a barrier for new entrants in the market.
Australia Electric Conductors Market Government Investment and Initiatives
Government policies significantly influence the Australia Electric Conductors Market through various initiatives and investments aimed at enhancing energy infrastructure:
- Public spending on infrastructure development is robust, focusing on modernizing electrical grids to increase efficiency and reliability, which directly impacts the demand for electric conductors.
- Policies promoting renewable energy sources are prompting investments in transmission and distribution networks, compelling the market to provide innovative conductor solutions suitable for these systems.
- The Australia's Energy Regulator (AER) plays a pivotal role in establishing electrical safety standards and regulations that govern the quality and reliability of electric conductors.
- Government incentives geared towards sustainability and green technologies are driving the research and development of advanced conductor materials and technologies.
- Trade agreements and policies initiated by the Australian government influence the import and export landscape for electric conductors, shaping market dynamics and competition.
Australia Electric Conductors Market Latest Developments (May 2025 - June 2026)
In recent months from May 2025 to June 2026, the Australia Electric Conductors Market has witnessed notable developments indicating a shift in industry focus:
- There has been a marked increase in public infrastructure projects aimed at upgrading aging electrical grids, which has stimulated demand for high-capacity electric conductors.
- Growing public awareness and government advocacy for renewable energy adoption have led to projects integrating smart grid technologies, enhancing the need for innovative conductor solutions.
- Efforts have intensified to research and develop advanced materials, particularly with regard to increasing the efficiency of electric conductors under demanding operational conditions.
- Collaboration between industry stakeholders and government agencies has strengthened, focusing on the standardization of safety regulations and quality controls for electric conductors.
- New initiatives targeting the electrification of rural and remote areas have emerged, significantly broadening the potential applications of electric conductors in the market.
Australia Electric Conductors Market - Key Attractiveness of the Report
- 10 Years of Market Numbers
- Historical Data Starting from 2022 to 2025
- Base Year: 2025
- Forecast Data until 2032
- Key Performance Indicators Impacting the Market
- Major Upcoming Developments and Projects
Key Highlights of the Report:
- Australia Electric Conductors Market Outlook
- Market Size of Australia Electric Conductors Market, 2025
- Forecast of Australia Electric Conductors Market, 2032
- Historical Data and Forecast of Australia Electric Conductors Revenues & Volume for the Period 2022-2032F
- Australia Electric Conductors Market Trend Evolution
- Australia Electric Conductors Market Drivers and Challenges
- Australia Electric Conductors Price Trends
- Australia Electric Conductors Porter's Five Forces
- Australia Electric Conductors Industry Life Cycle
- Historical Data and Forecast of Australia Electric Conductors Market Revenues & Volume By Product Types for the Period 2022-2032F
- Historical Data and Forecast of Australia Electric Conductors Market Revenues & Volume By AAC (All Aluminum Conductor) for the Period 2022-2032F
- Historical Data and Forecast of Australia Electric Conductors Market Revenues & Volume By AAAC (All Aluminum Alloy Conductor) for the Period 2022-2032F
- Historical Data and Forecast of Australia Electric Conductors Market Revenues & Volume By ACSR (Aluminum Conductor Steel Reinforced) for the Period 2022-2032F
- Historical Data and Forecast of Australia Electric Conductors Market Revenues & Volume By ACAR (Aluminum Conductor Aluminum Alloy Reinforced) for the Period 2022-2032F
- Historical Data and Forecast of Australia Electric Conductors Market Revenues & Volume By Applications for the Period 2022-2032F
- Historical Data and Forecast of Australia Electric Conductors Market Revenues & Volume By Power Cables for the Period 2022-2032F
- Historical Data and Forecast of Australia Electric Conductors Market Revenues & Volume By Transformer for the Period 2022-2032F
- Historical Data and Forecast of Australia Electric Conductors Market Revenues & Volume By Busbars for the Period 2022-2032F
- Historical Data and Forecast of Australia Electric Conductors Market Revenues & Volume By Submarine Power Cables for the Period 2022-2032F
- Australia Electric Conductors Import Export Trade Statistics
- Market Opportunity Assessment By Product Types
- Market Opportunity Assessment By Applications
- Australia Electric Conductors Top Companies Market Share
- Australia Electric Conductors Competitive Benchmarking By Technical and Operational Parameters
- Australia Electric Conductors Company Profiles
- Australia Electric Conductors Key Strategic Recommendations
Frequently Asked Questions About the Market Study (FAQs):
The primary drivers include increased infrastructure investments, the transition to renewable energy sources, and technological advancements in conductor materials.
Government policies and regulations regarding energy infrastructure and safety standards play a crucial role in shaping market dynamics and ensuring reliable supply chains.
The market faces challenges related to the need for improved efficiency and reliability amid growing power demands, as well as compliance with stringent safety regulations.
Recent developments include increased public infrastructure projects, collaborations for regulatory standardization, and initiatives for rural electrification, indicating a promising market trajectory.
6Wresearch actively monitors the Australia Electric Conductors Market and publishes its comprehensive annual report, highlighting emerging trends, growth drivers, revenue analysis, and forecast outlook. Our insights help businesses to make data-backed strategic decisions with ongoing market dynamics. Our analysts track relevent industries related to the Australia Electric Conductors Market, allowing our clients with actionable intelligence and reliable forecasts tailored to emerging regional needs.
Yes, we provide customisation as per your requirements. To learn more, feel free to contact us on sales@6wresearch.com
1 Executive Summary |
2 Introduction |
2.1 Key Highlights of the Report |
2.2 Report Description |
2.3 Market Scope & Segmentation |
2.4 Research Methodology |
2.5 Assumptions |
3 Australia Electric Conductors Market Overview |
3.1 Australia Country Macro Economic Indicators |
3.2 Australia Electric Conductors Market Revenues & Volume, 2022 & 2032F |
3.3 Australia Electric Conductors Market - Industry Life Cycle |
3.4 Australia Electric Conductors Market - Porter's Five Forces |
3.5 Australia Electric Conductors Market Revenues & Volume Share, By Product Types, 2022 & 2032F |
3.6 Australia Electric Conductors Market Revenues & Volume Share, By Applications, 2022 & 2032F |
4 Australia Electric Conductors Market Dynamics |
4.1 Impact Analysis |
4.2 Market Drivers |
4.2.1 Increasing investments in renewable energy projects in Australia |
4.2.2 Growing demand for electricity transmission and distribution infrastructure |
4.2.3 Technological advancements in electric conductors leading to improved efficiency and performance |
4.3 Market Restraints |
4.3.1 Volatility in raw material prices affecting production costs |
4.3.2 Stringent regulations and standards for electrical infrastructure projects |
4.3.3 Competition from alternative materials and technologies in the market |
5 Australia Electric Conductors Market Trends |
6 Australia Electric Conductors Market, By Types |
6.1 Australia Electric Conductors Market, By Product Types |
6.1.1 Overview and Analysis |
6.1.2 Australia Electric Conductors Market Revenues & Volume, By Product Types, 2022-2032F |
6.1.3 Australia Electric Conductors Market Revenues & Volume, By AAC (All Aluminum Conductor), 2022-2032F |
6.1.4 Australia Electric Conductors Market Revenues & Volume, By AAAC (All Aluminum Alloy Conductor), 2022-2032F |
6.1.5 Australia Electric Conductors Market Revenues & Volume, By ACSR (Aluminum Conductor Steel Reinforced), 2022-2032F |
6.1.6 Australia Electric Conductors Market Revenues & Volume, By ACAR (Aluminum Conductor Aluminum Alloy Reinforced), 2022-2032F |
6.2 Australia Electric Conductors Market, By Applications |
6.2.1 Overview and Analysis |
6.2.2 Australia Electric Conductors Market Revenues & Volume, By Power Cables, 2022-2032F |
6.2.3 Australia Electric Conductors Market Revenues & Volume, By Transformer, 2022-2032F |
6.2.4 Australia Electric Conductors Market Revenues & Volume, By Busbars, 2022-2032F |
6.2.5 Australia Electric Conductors Market Revenues & Volume, By Submarine Power Cables, 2022-2032F |
7 Australia Electric Conductors Market Import-Export Trade Statistics |
7.1 Australia Electric Conductors Market Export to Major Countries |
7.2 Australia Electric Conductors Market Imports from Major Countries |
8 Australia Electric Conductors Market Key Performance Indicators |
8.1 Adoption rate of new technologies in electric conductors |
8.2 Investment in research and development for electric conductor materials |
8.3 Percentage of renewable energy projects using electric conductors |
8.4 Average lifespan of electric conductors in infrastructure projects |
8.5 Efficiency improvement in electric conductors over time |
9 Australia Electric Conductors Market - Opportunity Assessment |
9.1 Australia Electric Conductors Market Opportunity Assessment, By Product Types, 2022 & 2032F |
9.2 Australia Electric Conductors Market Opportunity Assessment, By Applications, 2022 & 2032F |
10 Australia Electric Conductors Market - Competitive Landscape |
10.1 Australia Electric Conductors Market Revenue Share, By Companies, 2025 |
10.2 Australia Electric Conductors Market Competitive Benchmarking, By Operating and Technical Parameters |
11 Company Profiles |
12 Recommendations |
13 Disclaimer |
Global Go To Market Strategy - 2030
Export potential enables firms to identify high-growth global markets with greater confidence by combining advanced trade intelligence with a structured quantitative methodology. The framework analyzes emerging demand trends and country-level import patterns while integrating macroeconomic and trade datasets such as GDP and population forecasts, bilateral import–export flows, tariff structures, elasticity differentials between developed and developing economies, geographic distance, and import demand projections. Using weighted trade values from 2020–2024 as the base period to project country-to-country export potential for 2030, these inputs are operationalized through calculated drivers such as gravity model parameters, tariff impact factors, and projected GDP per-capita growth. Through an analysis of hidden potentials, demand hotspots, and market conditions that are most favorable to success, this method enables firms to focus on target countries, maximize returns, and global expansion with data, backed by accuracy.
By factoring in the projected importer demand gap that is currently unmet and could be potential opportunity, it identifies the potential for the Exporter (Country) among 190 countries, against the general trade analysis, which identifies the biggest importer or exporter.
To discover high-growth global markets and optimize your business strategy:
Click Here
Pricing
- Single User License$ 1,995
- Department License$ 2,400
- Site License$ 3,120
- Global License$ 3,795

Leadership Perspectives from Industry Events
Search
Thought Leadership and Analyst Meet


Our Clients
6WResearch In News
- India Air Conditioner Market Set for Strong Rebound in 2026 After Weather-Led Correction and GST-Driven Recovery: 6Wresearch
- ADAS in India: How Automatic Emergency Braking, Blind Spot Detection & Driver Monitoring are Transforming Road Safety
- Doha a strategic location for EV manufacturing hub: IPA Qatar
- Demand for luxury TVs surging in the GCC, says Samsung
- Empowering Growth: The Thriving Journey of Bangladesh’s Cable Industry
- Demand for luxury TVs surging in the GCC, says Samsung
Latest Reports
- Nicaragua RPG Gaming Market (2026-2032)
- New Zealand RPG Gaming Market (2026-2032)
- Netherlands RPG Gaming Market (2026-2032)
- Nauru RPG Gaming Market (2026-2032)
- Namibia RPG Gaming Market (2026-2032)
- Mozambique RPG Gaming Market (2026-2032)
- Montenegro RPG Gaming Market (2026-2032)
- Mongolia RPG Gaming Market (2026-2032)
- Monaco RPG Gaming Market (2026-2032)
- Micronesia RPG Gaming Market (2026-2032)
Industry Events and Analyst Meet

EV India Expo 2026

HIMTEX 2026

India Refining Summit 2026

India EV Show 2026

EV tech India Expo 2026
Whitepaper
- Middle East & Africa Commercial Security Market Click here to view more.
- Middle East & Africa Fire Safety Systems & Equipment Market Click here to view more.
- GCC Drone Market Click here to view more.
- Middle East Lighting Fixture Market Click here to view more.
- GCC Physical & Perimeter Security Market Click here to view more.