Australia Filling Equipment Market (2026-2032) | Companies, Growth, Revenue, Industry, Forecast, Outlook, Value, Trends, Size, Share & Analysis
Market Forecast By Type (Rotary Fillers, Volumetric Fillers, Aseptic Fillers, Net Weight Fillers, Other), By Process (Manual, Semi-Automatic, Automatic), By Applications (Food & Beverage, Pharmaceutical, Cosmetic, Others) And Competitive Landscape
| Product Code: ETC047115 | Publication Date: Jan 2021 | Updated Date: Jun 2026 | Product Type: Report | |
| Publisher: 6Wresearch | Author: Ravi Bhandari | No. of Pages: 70 | No. of Figures: 35 | No. of Tables: 5 |
Australia Filling Equipment Market Size, Share & Growth Rate
The Australia Filling Equipment Market was estimated at USD 229 Million in 2025 and is projected to reach USD 268 Million by 2032, growing at a CAGR of 2.3% from 2026 to 2032. This growth trajectory is significantly influenced by the expanding food and beverage, pharmaceutical, and cosmetics sectors, all of which are increasingly reliant on automated filling solutions to enhance production efficiency and compliance with strict quality standards.
Australia Filling Equipment Market Year-wise Growth Rate and Key Drivers
This graph highlights how the Australia Filling Equipment Market has steadily grown over the years, supported by major growth factors.
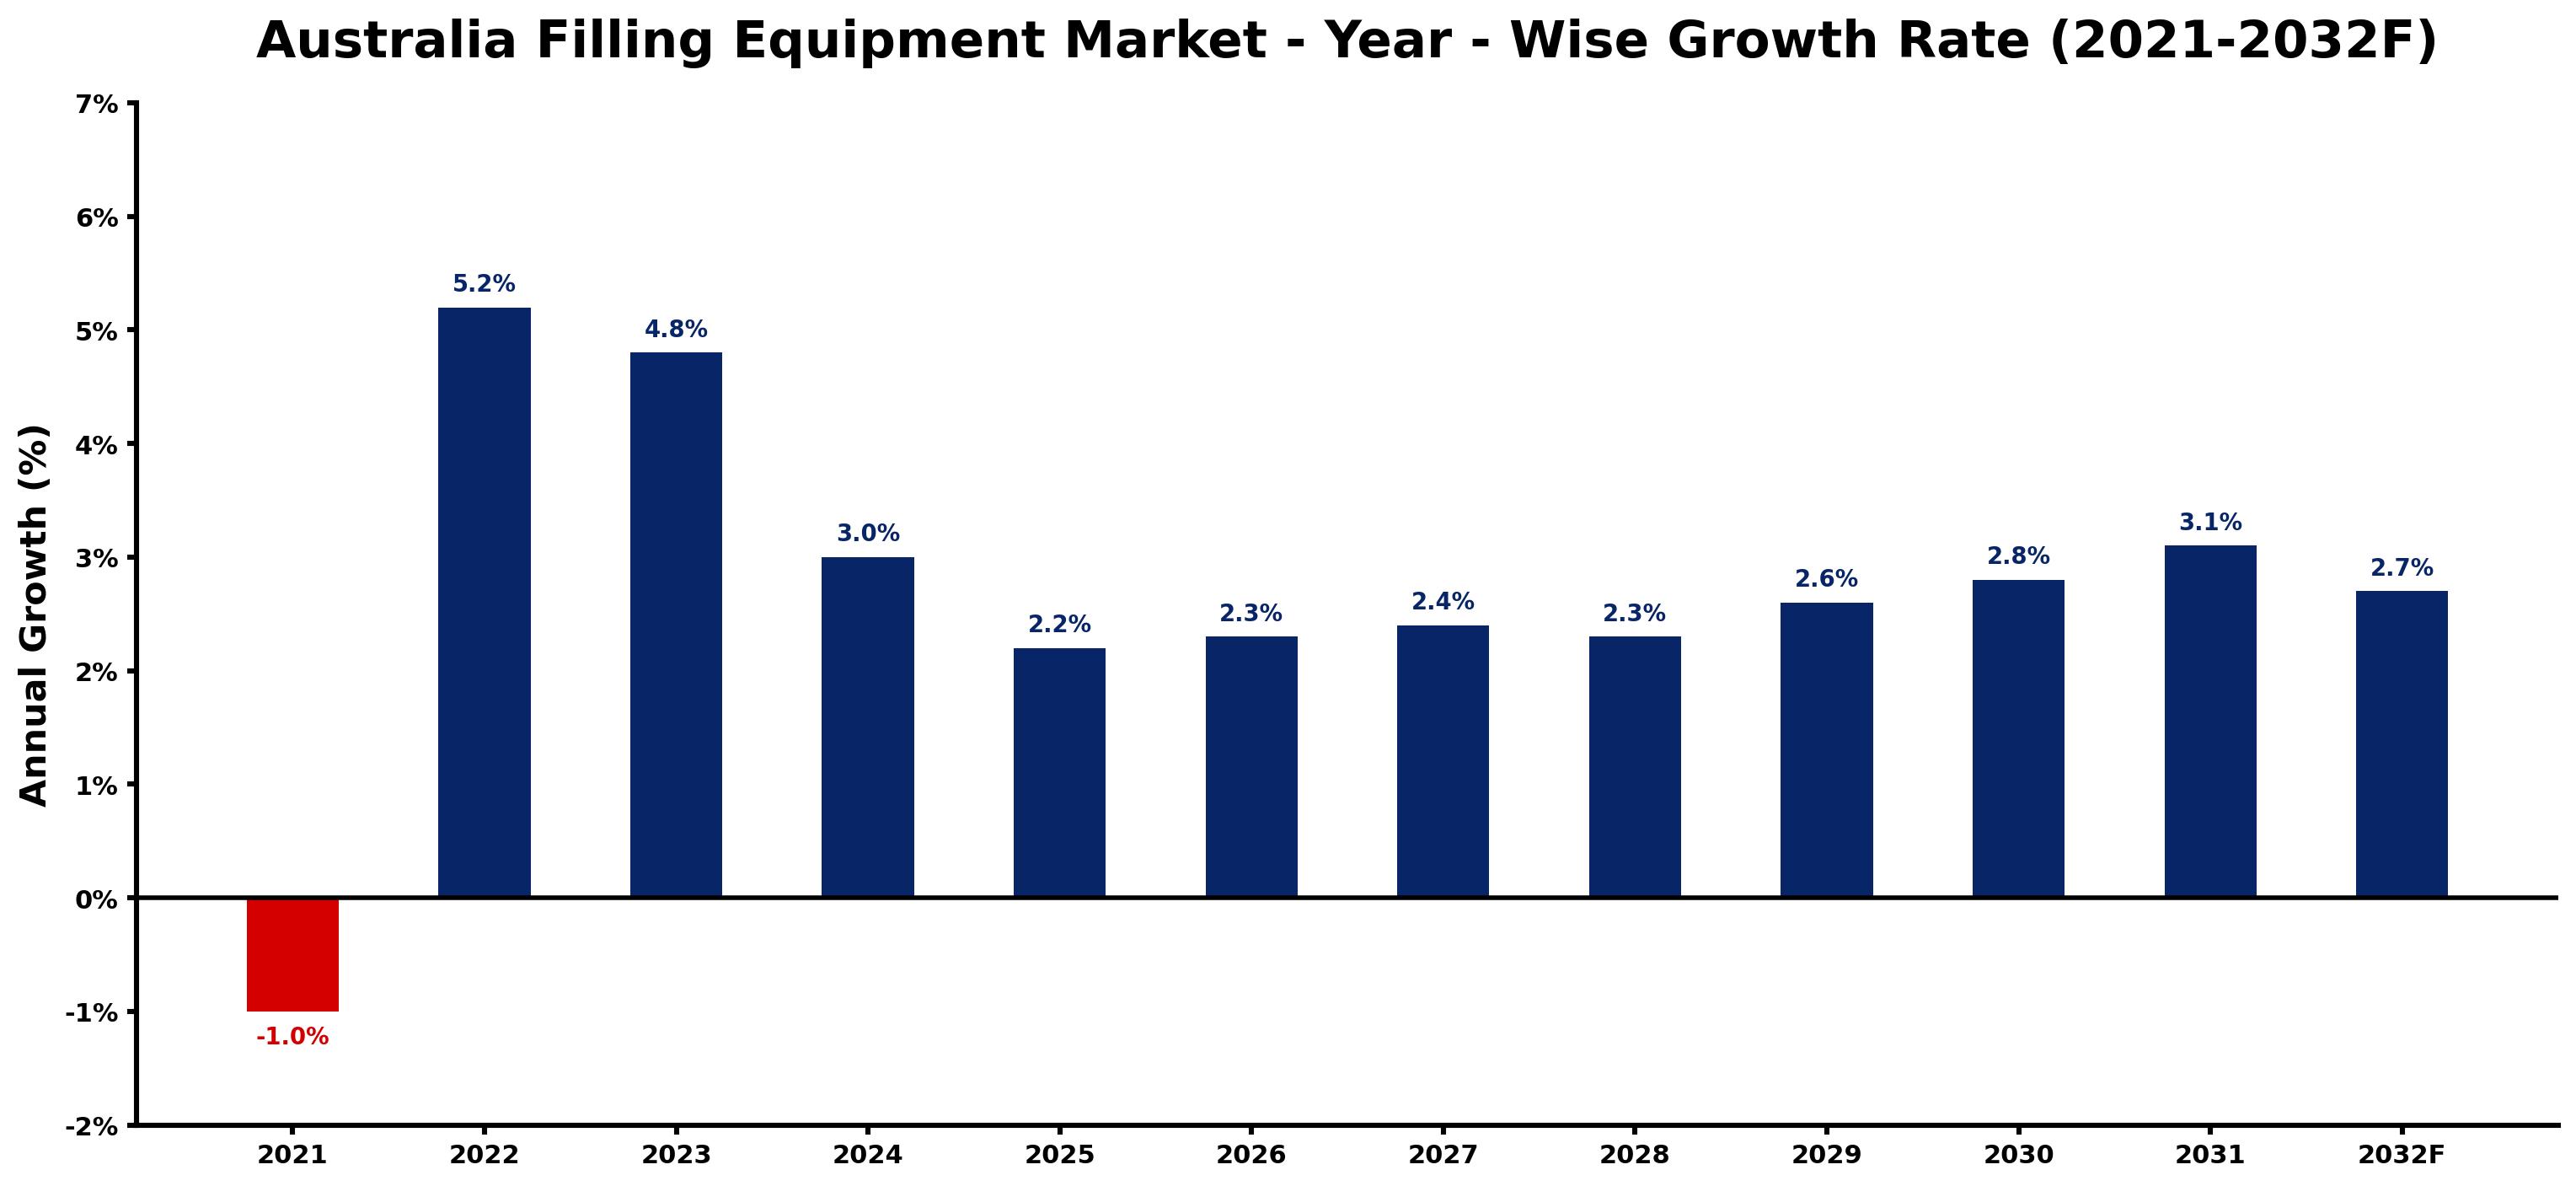
The table below presents the year‑wise growth rates along with the key drivers influencing the market
| Year | Growth Rate | Major Drivers |
| 2021 | -1.0% | Increasing adoption of advanced technologies |
| 2022 | 5.2% | Expansion of commercial construction activities |
| 2023 | 4.8% | Expansion of transportation and logistics networks |
| 2024 | 3.0% | Expansion of commercial construction activities |
| 2025 | 2.2% | Growing urbanization and commercial development |
| 2026 | 2.3% | Expansion of commercial construction activities |
| 2027 | 2.4% | Rising electricity demand across industries |
| 2028 | 2.3% | Increasing industrial infrastructure investments |
| 2029 | 2.6% | Expansion of transportation and logistics networks |
| 2030 | 2.8% | Increasing industrial infrastructure investments |
| 2031 | 3.1% | Expansion of transportation and logistics networks |
| 2032 | 2.7% | Increasing industrial automation investments |
Note - Market size estimations and growth projections presented in this report are based on 6Wresearch’s advanced forecasting approach, validated with industry datasets as of June 2026.
Australia Filling Equipment Market Synopsis
A strong push towards automation is the predominant force shaping the Australia Filling Equipment Market. Industries are seeking to optimize operations, reduce labor costs, and maintain high standards of product integrity, leading to a surge in demand for advanced filling technologies.
Additionally, rigorous government regulations concerning safety and quality in food processing further drive investments in sophisticated filling equipment. Manufacturers are continuously adapting to these compliance demands while striving to innovate their equipment capabilities to accommodate a variety of products and packaging formats.
Australia Filling Equipment Market Key Takeaways
- The market is driven by the rising need for automation in production across multiple sectors.
- Food safety regulations are pushing manufacturers to invest in high-quality filling equipment.
- Challenges include the need for significant capital investment and technical expertise in automation.
- Investment in research and development is crucial for keeping pace with emerging market demands.
- Consumer preference for packaged goods continues to fuel market growth.
Evaluation of Restraints in Australia Filling Equipment Market
Despite the market's promising growth, several constraints persist. The high initial capital investment required for advanced filling technology can deter smaller manufacturers from adopting automation solutions. Furthermore, navigating the complexities of technology integration poses challenges for companies seeking to enhance their filling processes. The need for ongoing maintenance and skilled technical personnel adds to the operational burden. Regulatory compliance, while crucial for product safety, can also complicate operational efficiency as firms strive to meet ever-evolving standards.
Australia Filling Equipment Market Trends
The trend towards smart filling equipment is gaining momentum, with manufacturers increasingly incorporating IoT capabilities into their systems. This innovation allows for real-time monitoring and data collection, enabling improved efficiency and quality control. Furthermore, a shift towards sustainable practices has led to an increase in demand for eco-friendly packaging solutions, influencing the design and functionality of filling equipment.
Australia Filling Equipment Market Opportunities
Significant growth opportunities exist in the burgeoning e-commerce sector, where demand for packaged goods continues to rise. Manufacturers can capitalize on this trend by developing versatile filling solutions that cater to small-batch production and rapid order fulfillment. Additionally, exploring partnerships with emerging food brands and health-conscious product lines can drive innovation and market penetration, as these segments typically prioritize quality and safety in their packaging processes.
Government Initiatives in the Australia Filling Equipment Market
Government policies aimed at enhancing food safety and hygiene standards significantly impact the filling equipment market. Agencies such as the Australia Competition and Consumer Commission (ACCC) and Food Standards Australia New Zealand (FSANZ) enforce rigorous regulations that necessitate the use of compliant machinery. This environment encourages manufacturers to invest in cutting-edge technologies that meet these high standards, ensuring product safety and consumer trust.
Future Insights of the Australia Filling Equipment Market
Looking ahead to 2026-2032, the Australia Filling Equipment Market is poised for continued advancement, driven by technological innovation and the increasing demand for automated solutions. As businesses navigate the challenges of labor shortages and seek to enhance operational efficiency, the adoption of sophisticated filling technologies will likely accelerate. The emphasis on sustainability and compliance will further influence market dynamics, shaping the development of new equipment designed to meet evolving consumer preferences and regulatory requirements.
Australia Filling Equipment Market Latest Developments (May 2025 - June 2026)
In recent months, the industry has witnessed a surge in collaborative efforts aimed at integrating smart technologies into filling processes. Manufacturers are increasingly focusing on developing automated systems that not only enhance productivity but also contribute to sustainability objectives. Furthermore, industry players are gearing up to respond to anticipated regulatory updates that may impact equipment specifications and operational practices.
Australia Filling Equipment Market - Key Attractiveness of the Report
- 10 Years of Market Numbers
- Historical Data Starting from 2022 to 2025
- Base Year: 2025
- Forecast Data until 2032
- Key Performance Indicators Impacting the Market
- Major Upcoming Developments and Projects
Key Highlights of the Report:
- Australia Filling Equipment Market Outlook
- Market Size of Australia Filling Equipment Market, 2025
- Forecast of Australia Filling Equipment Market, 2032
- Historical Data and Forecast of Australia Filling Equipment Revenues & Volume for the Period 2022-2032F
- Australia Filling Equipment Market Trend Evolution
- Australia Filling Equipment Market Drivers and Challenges
- Australia Filling Equipment Price Trends
- Australia Filling Equipment Porter's Five Forces
- Australia Filling Equipment Industry Life Cycle
- Historical Data and Forecast of Australia Filling Equipment Market Revenues & Volume By Type for the Period 2022-2032F
- Historical Data and Forecast of Australia Filling Equipment Market Revenues & Volume By Rotary Fillers for the Period 2022-2032F
- Historical Data and Forecast of Australia Filling Equipment Market Revenues & Volume By Volumetric Fillers for the Period 2022-2032F
- Historical Data and Forecast of Australia Filling Equipment Market Revenues & Volume By Aseptic Fillers for the Period 2022-2032F
- Historical Data and Forecast of Australia Filling Equipment Market Revenues & Volume By Net Weight Fillers for the Period 2022-2032F
- Historical Data and Forecast of Australia Filling Equipment Market Revenues & Volume By Other for the Period 2022-2032F
- Historical Data and Forecast of Australia Filling Equipment Market Revenues & Volume By Process for the Period 2022-2032F
- Historical Data and Forecast of Australia Filling Equipment Market Revenues & Volume By Manual for the Period 2022-2032F
- Historical Data and Forecast of Australia Filling Equipment Market Revenues & Volume By Semi-Automatic for the Period 2022-2032F
- Historical Data and Forecast of Australia Filling Equipment Market Revenues & Volume By Automatic for the Period 2022-2032F
- Historical Data and Forecast of Australia Filling Equipment Market Revenues & Volume By Applications for the Period 2022-2032F
- Historical Data and Forecast of Australia Filling Equipment Market Revenues & Volume By Food & Beverage for the Period 2022-2032F
- Historical Data and Forecast of Australia Filling Equipment Market Revenues & Volume By Pharmaceutical for the Period 2022-2032F
- Historical Data and Forecast of Australia Filling Equipment Market Revenues & Volume By Cosmetic for the Period 2022-2032F
- Historical Data and Forecast of Australia Filling Equipment Market Revenues & Volume By Others for the Period 2022-2032F
- Australia Filling Equipment Import Export Trade Statistics
- Market Opportunity Assessment By Type
- Market Opportunity Assessment By Process
- Market Opportunity Assessment By Applications
- Australia Filling Equipment Top Companies Market Share
- Australia Filling Equipment Competitive Benchmarking By Technical and Operational Parameters
- Australia Filling Equipment Company Profiles
- Australia Filling Equipment Key Strategic Recommendations
Australia Filling Equipment Market - Frequently Asked Questions
The food and beverage, pharmaceutical, and cosmetics sectors are the main drivers of the filling equipment market, as these industries increasingly focus on automation and efficiency.
The market is expected to grow from USD 229 Million in 2025 to USD 268 Million by 2032, reflecting a CAGR of 2.3% from 2026 to 2032.
The integration of IoT capabilities and smart technologies is a notable trend, allowing for real-time monitoring and enhanced efficiency in filling operations.
Yes, agencies like the ACCC and FSANZ enforce strict guidelines that impact the design and function of filling equipment to ensure food safety and hygiene.
Opportunities abound in the e-commerce segment, where rising demand for packaged goods is prompting manufacturers to create versatile filling solutions that cater to diverse production needs.
6Wresearch actively monitors the Australia Filling Equipment Market and publishes its comprehensive annual report, highlighting emerging trends, growth drivers, revenue analysis, and forecast outlook. Our insights help businesses to make data-backed strategic decisions with ongoing market dynamics. Our analysts track relevent industries related to the Australia Filling Equipment Market, allowing our clients with actionable intelligence and reliable forecasts tailored to emerging regional needs.
Yes, we provide customisation as per your requirements. To learn more, feel free to contact us on sales@6wresearch.com
1 Executive Summary |
2 Introduction |
2.1 Key Highlights of the Report |
2.2 Report Description |
2.3 Market Scope & Segmentation |
2.4 Research Methodology |
2.5 Assumptions |
3 Australia Filling Equipment Market Overview |
3.1 Australia Country Macro Economic Indicators |
3.2 Australia Filling Equipment Market Revenues & Volume, 2022 & 2032F |
3.3 Australia Filling Equipment Market - Industry Life Cycle |
3.4 Australia Filling Equipment Market - Porter's Five Forces |
3.5 Australia Filling Equipment Market Revenues & Volume Share, By Type, 2022 & 2032F |
3.6 Australia Filling Equipment Market Revenues & Volume Share, By Process, 2022 & 2032F |
3.7 Australia Filling Equipment Market Revenues & Volume Share, By Applications, 2022 & 2032F |
4 Australia Filling Equipment Market Dynamics |
4.1 Impact Analysis |
4.2 Market Drivers |
4.2.1 Increasing demand for packaged and convenience foods driving the need for efficient filling equipment. |
4.2.2 Growing emphasis on sustainability leading to the adoption of eco-friendly filling equipment. |
4.2.3 Technological advancements in filling equipment improving efficiency and accuracy of filling processes. |
4.3 Market Restraints |
4.3.1 High initial investment costs for purchasing and installing filling equipment. |
4.3.2 Stringent regulations and standards governing the food and beverage industry impacting the adoption of filling equipment. |
4.3.3 Lack of skilled workforce for operating and maintaining filling equipment. |
5 Australia Filling Equipment Market Trends |
6 Australia Filling Equipment Market, By Types |
6.1 Australia Filling Equipment Market, By Type |
6.1.1 Overview and Analysis |
6.1.2 Australia Filling Equipment Market Revenues & Volume, By Type, 2022-2032F |
6.1.3 Australia Filling Equipment Market Revenues & Volume, By Rotary Fillers, 2022-2032F |
6.1.4 Australia Filling Equipment Market Revenues & Volume, By Volumetric Fillers, 2022-2032F |
6.1.5 Australia Filling Equipment Market Revenues & Volume, By Aseptic Fillers, 2022-2032F |
6.1.6 Australia Filling Equipment Market Revenues & Volume, By Net Weight Fillers, 2022-2032F |
6.1.7 Australia Filling Equipment Market Revenues & Volume, By Other, 2022-2032F |
6.2 Australia Filling Equipment Market, By Process |
6.2.1 Overview and Analysis |
6.2.2 Australia Filling Equipment Market Revenues & Volume, By Manual, 2022-2032F |
6.2.3 Australia Filling Equipment Market Revenues & Volume, By Semi-Automatic, 2022-2032F |
6.2.4 Australia Filling Equipment Market Revenues & Volume, By Automatic, 2022-2032F |
6.3 Australia Filling Equipment Market, By Applications |
6.3.1 Overview and Analysis |
6.3.2 Australia Filling Equipment Market Revenues & Volume, By Food & Beverage, 2022-2032F |
6.3.3 Australia Filling Equipment Market Revenues & Volume, By Pharmaceutical, 2022-2032F |
6.3.4 Australia Filling Equipment Market Revenues & Volume, By Cosmetic, 2022-2032F |
6.3.5 Australia Filling Equipment Market Revenues & Volume, By Others, 2022-2032F |
7 Australia Filling Equipment Market Import-Export Trade Statistics |
7.1 Australia Filling Equipment Market Export to Major Countries |
7.2 Australia Filling Equipment Market Imports from Major Countries |
8 Australia Filling Equipment Market Key Performance Indicators |
8.1 Overall equipment effectiveness (OEE) to measure the efficiency of filling equipment. |
8.2 Rate of equipment downtime to assess the reliability of filling equipment. |
8.3 Percentage of product wastage during the filling process to evaluate the effectiveness of the equipment in minimizing waste. |
8.4 Energy consumption of filling equipment to track sustainability efforts. |
8.5 Customer satisfaction scores related to the performance of the filling equipment. |
9 Australia Filling Equipment Market - Opportunity Assessment |
9.1 Australia Filling Equipment Market Opportunity Assessment, By Type, 2022 & 2032F |
9.2 Australia Filling Equipment Market Opportunity Assessment, By Process, 2022 & 2032F |
9.3 Australia Filling Equipment Market Opportunity Assessment, By Applications, 2022 & 2032F |
10 Australia Filling Equipment Market - Competitive Landscape |
10.1 Australia Filling Equipment Market Revenue Share, By Companies, 2025 |
10.2 Australia Filling Equipment Market Competitive Benchmarking, By Operating and Technical Parameters |
11 Company Profiles |
12 Recommendations |
13 Disclaimer |
Global Go To Market Strategy - 2030
Export potential enables firms to identify high-growth global markets with greater confidence by combining advanced trade intelligence with a structured quantitative methodology. The framework analyzes emerging demand trends and country-level import patterns while integrating macroeconomic and trade datasets such as GDP and population forecasts, bilateral import–export flows, tariff structures, elasticity differentials between developed and developing economies, geographic distance, and import demand projections. Using weighted trade values from 2020–2024 as the base period to project country-to-country export potential for 2030, these inputs are operationalized through calculated drivers such as gravity model parameters, tariff impact factors, and projected GDP per-capita growth. Through an analysis of hidden potentials, demand hotspots, and market conditions that are most favorable to success, this method enables firms to focus on target countries, maximize returns, and global expansion with data, backed by accuracy.
By factoring in the projected importer demand gap that is currently unmet and could be potential opportunity, it identifies the potential for the Exporter (Country) among 190 countries, against the general trade analysis, which identifies the biggest importer or exporter.
To discover high-growth global markets and optimize your business strategy:
Click Here
Pricing
- Single User License$ 1,995
- Department License$ 2,400
- Site License$ 3,120
- Global License$ 3,795

Leadership Perspectives from Industry Events
Search
Thought Leadership and Analyst Meet


Our Clients
6WResearch In News
- India Air Conditioner Market Set for Strong Rebound in 2026 After Weather-Led Correction and GST-Driven Recovery: 6Wresearch
- ADAS in India: How Automatic Emergency Braking, Blind Spot Detection & Driver Monitoring are Transforming Road Safety
- Doha a strategic location for EV manufacturing hub: IPA Qatar
- Demand for luxury TVs surging in the GCC, says Samsung
- Empowering Growth: The Thriving Journey of Bangladesh’s Cable Industry
- Demand for luxury TVs surging in the GCC, says Samsung
Latest Reports
- Nicaragua RPG Gaming Market (2026-2032)
- New Zealand RPG Gaming Market (2026-2032)
- Netherlands RPG Gaming Market (2026-2032)
- Nauru RPG Gaming Market (2026-2032)
- Namibia RPG Gaming Market (2026-2032)
- Mozambique RPG Gaming Market (2026-2032)
- Montenegro RPG Gaming Market (2026-2032)
- Mongolia RPG Gaming Market (2026-2032)
- Monaco RPG Gaming Market (2026-2032)
- Micronesia RPG Gaming Market (2026-2032)
Industry Events and Analyst Meet

EV India Expo 2026

HIMTEX 2026

India Refining Summit 2026

India EV Show 2026

EV tech India Expo 2026
Whitepaper
- Middle East & Africa Commercial Security Market Click here to view more.
- Middle East & Africa Fire Safety Systems & Equipment Market Click here to view more.
- GCC Drone Market Click here to view more.
- Middle East Lighting Fixture Market Click here to view more.
- GCC Physical & Perimeter Security Market Click here to view more.