Australia Gin Market Outlook | Industry, Growth, Share, Value, Companies, Forecast, Analysis, Size, Revenue, Trends & COVID-19 IMPACT
Market Forecast By Product Type (London Dry Gin, Plymouth Gin, Genever/Dutch Gin, Old Tim Gin, New American Gin), By Production Method (Pot Distilled Gin, Column Distilled Gin, Compound Gin), By Distribution Channel (Hypermarkets and Supermarkets, Specialty Stores, Drug Stores, Online Channel, HoReCa, Others) And Competitive Landscape
| Product Code: ETC127343 | Publication Date: Jun 2021 | Updated Date: Jan 2026 | Product Type: Report | |
| Publisher: 6Wresearch | Author: Ravi Bhandari | No. of Pages: 70 | No. of Figures: 35 | No. of Tables: 5 |
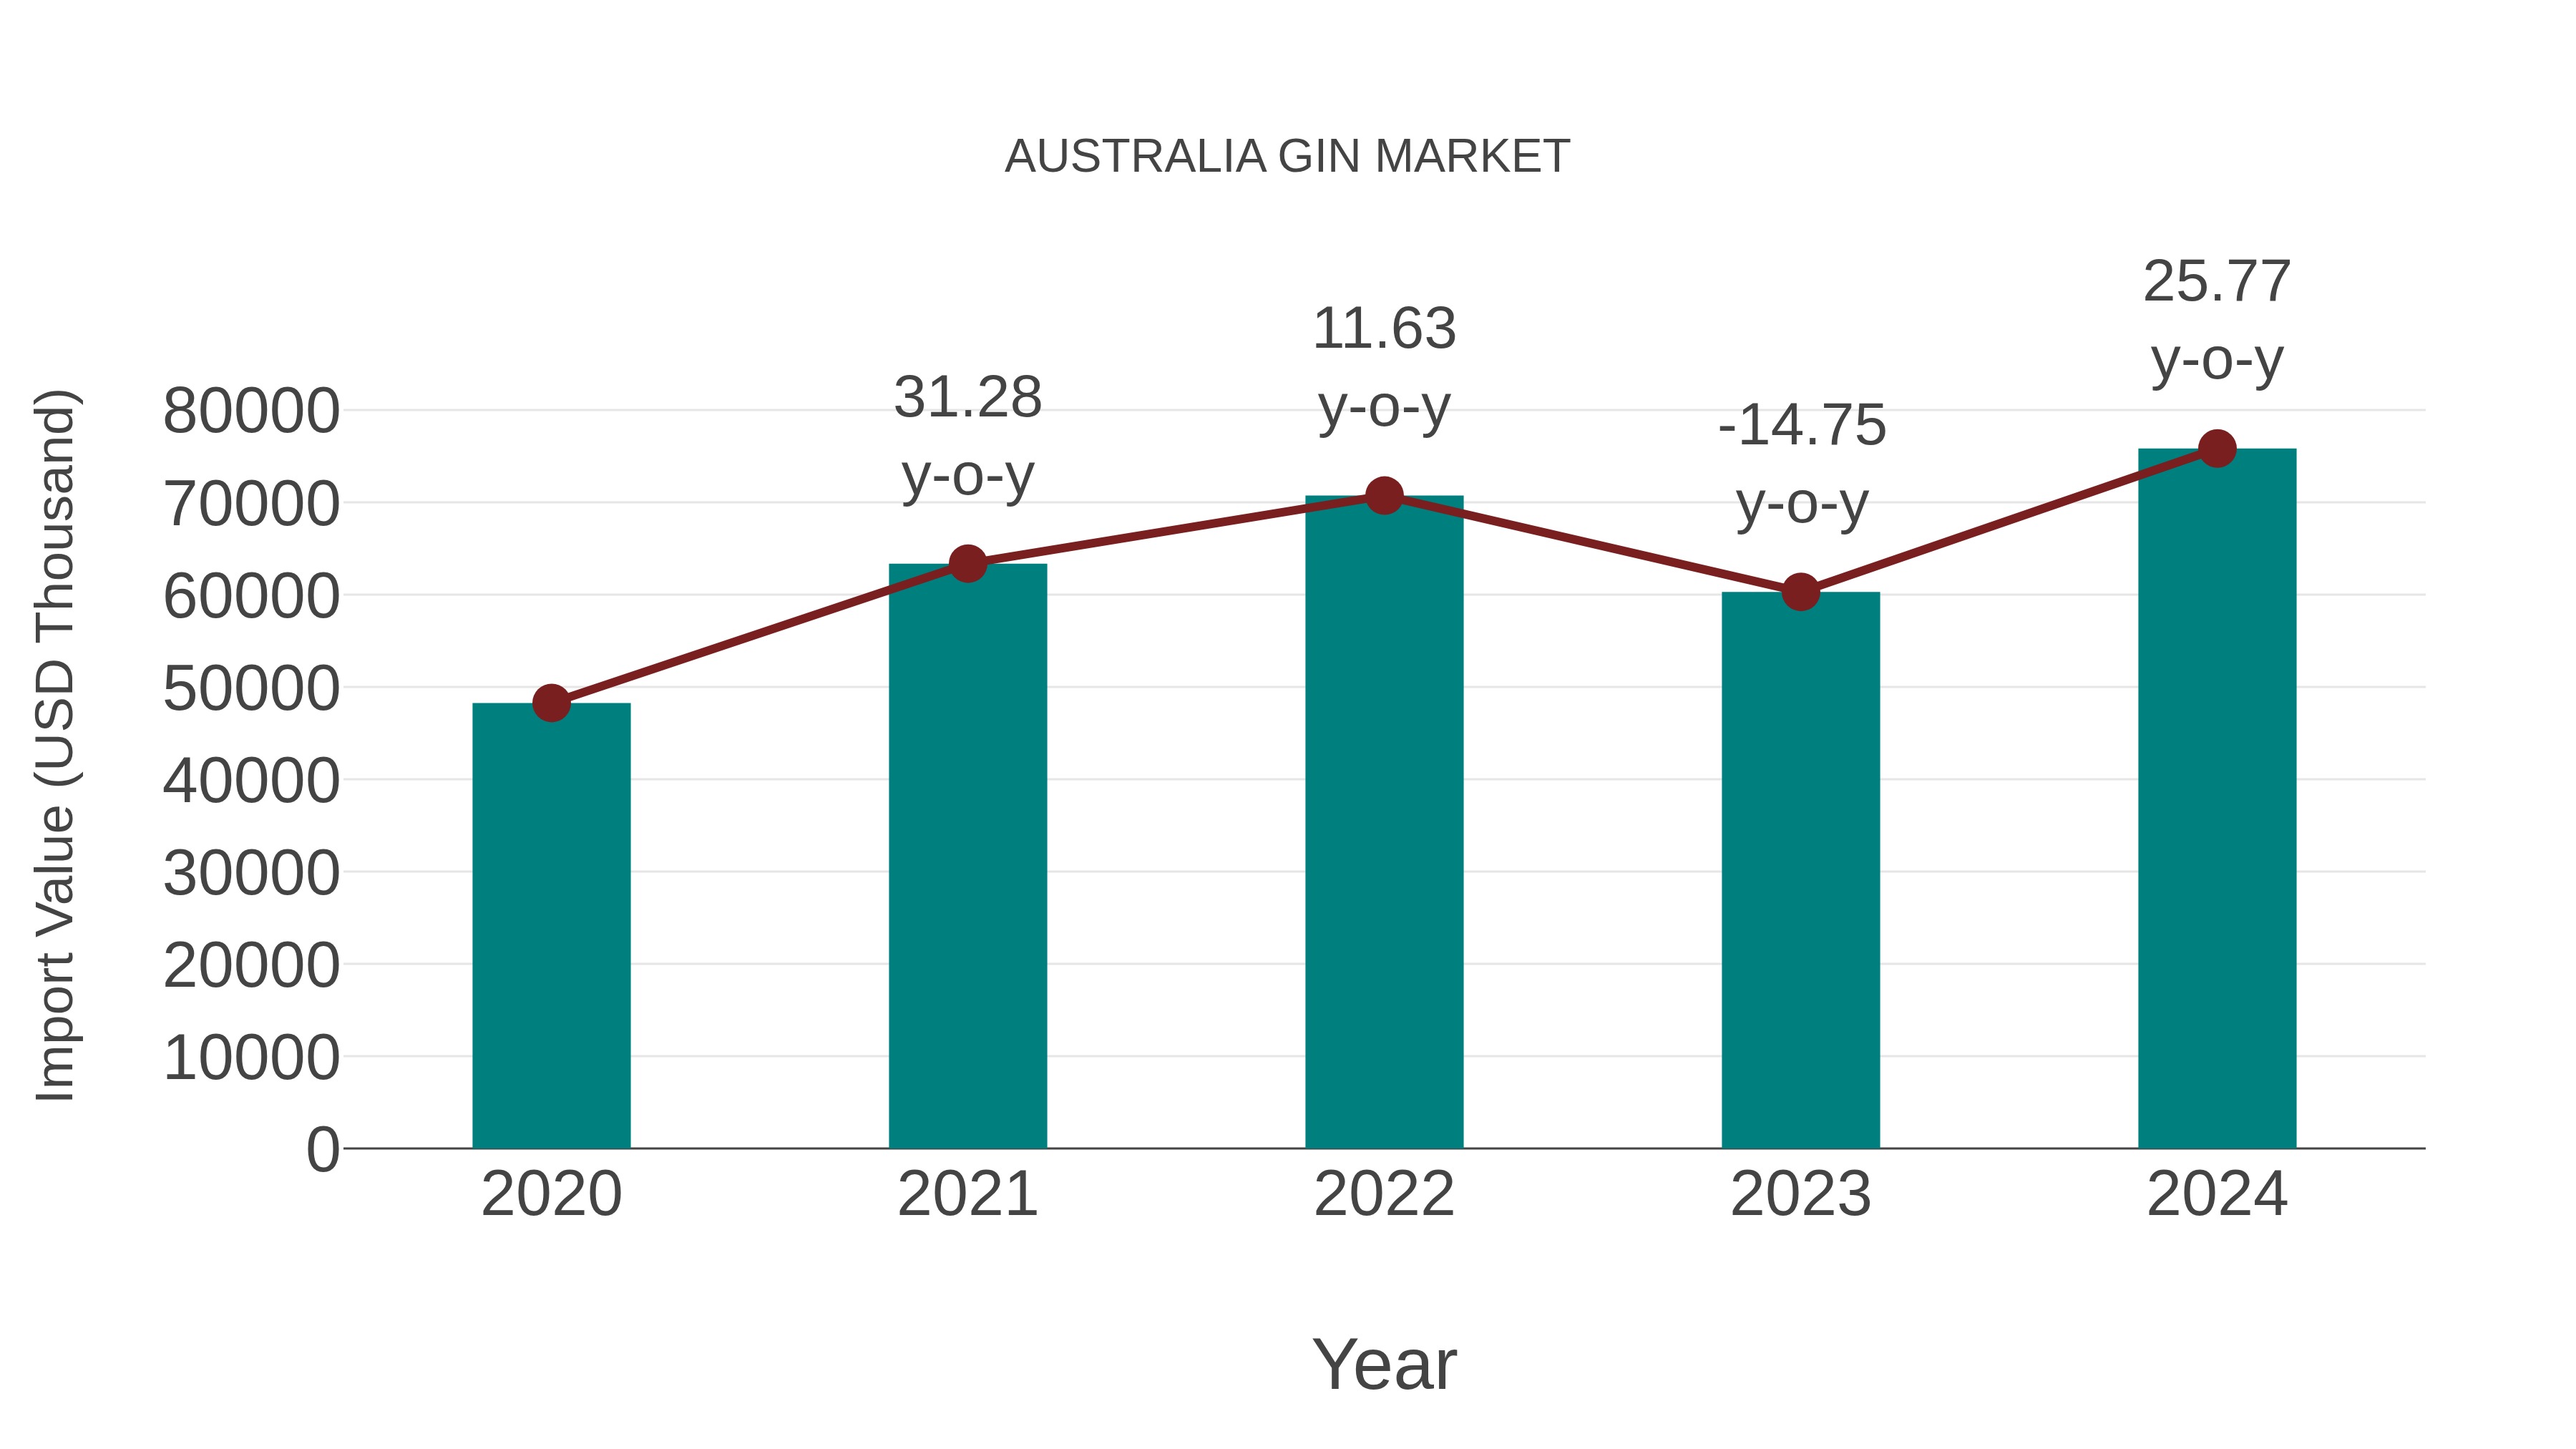
Australia Gin Market: Import Trend Analysis
In the Australia gin market, the import trend showed significant growth from 2023 to 2024, with a growth rate of 25.77%. The compound annual growth rate (CAGR) for imports between 2020 and 2024 stood at 11.96%. This surge in imports could be attributed to shifting consumer preferences towards premium gin products, indicating a notable demand shift in the market.
Australia Gin Market Overview
The gin market in Australia has experienced a renaissance in recent years, with a surge in craft distilleries and a growing appreciation for botanical-infused spirits. Consumers are drawn to the diversity of flavors and the artisanal nature of small-batch production.
Drivers of the market
The gin market in Australia is witnessing a surge in demand fueled by changing consumer preferences and the popularity of craft spirits. Consumers are increasingly drawn to the versatility of gin, which lends itself well to a variety of cocktails and flavor profiles. The rise of boutique distilleries and the artisanal gin movement has led to a proliferation of unique and small-batch products, catering to discerning consumers seeking quality and innovation in their spirits.
Challenges of the market
Despite experiencing a surge in popularity, the gin market in Australia faces challenges such as market saturation and competition from established brands. New entrants must distinguish themselves through innovative flavors, branding, and storytelling to capture consumer attention amidst a crowded market landscape. Regulatory hurdles and compliance requirements also pose challenges, particularly for small-scale producers seeking to enter the market. Building brand loyalty and expanding distribution channels are critical strategies for success in the competitive Australia gin market.
Government Policy of the market
The Australia government regulates the production, distribution, and marketing of alcoholic beverages, including gin. Licensing requirements, taxation policies, and advertising restrictions are implemented to ensure responsible consumption and fair competition in the market. Additionally, agricultural policies impacting the production of botanicals used in gin may have implications for market participants.
Key Highlights of the Report:
- Australia Gin Market Outlook
- Market Size of Australia Gin Market, 2024
- Forecast of Australia Gin Market, 2031
- Historical Data and Forecast of Australia Gin Revenues & Volume for the Period 2018 - 2031
- Australia Gin Market Trend Evolution
- Australia Gin Market Drivers and Challenges
- Australia Gin Price Trends
- Australia Gin Porter's Five Forces
- Australia Gin Industry Life Cycle
- Historical Data and Forecast of Australia Gin Market Revenues & Volume By Product Type for the Period 2018 - 2031
- Historical Data and Forecast of Australia Gin Market Revenues & Volume By London Dry Gin for the Period 2018 - 2031
- Historical Data and Forecast of Australia Gin Market Revenues & Volume By Plymouth Gin for the Period 2018 - 2031
- Historical Data and Forecast of Australia Gin Market Revenues & Volume By Genever/Dutch Gin for the Period 2018 - 2031
- Historical Data and Forecast of Australia Gin Market Revenues & Volume By Old Tim Gin for the Period 2018 - 2031
- Historical Data and Forecast of Australia Gin Market Revenues & Volume By New American Gin for the Period 2018 - 2031
- Historical Data and Forecast of Australia Gin Market Revenues & Volume By Production Method for the Period 2018 - 2031
- Historical Data and Forecast of Australia Gin Market Revenues & Volume By Pot Distilled Gin for the Period 2018 - 2031
- Historical Data and Forecast of Australia Gin Market Revenues & Volume By Column Distilled Gin for the Period 2018 - 2031
- Historical Data and Forecast of Australia Gin Market Revenues & Volume By Compound Gin for the Period 2018 - 2031
- Historical Data and Forecast of Australia Gin Market Revenues & Volume By Distribution Channel for the Period 2018 - 2031
- Historical Data and Forecast of Australia Gin Market Revenues & Volume By Hypermarkets and Supermarkets for the Period 2018 - 2031
- Historical Data and Forecast of Australia Gin Market Revenues & Volume By Specialty Stores for the Period 2018 - 2031
- Historical Data and Forecast of Australia Gin Market Revenues & Volume By Drug Stores for the Period 2018 - 2031
- Historical Data and Forecast of Australia Gin Market Revenues & Volume By Online Channel for the Period 2018 - 2031
- Historical Data and Forecast of Australia Gin Market Revenues & Volume By HoReCa for the Period 2018 - 2031
- Historical Data and Forecast of Australia Gin Market Revenues & Volume By Others for the Period 2018 - 2031
- Australia Gin Import Export Trade Statistics
- Market Opportunity Assessment By Product Type
- Market Opportunity Assessment By Production Method
- Market Opportunity Assessment By Distribution Channel
- Australia Gin Top Companies Market Share
- Australia Gin Competitive Benchmarking By Technical and Operational Parameters
- Australia Gin Company Profiles
- Australia Gin Key Strategic Recommendations
Frequently Asked Questions About the Market Study (FAQs):
6Wresearch actively monitors the Australia Gin Market and publishes its comprehensive annual report, highlighting emerging trends, growth drivers, revenue analysis, and forecast outlook. Our insights help businesses to make data-backed strategic decisions with ongoing market dynamics. Our analysts track relevent industries related to the Australia Gin Market, allowing our clients with actionable intelligence and reliable forecasts tailored to emerging regional needs.
Yes, we provide customisation as per your requirements. To learn more, feel free to contact us on sales@6wresearch.com
Australia Gin |
1 Executive Summary |
2 Introduction |
2.1 Key Highlights of the Report |
2.2 Report Description |
2.3 Market Scope & Segmentation |
2.4 Research Methodology |
2.5 Assumptions |
3 Australia Gin Market Overview |
3.1 Australia Country Macro Economic Indicators |
3.2 Australia Gin Market Revenues & Volume, 2021 & 2031F |
3.3 Australia Gin Market - Industry Life Cycle |
3.4 Australia Gin Market - Porter's Five Forces |
3.5 Australia Gin Market Revenues & Volume Share, By Product Type, 2021 & 2031F |
3.6 Australia Gin Market Revenues & Volume Share, By Production Method, 2021 & 2031F |
3.7 Australia Gin Market Revenues & Volume Share, By Distribution Channel, 2021 & 2031F |
4 Australia Gin Market Dynamics |
4.1 Impact Analysis |
4.2 Market Drivers |
4.2.1 Increasing consumer interest in craft spirits and premium beverages |
4.2.2 Growing popularity of gin-based cocktails and mixology culture |
4.2.3 Innovation in gin flavors and botanicals |
4.2.4 Rising demand for locally produced and artisanal gins |
4.3 Market Restraints |
4.3.1 Regulatory challenges related to alcohol production and distribution |
4.3.2 Competition from other spirit categories such as vodka and whisky |
4.3.3 Fluctuating raw material costs for gin production |
4.3.4 Health and wellness trends impacting alcohol consumption patterns |
5 Australia Gin Market Trends |
6 Australia Gin Market, By Types |
6.1 Australia Gin Market, By Product Type |
6.1.1 Overview and Analysis |
6.1.2 Australia Gin Market Revenues & Volume, By Product Type, 2021-2031F |
6.1.3 Australia Gin Market Revenues & Volume, By London Dry Gin, 2021-2031F |
6.1.4 Australia Gin Market Revenues & Volume, By Plymouth Gin, 2021-2031F |
6.1.5 Australia Gin Market Revenues & Volume, By Genever/Dutch Gin, 2021-2031F |
6.1.6 Australia Gin Market Revenues & Volume, By Old Tim Gin, 2021-2031F |
6.1.7 Australia Gin Market Revenues & Volume, By New American Gin, 2021-2031F |
6.2 Australia Gin Market, By Production Method |
6.2.1 Overview and Analysis |
6.2.2 Australia Gin Market Revenues & Volume, By Pot Distilled Gin, 2021-2031F |
6.2.3 Australia Gin Market Revenues & Volume, By Column Distilled Gin, 2021-2031F |
6.2.4 Australia Gin Market Revenues & Volume, By Compound Gin, 2021-2031F |
6.3 Australia Gin Market, By Distribution Channel |
6.3.1 Overview and Analysis |
6.3.2 Australia Gin Market Revenues & Volume, By Hypermarkets and Supermarkets, 2021-2031F |
6.3.3 Australia Gin Market Revenues & Volume, By Specialty Stores, 2021-2031F |
6.3.4 Australia Gin Market Revenues & Volume, By Drug Stores, 2021-2031F |
6.3.5 Australia Gin Market Revenues & Volume, By Online Channel, 2021-2031F |
6.3.6 Australia Gin Market Revenues & Volume, By HoReCa, 2021-2031F |
6.3.7 Australia Gin Market Revenues & Volume, By Others, 2021-2031F |
7 Australia Gin Market Import-Export Trade Statistics |
7.1 Australia Gin Market Export to Major Countries |
7.2 Australia Gin Market Imports from Major Countries |
8 Australia Gin Market Key Performance Indicators |
8.1 Number of new gin product launches in the market |
8.2 Growth in the number of gin distilleries or craft gin producers |
8.3 Social media engagement and buzz around gin brands |
8.4 Participation in gin tasting events or festivals |
8.5 Number of gin bars or specialized cocktail bars opening in key cities |
9 Australia Gin Market - Opportunity Assessment |
9.1 Australia Gin Market Opportunity Assessment, By Product Type, 2021 & 2031F |
9.2 Australia Gin Market Opportunity Assessment, By Production Method, 2021 & 2031F |
9.3 Australia Gin Market Opportunity Assessment, By Distribution Channel, 2021 & 2031F |
10 Australia Gin Market - Competitive Landscape |
10.1 Australia Gin Market Revenue Share, By Companies, 2024 |
10.2 Australia Gin Market Competitive Benchmarking, By Operating and Technical Parameters |
11 Company Profiles |
12 Recommendations |
13 Disclaimer |
Export potential assessment - trade Analytics for 2030
Export potential enables firms to identify high-growth global markets with greater confidence by combining advanced trade intelligence with a structured quantitative methodology. The framework analyzes emerging demand trends and country-level import patterns while integrating macroeconomic and trade datasets such as GDP and population forecasts, bilateral import–export flows, tariff structures, elasticity differentials between developed and developing economies, geographic distance, and import demand projections. Using weighted trade values from 2020–2024 as the base period to project country-to-country export potential for 2030, these inputs are operationalized through calculated drivers such as gravity model parameters, tariff impact factors, and projected GDP per-capita growth. Through an analysis of hidden potentials, demand hotspots, and market conditions that are most favorable to success, this method enables firms to focus on target countries, maximize returns, and global expansion with data, backed by accuracy.
By factoring in the projected importer demand gap that is currently unmet and could be potential opportunity, it identifies the potential for the Exporter (Country) among 190 countries, against the general trade analysis, which identifies the biggest importer or exporter.
To discover high-growth global markets and optimize your business strategy:
Click Here
Pricing
- Single User License$ 1,995
- Department License$ 2,400
- Site License$ 3,120
- Global License$ 3,795

Search
Thought Leadership and Analyst Meet


Our Clients
Related Reports
- India Switchgear Market Outlook (2026 - 2032) | Size, Share, Trends, Growth, Revenue, Forecast, Analysis, Value, Outlook
- Pakistan Contraceptive Implants Market (2025-2031) | Demand, Growth, Size, Share, Industry, Pricing Analysis, Competitive, Strategic Insights, Strategy, Consumer Insights, Analysis, Investment Trends, Opportunities, Revenue, Segments, Value, Segmentation, Supply, Forecast, Restraints, Outlook, Competition, Drivers, Trends, Companies, Challenges
- Sri Lanka Packaging Market (2026-2032) | Outlook, Competition, Drivers, Trends, Demand, Pricing Analysis, Competitive, Strategic Insights, Companies, Challenges, Strategy, Consumer Insights, Analysis, Investment Trends, Opportunities, Growth, Size, Share, Industry, Revenue, Segments, Value, Segmentation, Supply, Forecast, Restraints
- India Kids Watches Market (2026-2032) | Strategy, Consumer Insights, Analysis, Investment Trends, Opportunities, Growth, Size, Share, Industry, Revenue, Segments, Value, Segmentation, Supply, Forecast, Restraints, Outlook, Competition, Drivers, Trends, Demand, Pricing Analysis, Competitive, Strategic Insights, Companies, Challenges
- Saudi Arabia Core Assurance Service Market (2025-2031) | Strategy, Consumer Insights, Analysis, Investment Trends, Opportunities, Growth, Size, Share, Industry, Revenue, Segments, Value, Segmentation, Supply, Forecast, Restraints, Outlook, Competition, Drivers, Trends, Demand, Pricing Analysis, Competitive, Strategic Insights, Companies, Challenges
- Romania Uninterruptible Power Supply (UPS) Market (2026-2032) | Industry, Analysis, Revenue, Size, Forecast, Outlook, Value, Trends, Share, Growth & Companies
- Saudi Arabia Car Window Tinting Film, Paint Protection Film (PPF), and Ceramic Coating Market (2025-2031) | Strategy, Consumer Insights, Analysis, Investment Trends, Opportunities, Growth, Size, Share, Industry, Revenue, Segments, Value, Segmentation, Supply, Forecast, Restraints, Outlook, Competition, Drivers, Trends, Demand, Pricing Analysis, Competitive, Strategic Insights, Companies, Challenges
- South Africa Stationery Market (2025-2031) | Share, Size, Industry, Value, Growth, Revenue, Analysis, Trends, Segmentation & Outlook
- Afghanistan Rocking Chairs And Adirondack Chairs Market (2026-2032) | Size & Revenue, Competitive Landscape, Share, Segmentation, Industry, Value, Outlook, Analysis, Trends, Growth, Forecast, Companies
- Afghanistan Apparel Market (2026-2032) | Growth, Outlook, Industry, Segmentation, Forecast, Size, Companies, Trends, Value, Share, Analysis & Revenue
Industry Events and Analyst Meet

India EV Show 2026

EV tech India Expo 2026

Auto Tech Asia 2026

Battery Tech India 2026

Smart Production Solutions Guangzhou 2026
Whitepaper
- Middle East & Africa Commercial Security Market Click here to view more.
- Middle East & Africa Fire Safety Systems & Equipment Market Click here to view more.
- GCC Drone Market Click here to view more.
- Middle East Lighting Fixture Market Click here to view more.
- GCC Physical & Perimeter Security Market Click here to view more.
6WResearch In News
- Doha a strategic location for EV manufacturing hub: IPA Qatar
- Demand for luxury TVs surging in the GCC, says Samsung
- Empowering Growth: The Thriving Journey of Bangladesh’s Cable Industry
- Demand for luxury TVs surging in the GCC, says Samsung
- Video call with a traditional healer? Once unthinkable, it’s now common in South Africa
- Intelligent Buildings To Smooth GCC’s Path To Net Zero