Australia Glass Bottles and Containers Market (2026-2032) Outlook | Value, Analysis, Trends, Share, Forecast, Size, Companies, Revenue, Industry & Growth
Market Forecast By End-user (Bevarages, Food, Cosmetics, Pharmaceutical, Others) And Competitive Landscape
| Product Code: ETC215027 | Publication Date: May 2022 | Updated Date: Mar 2026 | Product Type: Market Research Report | |
| Publisher: 6Wresearch | Author: Ravi Bhandari | No. of Pages: 60 | No. of Figures: 40 | No. of Tables: 7 |
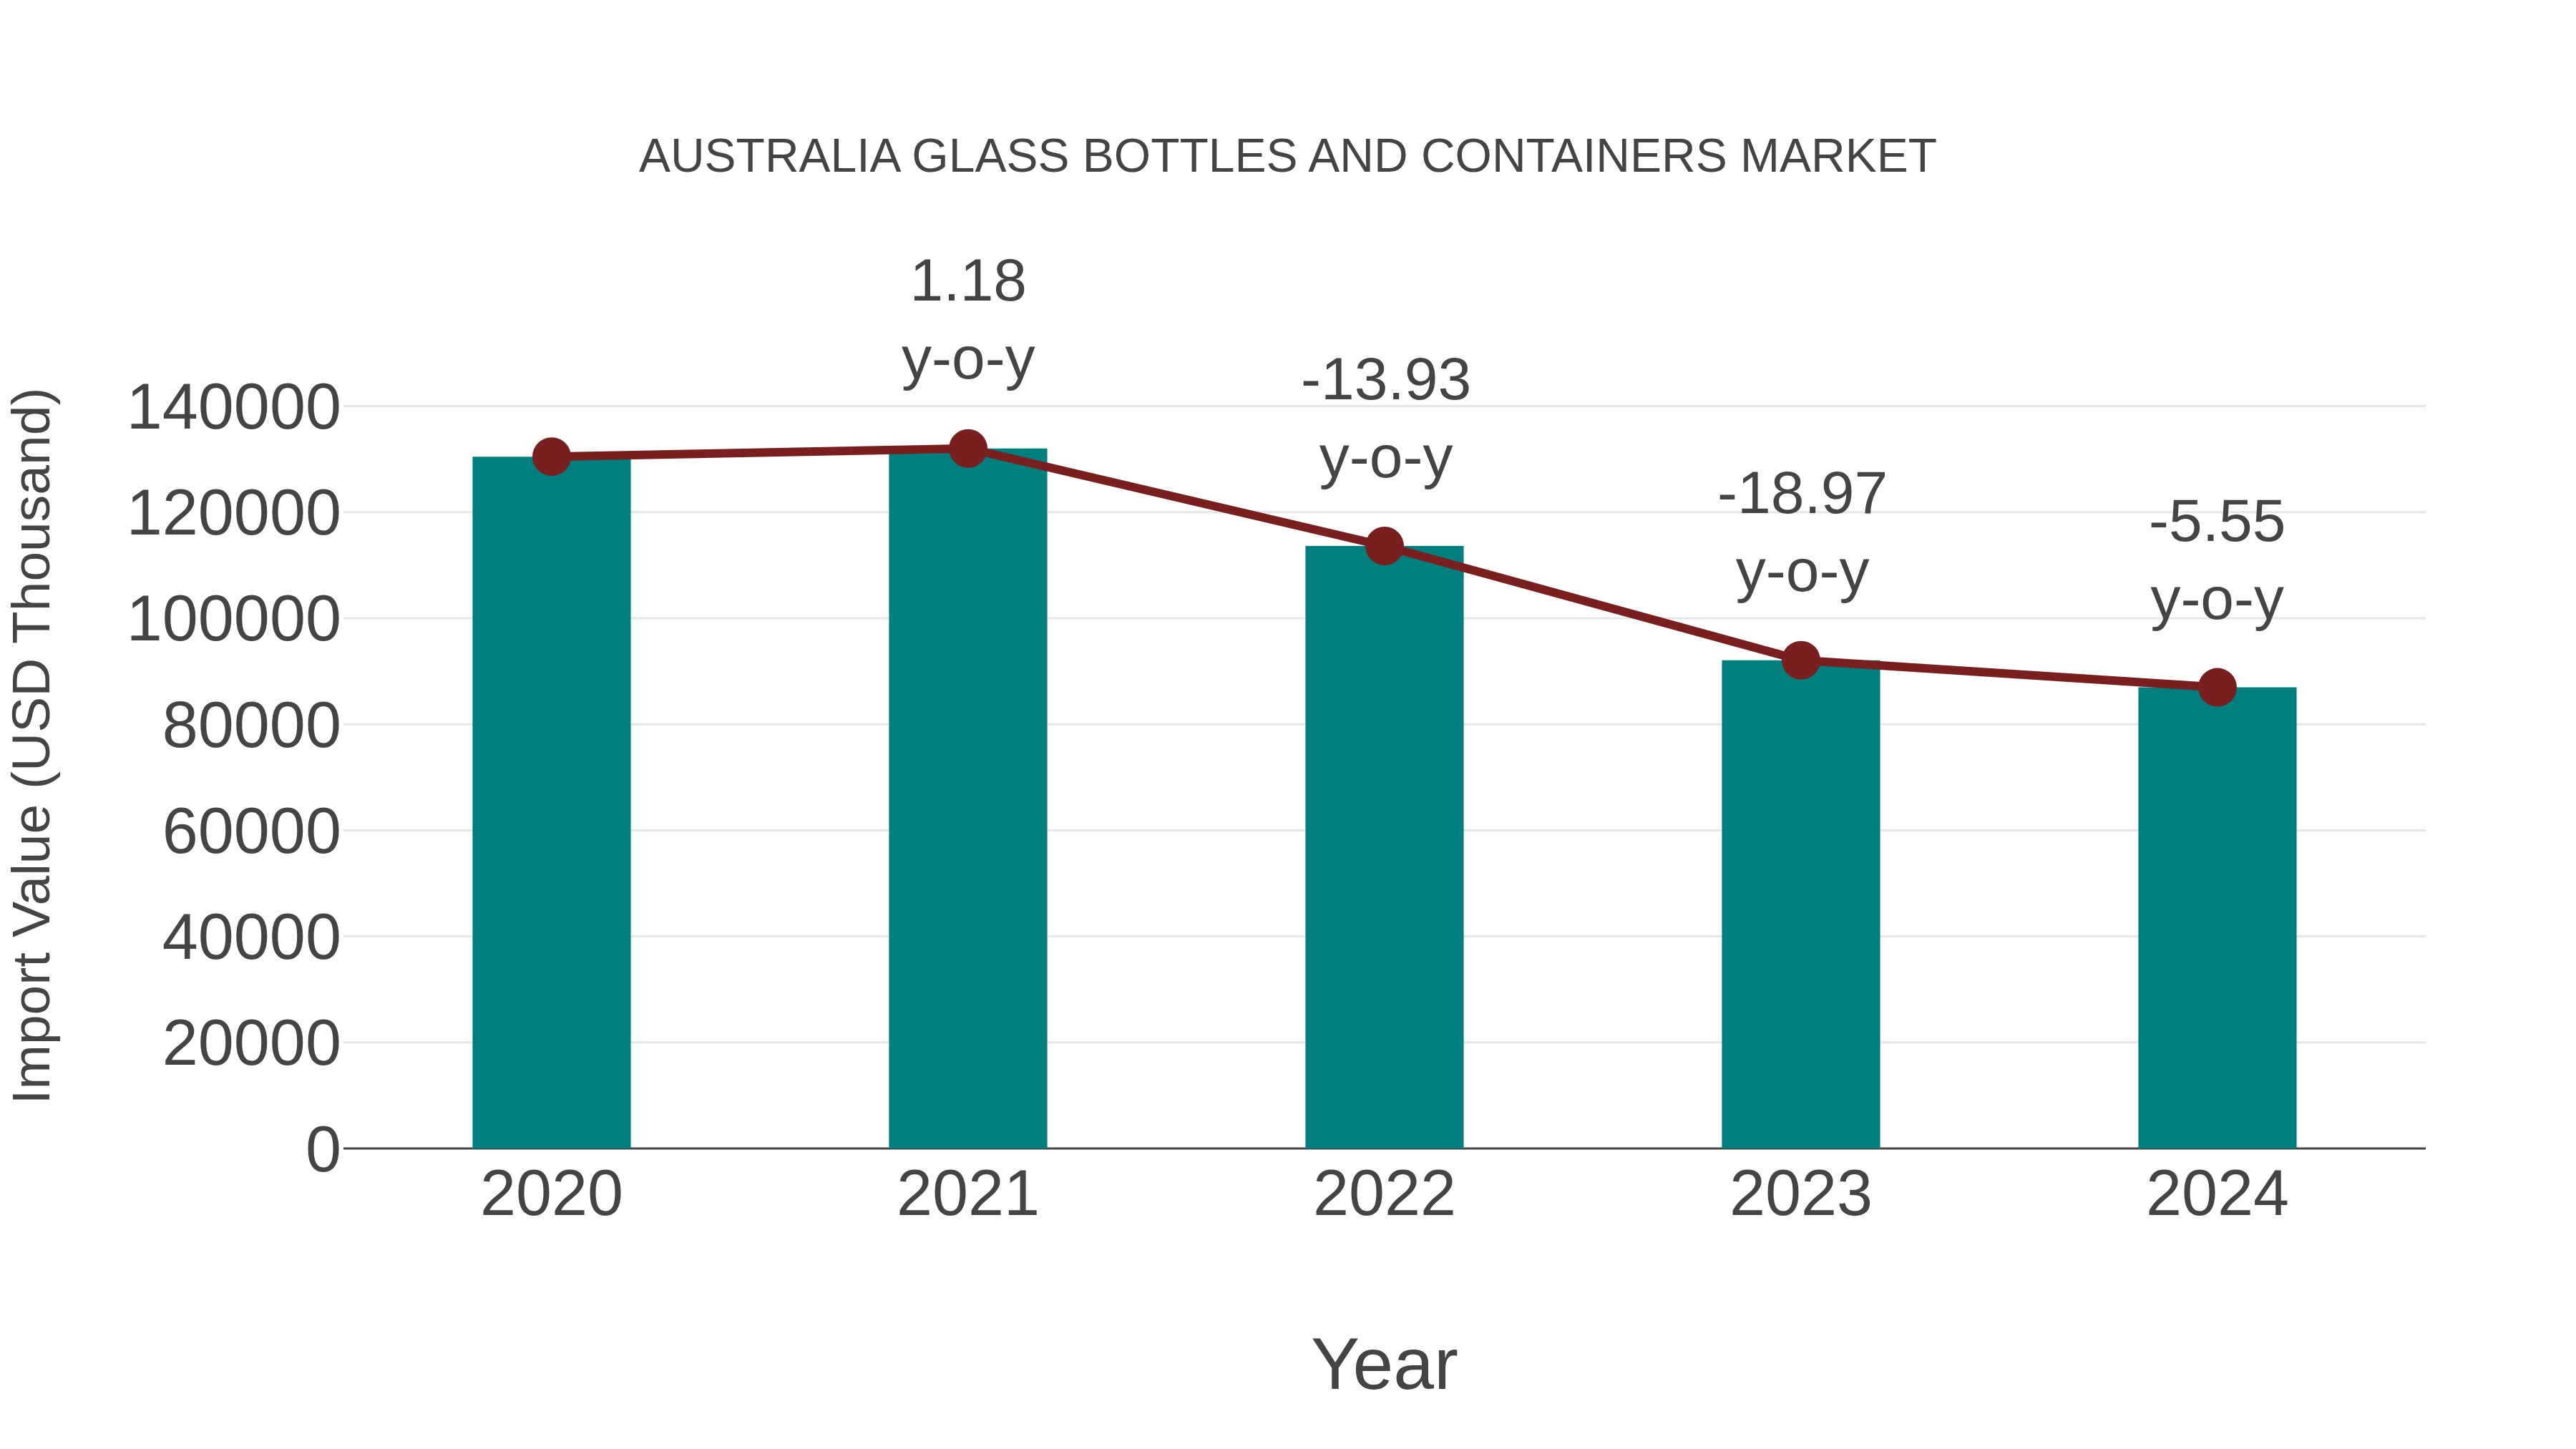
Australia Glass Bottles and Containers Market: Import Trend Analysis
In the Australia glass bottles and containers market, the import trend experienced a decline from 2023 to 2024, with a growth rate of -5.55%. The compound annual growth rate (CAGR) for the period 2020-2024 stood at -9.65%. This downward momentum could be attributed to shifting consumer preferences, changes in trade policies, or market saturation.
Australia Glass Bottles and Containers Market Overview
The market for glass bottles and containers encompasses a wide range of products catering to diverse industries such as food and beverage, healthcare, and personal care. Australia consumers value glass packaging for its quality, safety, and environmental benefits.
Drivers of the market
The glass bottles and containers market in Australia is experiencing steady growth driven by diverse applications across industries such as food and beverage, pharmaceuticals, and cosmetics. Glass containers, valued for their purity, preservation properties, and recyclability, are preferred for packaging a wide range of products. The demand for premium and eco-friendly packaging solutions is fueling market expansion, with consumers increasingly choosing glass containers for their aesthetic appeal and sustainability credentials. Additionally, innovations in glass manufacturing processes, such as lightweighting and customization capabilities, are driving product differentiation and market competitiveness.
Challenges of the market
The Australia glass bottles and containers market encounters challenges related to sustainability, competition, and changing consumer preferences. While glass containers are favored for their recyclability and preservation qualities, concerns about energy-intensive manufacturing processes and transportation costs impact their market position. Moreover, competition from alternative packaging materials such as plastics and metals adds pressure on glass container manufacturers to differentiate their products and enhance value propositions. Collaborating with recyclers, investing in eco-friendly production technologies, and diversifying product offerings to cater to niche markets are essential strategies to navigate these challenges.
Government Policy of the market
Government policies regarding packaging materials, recycling initiatives, and waste management influence the glass bottles and containers market in Australia. Regulations promoting sustainable packaging solutions, reducing plastic waste, and improving recycling infrastructure impact market trends. Additionally, industry standards for packaging materials and quality control may influence consumer preferences and purchasing decisions.
Key Highlights of the Report:
- Australia Glass Bottles and Containers Market Outlook
- Market Size of Australia Glass Bottles and Containers Market, 2025
- Forecast of Australia Glass Bottles and Containers Market, 2032
- Historical Data and Forecast of Australia Glass Bottles and Containers Revenues & Volume for the Period 2022-2032F
- Australia Glass Bottles and Containers Market Trend Evolution
- Australia Glass Bottles and Containers Market Drivers and Challenges
- Australia Glass Bottles and Containers Price Trends
- Australia Glass Bottles and Containers Porter's Five Forces
- Australia Glass Bottles and Containers Industry Life Cycle
- Historical Data and Forecast of Australia Glass Bottles and Containers Market Revenues & Volume By End-user for the Period 2022-2032F
- Historical Data and Forecast of Australia Glass Bottles and Containers Market Revenues & Volume By Bevarages for the Period 2022-2032F
- Historical Data and Forecast of Australia Glass Bottles and Containers Market Revenues & Volume By Food for the Period 2022-2032F
- Historical Data and Forecast of Australia Glass Bottles and Containers Market Revenues & Volume By Cosmetics for the Period 2022-2032F
- Historical Data and Forecast of Australia Glass Bottles and Containers Market Revenues & Volume By Pharmaceutical for the Period 2022-2032F
- Historical Data and Forecast of Australia Glass Bottles and Containers Market Revenues & Volume By Others for the Period 2022-2032F
- Australia Glass Bottles and Containers Import Export Trade Statistics
- Market Opportunity Assessment By End-user
- Australia Glass Bottles and Containers Top Companies Market Share
- Australia Glass Bottles and Containers Competitive Benchmarking By Technical and Operational Parameters
- Australia Glass Bottles and Containers Company Profiles
- Australia Glass Bottles and Containers Key Strategic Recommendations
Australia Glass Bottles and Containers Market (2026-2032): FAQs
6Wresearch actively monitors the Australia Glass Bottles and Containers Market and publishes its comprehensive annual report, highlighting emerging trends, growth drivers, revenue analysis, and forecast outlook. Our insights help businesses to make data-backed strategic decisions with ongoing market dynamics. Our analysts track relevent industries related to the Australia Glass Bottles and Containers Market, allowing our clients with actionable intelligence and reliable forecasts tailored to emerging regional needs.
Yes, we provide customisation as per your requirements. To learn more, feel free to contact us on sales@6wresearch.com
1 Executive Summary |
2 Introduction |
2.1 Key Highlights of the Report |
2.2 Report Description |
2.3 Market Scope & Segmentation |
2.4 Research Methodology |
2.5 Assumptions |
3 Australia Glass Bottles and Containers Market Overview |
3.1 Australia Country Macro Economic Indicators |
3.2 Australia Glass Bottles and Containers Market Revenues & Volume, 2022 & 2032F |
3.3 Australia Glass Bottles and Containers Market - Industry Life Cycle |
3.4 Australia Glass Bottles and Containers Market - Porter's Five Forces |
3.5 Australia Glass Bottles and Containers Market Revenues & Volume Share, By End-user, 2022 & 2032F |
4 Australia Glass Bottles and Containers Market Dynamics |
4.1 Impact Analysis |
4.2 Market Drivers |
4.2.1 Growing demand for eco-friendly packaging solutions |
4.2.2 Increasing emphasis on sustainable practices and recycling |
4.2.3 Expansion of the food and beverage industry in Australia |
4.3 Market Restraints |
4.3.1 High production costs associated with glass manufacturing |
4.3.2 Competition from alternative packaging materials like plastic and aluminum |
5 Australia Glass Bottles and Containers Market Trends |
6 Australia Glass Bottles and Containers Market, By Types |
6.1 Australia Glass Bottles and Containers Market, By End-user |
6.1.1 Overview and Analysis |
6.1.2 Australia Glass Bottles and Containers Market Revenues & Volume, By End-user, 2022-2032F |
6.1.3 Australia Glass Bottles and Containers Market Revenues & Volume, By Bevarages, 2022-2032F |
6.1.4 Australia Glass Bottles and Containers Market Revenues & Volume, By Food, 2022-2032F |
6.1.5 Australia Glass Bottles and Containers Market Revenues & Volume, By Cosmetics, 2022-2032F |
6.1.6 Australia Glass Bottles and Containers Market Revenues & Volume, By Pharmaceutical, 2022-2032F |
6.1.7 Australia Glass Bottles and Containers Market Revenues & Volume, By Others, 2022-2032F |
7 Australia Glass Bottles and Containers Market Import-Export Trade Statistics |
7.1 Australia Glass Bottles and Containers Market Export to Major Countries |
7.2 Australia Glass Bottles and Containers Market Imports from Major Countries |
8 Australia Glass Bottles and Containers Market Key Performance Indicators |
8.1 Percentage of recycled glass used in production |
8.2 Energy efficiency in glass manufacturing processes |
8.3 Adoption rate of glass packaging by new industries |
8.4 Innovation in glass bottle design and functionality |
8.5 Consumer perception and preference towards glass packaging |
9 Australia Glass Bottles and Containers Market - Opportunity Assessment |
9.1 Australia Glass Bottles and Containers Market Opportunity Assessment, By End-user, 2022 & 2032F |
10 Australia Glass Bottles and Containers Market - Competitive Landscape |
10.1 Australia Glass Bottles and Containers Market Revenue Share, By Companies, 2025 |
10.2 Australia Glass Bottles and Containers Market Competitive Benchmarking, By Operating and Technical Parameters |
11 Company Profiles |
12 Recommendations |
13 Disclaimer |
Global Go To Market Strategy - 2030
Export potential enables firms to identify high-growth global markets with greater confidence by combining advanced trade intelligence with a structured quantitative methodology. The framework analyzes emerging demand trends and country-level import patterns while integrating macroeconomic and trade datasets such as GDP and population forecasts, bilateral import–export flows, tariff structures, elasticity differentials between developed and developing economies, geographic distance, and import demand projections. Using weighted trade values from 2020–2024 as the base period to project country-to-country export potential for 2030, these inputs are operationalized through calculated drivers such as gravity model parameters, tariff impact factors, and projected GDP per-capita growth. Through an analysis of hidden potentials, demand hotspots, and market conditions that are most favorable to success, this method enables firms to focus on target countries, maximize returns, and global expansion with data, backed by accuracy.
By factoring in the projected importer demand gap that is currently unmet and could be potential opportunity, it identifies the potential for the Exporter (Country) among 190 countries, against the general trade analysis, which identifies the biggest importer or exporter.
To discover high-growth global markets and optimize your business strategy:
Click Here
Pricing
- Single User License$ 1,995
- Department License$ 2,400
- Site License$ 3,120
- Global License$ 3,795

Leadership Perspectives from Industry Events
Search
Thought Leadership and Analyst Meet


Our Clients
6WResearch In News
- India Air Conditioner Market Set for Strong Rebound in 2026 After Weather-Led Correction and GST-Driven Recovery: 6Wresearch
- ADAS in India: How Automatic Emergency Braking, Blind Spot Detection & Driver Monitoring are Transforming Road Safety
- Doha a strategic location for EV manufacturing hub: IPA Qatar
- Demand for luxury TVs surging in the GCC, says Samsung
- Empowering Growth: The Thriving Journey of Bangladesh’s Cable Industry
- Demand for luxury TVs surging in the GCC, says Samsung
Latest Reports
- Nicaragua RPG Gaming Market (2026-2032)
- New Zealand RPG Gaming Market (2026-2032)
- Netherlands RPG Gaming Market (2026-2032)
- Nauru RPG Gaming Market (2026-2032)
- Namibia RPG Gaming Market (2026-2032)
- Mozambique RPG Gaming Market (2026-2032)
- Montenegro RPG Gaming Market (2026-2032)
- Mongolia RPG Gaming Market (2026-2032)
- Monaco RPG Gaming Market (2026-2032)
- Micronesia RPG Gaming Market (2026-2032)
Industry Events and Analyst Meet

EV India Expo 2026

HIMTEX 2026

India Refining Summit 2026

India EV Show 2026

EV tech India Expo 2026
Whitepaper
- Middle East & Africa Commercial Security Market Click here to view more.
- Middle East & Africa Fire Safety Systems & Equipment Market Click here to view more.
- GCC Drone Market Click here to view more.
- Middle East Lighting Fixture Market Click here to view more.
- GCC Physical & Perimeter Security Market Click here to view more.