Australia Glucose Market Outlook | Share, Industry, COVID-19 IMPACT, Growth, Size, Trends, Revenue, Companies, Value, Forecast & Analysis
Market Forecast By Source (Wheat, Corn, Others), By Type (Food and Beverage, Pharmaceuticals, Others) And Competitive Landscape
| Product Code: ETC126033 | Publication Date: Jun 2021 | Updated Date: Jan 2026 | Product Type: Report | |
| Publisher: 6Wresearch | Author: Ravi Bhandari | No. of Pages: 70 | No. of Figures: 35 | No. of Tables: 5 |
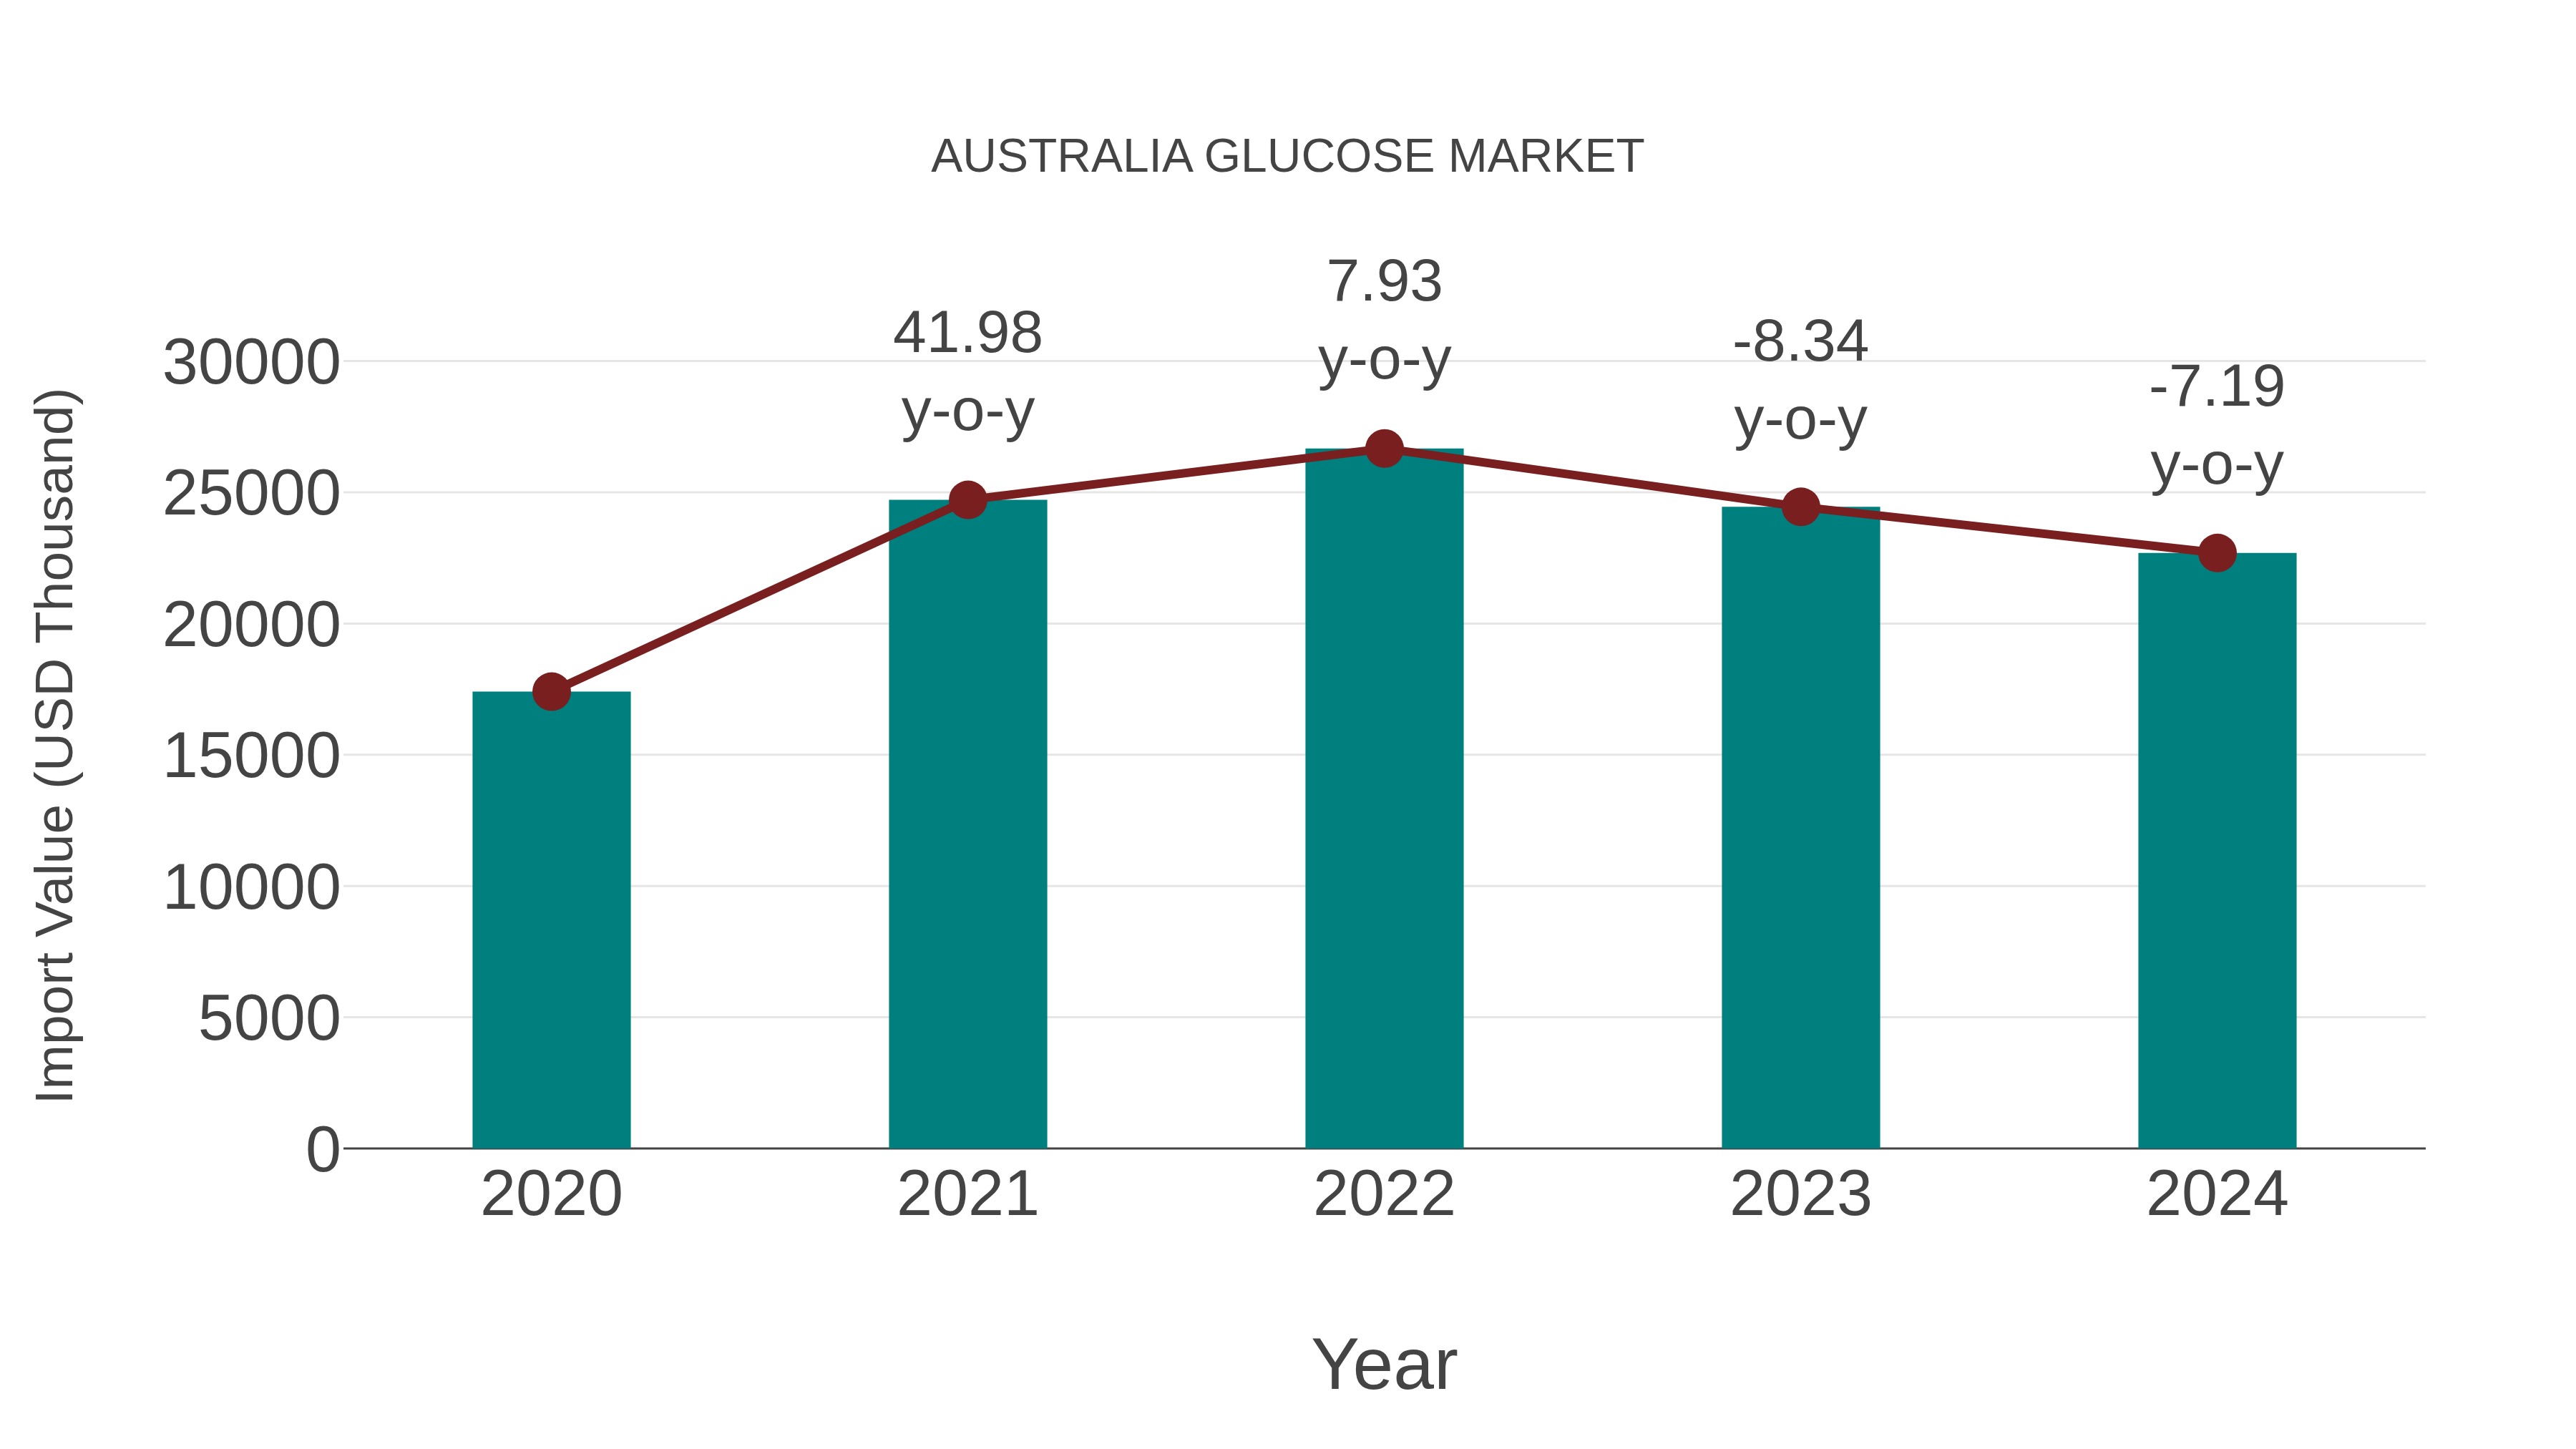
Australia Glucose Market: Import Trend Analysis
Australia`s import trend for the glucose market experienced a decline in growth rate from 2023 to 2024, with a decrease of -7.19%. However, the compound annual growth rate (CAGR) for the period of 2020-2024 stood at a positive 6.85%. This shift in momentum could be attributed to changing consumer preferences, shifts in trade policies, or market stabilization efforts.
Australia Glucose Market Overview
Glucose, a simple sugar, serves as a primary source of energy in the human body and finds applications in food and beverage production, medical formulations, and sports nutrition. The market in Australia caters to diverse consumer preferences for natural, low-calorie, and functional glucose products.
Drivers of the market
The glucose market in Australia is witnessing growth driven by its diverse applications in food and beverage manufacturing, pharmaceutical formulations, and industrial processes. Glucose, a simple sugar derived from carbohydrates such as corn starch or wheat, serves as a primary source of energy and a key ingredient in various products, including confectionery, baked goods, beverages, and pharmaceuticals. The increasing demand for natural and clean-label ingredients is fueling market expansion, with glucose being preferred for its versatility, sweetness, and compatibility with other ingredients. Moreover, the rising prevalence of lifestyle-related health conditions is driving the demand for low-calorie and low-glycemic index sweeteners, further boosting market growth.
Challenges of the market
The Australia glucose market faces challenges related to fluctuating raw material prices, regulatory compliance, and competition from alternative sweeteners. Glucose, a simple sugar derived from starch hydrolysis, finds applications in various industries such as food and beverage, pharmaceuticals, and cosmetics. However, fluctuations in raw material prices, particularly corn and wheat, impact glucose production costs and pricing competitiveness. Moreover, compliance with food safety regulations and labeling requirements adds complexity to product development and marketing efforts. Additionally, competition from alternative sweeteners such as high-fructose corn syrup and artificial sweeteners poses challenges for traditional glucose manufacturers. To address these challenges, market players must enhance supply chain management, invest in sustainable sourcing practices, and innovate in product formulations to meet evolving consumer preferences and market demands.
Government Policy of the market
The Australia government regulates the production, distribution, and marketing of glucose products to ensure compliance with food safety standards and consumer protection laws. Regulations on product labeling, quality control, and advertising practices are enforced to maintain market integrity. Additionally, policies promoting healthy eating habits and supporting local food industries may influence market dynamics.
Key Highlights of the Report:
- Australia Glucose Market Outlook
- Market Size of Australia Glucose Market, 2024
- Forecast of Australia Glucose Market, 2031
- Historical Data and Forecast of Australia Glucose Revenues & Volume for the Period 2018 - 2031
- Australia Glucose Market Trend Evolution
- Australia Glucose Market Drivers and Challenges
- Australia Glucose Price Trends
- Australia Glucose Porter's Five Forces
- Australia Glucose Industry Life Cycle
- Historical Data and Forecast of Australia Glucose Market Revenues & Volume By Source for the Period 2018 - 2031
- Historical Data and Forecast of Australia Glucose Market Revenues & Volume By Wheat for the Period 2018 - 2031
- Historical Data and Forecast of Australia Glucose Market Revenues & Volume By Corn for the Period 2018 - 2031
- Historical Data and Forecast of Australia Glucose Market Revenues & Volume By Others for the Period 2018 - 2031
- Historical Data and Forecast of Australia Glucose Market Revenues & Volume By Type for the Period 2018 - 2031
- Historical Data and Forecast of Australia Glucose Market Revenues & Volume By Food and Beverage for the Period 2018 - 2031
- Historical Data and Forecast of Australia Glucose Market Revenues & Volume By Pharmaceuticals for the Period 2018 - 2031
- Historical Data and Forecast of Australia Glucose Market Revenues & Volume By Others for the Period 2018 - 2031
- Australia Glucose Import Export Trade Statistics
- Market Opportunity Assessment By Source
- Market Opportunity Assessment By Type
- Australia Glucose Top Companies Market Share
- Australia Glucose Competitive Benchmarking By Technical and Operational Parameters
- Australia Glucose Company Profiles
- Australia Glucose Key Strategic Recommendations
Frequently Asked Questions About the Market Study (FAQs):
6Wresearch actively monitors the Australia Glucose Market and publishes its comprehensive annual report, highlighting emerging trends, growth drivers, revenue analysis, and forecast outlook. Our insights help businesses to make data-backed strategic decisions with ongoing market dynamics. Our analysts track relevent industries related to the Australia Glucose Market, allowing our clients with actionable intelligence and reliable forecasts tailored to emerging regional needs.
Yes, we provide customisation as per your requirements. To learn more, feel free to contact us on sales@6wresearch.com
Australia Glucose |
1 Executive Summary |
2 Introduction |
2.1 Key Highlights of the Report |
2.2 Report Description |
2.3 Market Scope & Segmentation |
2.4 Research Methodology |
2.5 Assumptions |
3 Australia Glucose Market Overview |
3.1 Australia Country Macro Economic Indicators |
3.2 Australia Glucose Market Revenues & Volume, 2021 & 2031F |
3.3 Australia Glucose Market - Industry Life Cycle |
3.4 Australia Glucose Market - Porter's Five Forces |
3.5 Australia Glucose Market Revenues & Volume Share, By Source, 2021 & 2031F |
3.6 Australia Glucose Market Revenues & Volume Share, By Type, 2021 & 2031F |
4 Australia Glucose Market Dynamics |
4.1 Impact Analysis |
4.2 Market Drivers |
4.2.1 Increasing prevalence of diabetes in Australia |
4.2.2 Growing consumer awareness about health and wellness |
4.2.3 Rise in demand for natural and low-calorie sweeteners |
4.3 Market Restraints |
4.3.1 Stringent regulations on sugar substitutes and sweeteners |
4.3.2 Competition from alternative sweeteners like stevia and monk fruit |
5 Australia Glucose Market Trends |
6 Australia Glucose Market, By Types |
6.1 Australia Glucose Market, By Source |
6.1.1 Overview and Analysis |
6.1.2 Australia Glucose Market Revenues & Volume, By Source, 2021-2031F |
6.1.3 Australia Glucose Market Revenues & Volume, By Wheat, 2021-2031F |
6.1.4 Australia Glucose Market Revenues & Volume, By Corn, 2021-2031F |
6.1.5 Australia Glucose Market Revenues & Volume, By Others, 2021-2031F |
6.2 Australia Glucose Market, By Type |
6.2.1 Overview and Analysis |
6.2.2 Australia Glucose Market Revenues & Volume, By Food and Beverage, 2021-2031F |
6.2.3 Australia Glucose Market Revenues & Volume, By Pharmaceuticals, 2021-2031F |
6.2.4 Australia Glucose Market Revenues & Volume, By Others, 2021-2031F |
7 Australia Glucose Market Import-Export Trade Statistics |
7.1 Australia Glucose Market Export to Major Countries |
7.2 Australia Glucose Market Imports from Major Countries |
8 Australia Glucose Market Key Performance Indicators |
8.1 Consumer demand for sugar-free products |
8.2 Adoption rate of glucose substitutes in food and beverages industry |
8.3 Growth in the usage of glucose in pharmaceuticals industry |
9 Australia Glucose Market - Opportunity Assessment |
9.1 Australia Glucose Market Opportunity Assessment, By Source, 2021 & 2031F |
9.2 Australia Glucose Market Opportunity Assessment, By Type, 2021 & 2031F |
10 Australia Glucose Market - Competitive Landscape |
10.1 Australia Glucose Market Revenue Share, By Companies, 2024 |
10.2 Australia Glucose Market Competitive Benchmarking, By Operating and Technical Parameters |
11 Company Profiles |
12 Recommendations |
13 Disclaimer |
Export potential assessment - trade Analytics for 2030
Export potential enables firms to identify high-growth global markets with greater confidence by combining advanced trade intelligence with a structured quantitative methodology. The framework analyzes emerging demand trends and country-level import patterns while integrating macroeconomic and trade datasets such as GDP and population forecasts, bilateral import–export flows, tariff structures, elasticity differentials between developed and developing economies, geographic distance, and import demand projections. Using weighted trade values from 2020–2024 as the base period to project country-to-country export potential for 2030, these inputs are operationalized through calculated drivers such as gravity model parameters, tariff impact factors, and projected GDP per-capita growth. Through an analysis of hidden potentials, demand hotspots, and market conditions that are most favorable to success, this method enables firms to focus on target countries, maximize returns, and global expansion with data, backed by accuracy.
By factoring in the projected importer demand gap that is currently unmet and could be potential opportunity, it identifies the potential for the Exporter (Country) among 190 countries, against the general trade analysis, which identifies the biggest importer or exporter.
To discover high-growth global markets and optimize your business strategy:
Click Here
Pricing
- Single User License$ 1,995
- Department License$ 2,400
- Site License$ 3,120
- Global License$ 3,795

Search
Thought Leadership and Analyst Meet


Our Clients
Latest Reports
- United Kingdom (UK) Long-term Care Insurance Market (2026-2032) | Growth, Share, Consumer Insights, Drivers, Opportunities, Competition, Pricing Analysis, Segments, Restraints, Companies, Competitive, Value, Outlook, Size, Demand, Analysis, Challenges, Strategic Insights, Investment Trends, Revenue, Trends, Supply, Forecast
- United Kingdom (UK) Long Term Care Market (2026-2032) | Companies, Outlook, Analysis, Trends, Value, Revenue, Segmentation, Share, Forecast, Competitive Landscape, Growth, Size & Forecast
- Iraq Insulation and Waterproofing Market (2026-2032) | Outlook, Drivers, Growth, Size, Share, Industry, Revenue, Trends, Demand, Competitive, Strategic Insights, Opportunities, Segments, Companies, Challenges, Strategy, Consumer Insights, Analysis, Investment Trends, Value, Segmentation, Forecast, Restraints
- India Switchgear Market Outlook (2026 - 2032) | Size, Share, Trends, Growth, Revenue, Forecast, Analysis, Value, Outlook
- Pakistan Contraceptive Implants Market (2025-2031) | Demand, Growth, Size, Share, Industry, Pricing Analysis, Competitive, Strategic Insights, Strategy, Consumer Insights, Analysis, Investment Trends, Opportunities, Revenue, Segments, Value, Segmentation, Supply, Forecast, Restraints, Outlook, Competition, Drivers, Trends, Companies, Challenges
- Sri Lanka Packaging Market (2026-2032) | Outlook, Competition, Drivers, Trends, Demand, Pricing Analysis, Competitive, Strategic Insights, Companies, Challenges, Strategy, Consumer Insights, Analysis, Investment Trends, Opportunities, Growth, Size, Share, Industry, Revenue, Segments, Value, Segmentation, Supply, Forecast, Restraints
- India Kids Watches Market (2026-2032) | Strategy, Consumer Insights, Analysis, Investment Trends, Opportunities, Growth, Size, Share, Industry, Revenue, Segments, Value, Segmentation, Supply, Forecast, Restraints, Outlook, Competition, Drivers, Trends, Demand, Pricing Analysis, Competitive, Strategic Insights, Companies, Challenges
- Saudi Arabia Core Assurance Service Market (2025-2031) | Strategy, Consumer Insights, Analysis, Investment Trends, Opportunities, Growth, Size, Share, Industry, Revenue, Segments, Value, Segmentation, Supply, Forecast, Restraints, Outlook, Competition, Drivers, Trends, Demand, Pricing Analysis, Competitive, Strategic Insights, Companies, Challenges
- Romania Uninterruptible Power Supply (UPS) Market (2026-2032) | Industry, Analysis, Revenue, Size, Forecast, Outlook, Value, Trends, Share, Growth & Companies
- Saudi Arabia Car Window Tinting Film, Paint Protection Film (PPF), and Ceramic Coating Market (2025-2031) | Strategy, Consumer Insights, Analysis, Investment Trends, Opportunities, Growth, Size, Share, Industry, Revenue, Segments, Value, Segmentation, Supply, Forecast, Restraints, Outlook, Competition, Drivers, Trends, Demand, Pricing Analysis, Competitive, Strategic Insights, Companies, Challenges
Industry Events and Analyst Meet

India EV Show 2026

EV tech India Expo 2026

Auto Tech Asia 2026

Battery Tech India 2026

Smart Production Solutions Guangzhou 2026
Whitepaper
- Middle East & Africa Commercial Security Market Click here to view more.
- Middle East & Africa Fire Safety Systems & Equipment Market Click here to view more.
- GCC Drone Market Click here to view more.
- Middle East Lighting Fixture Market Click here to view more.
- GCC Physical & Perimeter Security Market Click here to view more.
6WResearch In News
- Doha a strategic location for EV manufacturing hub: IPA Qatar
- Demand for luxury TVs surging in the GCC, says Samsung
- Empowering Growth: The Thriving Journey of Bangladesh’s Cable Industry
- Demand for luxury TVs surging in the GCC, says Samsung
- Video call with a traditional healer? Once unthinkable, it’s now common in South Africa
- Intelligent Buildings To Smooth GCC’s Path To Net Zero